AI Generated Quiz
Secondary 2 Geography Fieldwork Quiz
Free Sec 2 Geography Fieldwork quiz, HY3 AI version, with questions, answers, and syllabus-aligned practice for Singapore students.
These static practice materials are generated from the site's syllabus and paper-generation workflow, with source and model context shown so students and parents can evaluate the material before use.
Questions
Secondary 2 Geography Quiz - Fieldwork
Name: ___________________________
Class: ________
Date: ____________
Score: _______ / 40
Duration: 50 minutes
Total Marks: 40
Instructions:
- This quiz has 20 questions on the topic of Fieldwork.
- Section A: Multiple-choice (1 mark each). Section B: Short structured questions (1–3 marks). Section C: Applied fieldwork scenarios (2–4 marks).
- Write your answers in the spaces provided.
- Use geographical terms where possible.
Section A: Fieldwork Basics (Questions 1–5)
-
What is the main purpose of geographical fieldwork for a Secondary 2 student? (1 mark)
A. To memorise textbook facts
B. To collect data from the real world to study geography
C. To draw maps only
D. To avoid classroom learning
-
Which of the following is a primary source of data in fieldwork? (1 mark)
A. Wikipedia article
B. A novel about a city
C. A survey you conduct with residents
D. A friend’s opinion
-
What does a quadrat help a geographer to do? (1 mark)
A. Measure wind speed
B. Sample plants or features in a fixed area
C. Draw a sketch map
D. Count vehicles
-
A transect is best described as a (1 mark)
A. Type of questionnaire
B. Line across an area to record changes
C. Photograph of a building
D. Method of calculating rainfall
-
Why is a risk assessment done before fieldwork? (1 mark)
A. To make the trip longer
B. To identify dangers and stay safe
C. To replace the teacher
D. To avoid writing a report
Section B: Methods and Tools (Questions 6–12)
-
Name one tool used to measure weather during fieldwork. (1 mark)
-
State one advantage of using a questionnaire in fieldwork. (1 mark)
-
Give one reason why a pilot study (trial run) is useful before the real fieldwork. (2 marks)
-
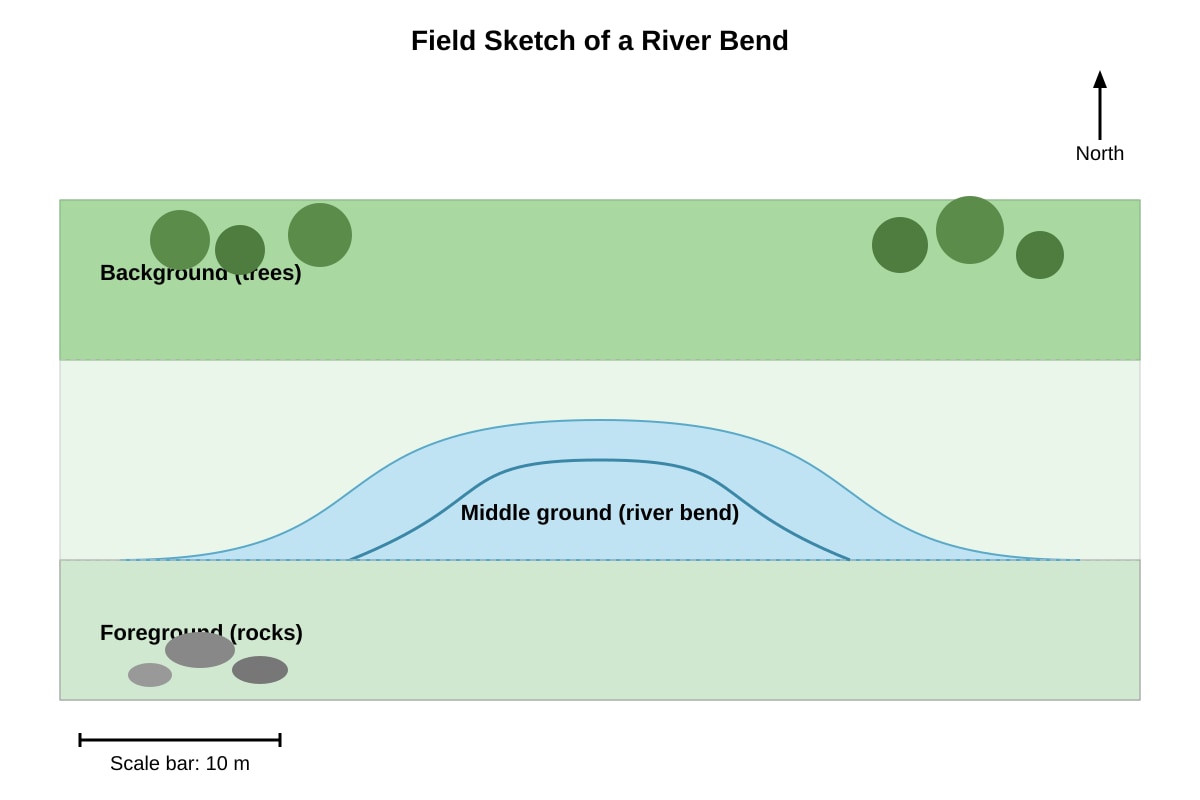
Study the diagram of a field sketch below.
Image pending generation: diagram for Q9.
State two features that should be included in a good field sketch. (2 marks)
(a) __________________________________________________
(b) __________________________________________________
-
A student records the number of cars passing a road in 10 minutes. What type of data is this? (1 mark)
A. Qualitative
B. Quantitative
C. Opinion
D. Secondary
-
Explain why sampling is used instead of counting everything in a large area. (2 marks)
-
State one way to make a sample more representative. (1 mark)
Section C: Applied Fieldwork (Questions 13–20)
-
You are asked to study litter in a park. Describe one method to collect quantitative data. (2 marks)
-
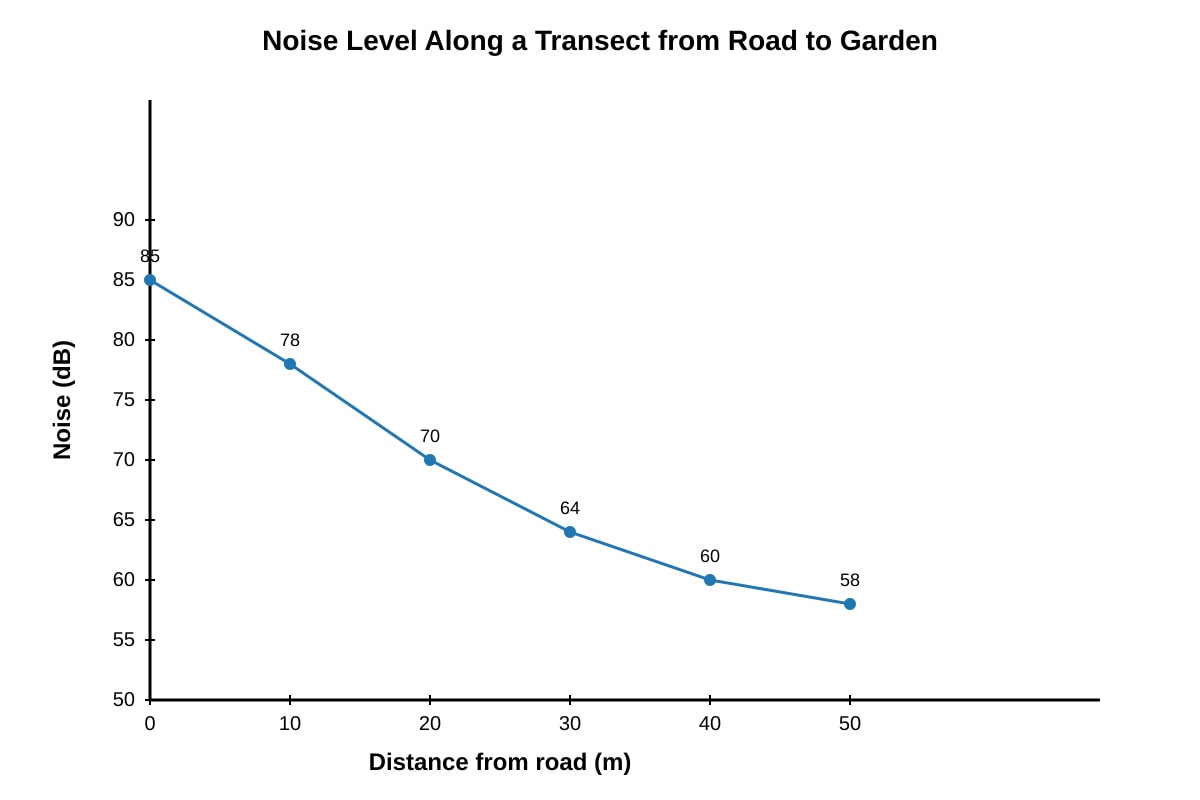
A class did a transect from a busy road to a quiet garden. They recorded noise levels.
Image pending generation: graph for Q14.
With reference to the graph, describe the trend in noise from 0 m to 50 m. (2 marks)
________________________________________________________
________________________________________________________
15. Using the same graph (Q14), calculate the decrease in noise level from 0 m to 50 m. (2 marks)
________________________________________________________
________________________________________________________
-
Explain why a fieldworker should record the weather during a study of river depth. (2 marks)
-
Two locations are suggested for a survey on public transport use:
Location X: Outside a shopping mall at 3 pm
Location Y: Inside a school compound at 3 pm
Which is more suitable? Justify your choice. (2 marks)
-
A student writes: “The park is nice.” Is this a good fieldwork observation? Explain. (2 marks)
-
State two things a fieldwork report should include. (2 marks)
(a) __________________________________________________
(b) __________________________________________________ -
Your class collected 40 pieces of litter in Area A and 10 in Area B, each of size 100 m². Calculate litter density (pieces per 100 m²) for each and state which is more littered. (4 marks)
Answers
Secondary 2 Geography Quiz - Fieldwork: Answer Key
Total Marks: 40
Topic: Fieldwork (Syllabus-aligned, generated from LLM-inferred patterns; not claimed as past-year derived.)
Section A: Fieldwork Basics
Q1. B (1 mark)
Teaching note: Fieldwork means going out to the real environment to observe and collect data, not just reading. Purpose = collect real-world data to study geography.
Q2. C (1 mark)
Teaching note: Primary source = collected by you. A survey you conduct is primary; Wikipedia is secondary.
Q3. B (1 mark)
Teaching note: Quadrat = square frame placed on ground to count plants/features in that fixed area for sampling.
Q4. B (1 mark)
Teaching note: Transect = a line across a landscape to record how features change with distance.
Q5. B (1 mark)
Teaching note: Risk assessment identifies hazards (e.g., traffic, weather) so the trip is safe.
Section B: Methods and Tools
Q6. Any one: thermometer, anemometer, rain gauge, compass. (1 mark)
Teaching note: Weather tools measure wind, temp, rain. Accept any correct tool.
Q7. Any one: collects views from many people; cheap; gives quantitative data. (1 mark)
Teaching note: Questionnaire advantage = standardised answers from respondents.
Q8. (2 marks: 1 for idea, 1 for elaboration)
e.g., “It helps test the method (1) so you can fix confusing questions before real data collection (1).”
Teaching note: Pilot study = trial to improve design.
Q9. (2 marks, 1 each)
(a) North arrow (b) Scale bar (also accept title, foreground/middle/background labels)
Teaching note: Field sketch must show direction and scale to be useful. Image shows these labels.
Q10. B (1 mark)
Teaching note: Number of cars = numerical = quantitative.
Q11. (2 marks)
- Counting all takes too long / area too big (1)
- Sampling gives estimate using less time (1)
Teaching note: Sampling saves time but must be representative.
Q12. Any one: random sampling, larger sample, multiple sites. (1 mark)
Section C: Applied Fieldwork
Q13. (2 marks)
e.g., “Place 5 quadrats randomly, count litter pieces in each, calculate total.” (method = 1, detail = 1)
Teaching note: Quantitative = numerical count.
Q14. (2 marks)
Noise decreases from 85 dB at 0 m to 58 dB at 50 m (1); gradual fall with distance (1).
Teaching note: Use graph values; trend = decrease.
Q15. (2 marks)
Decrease = 85 – 58 = 27 dB (2 for working + answer)
Working: 85 dB (0 m) − 58 dB (50 m) = 27 dB.
Teaching note: Subtract start from end.
Q16. (2 marks)
Rain can raise river depth (1); record weather to explain changes (1).
Teaching note: Weather is a variable affecting physical data.
Q17. (2 marks)
Location X (1); more public transport users present at mall (1).
Teaching note: Representativeness – sample the population of interest.
Q18. (2 marks)
No (1); “nice” is opinion, not observable/measurable (1).
Teaching note: Good observation is factual e.g., “10 benches”.
Q19. (2 marks, 1 each)
Any two: aim, method, results, conclusion, map.
Teaching note: Report communicates process and findings.
Q20. (4 marks)
Area A: 40 pieces / 100 m² = 40 per 100 m² (1)
Area B: 10 / 100 m² = 10 per 100 m² (1)
A is more littered (1) because density higher (1).
Teaching note: Density = count / area; compare directly.
Free quiz and exam paper access
Enter your details to view this paper
Your access is remembered on this device.