AI Generated Quiz
Secondary 2 Geography Fieldwork Quiz
Free Sec 2 Geography Fieldwork quiz, AI version, with questions, answers, and syllabus-aligned practice for Singapore students.
These static practice materials are generated from the site's syllabus and paper-generation workflow, with source and model context shown so students and parents can evaluate the material before use.
Questions
Free quiz and exam paper access
Enter your details to view this paper
Your access is remembered on this device.
Answers
Secondary 2 Geography Quiz - Fieldwork: Answer Key
Total Marks: 40
Section A: Fieldwork Planning and Methods (Questions 1 – 5)
1. State the aim of a fieldwork investigation you could conduct to study the quality of life in a housing estate in Singapore. [1 mark]
Answer: To investigate the quality of life in [name of housing estate] by examining factors such as cleanliness, noise levels, and availability of facilities.
Explanation: The aim of a fieldwork investigation is a clear, focused statement that explains what you want to find out. It should include the location and the topic being studied. For quality of life, you might look at environmental factors (like cleanliness and noise) or social factors (like community spaces).
Marking Notes: Accept any reasonable aim that clearly states the purpose and location. Award 1 mark for a clear aim.
2. A group of students wants to find out how people use a local park. They decide to use a questionnaire survey. <br> (a) Give one advantage of using a questionnaire survey for this investigation. [1 mark]
Answer: It allows the students to collect data from a large number of people quickly / It provides standardised data that is easy to compare / It can collect both quantitative and qualitative data.
Explanation: Questionnaires are a common fieldwork method because they can gather information from many respondents efficiently. Standardised questions mean everyone answers the same way, making it easier to analyse the results.
Marking Notes: Award 1 mark for any valid advantage.
<br> (b) Give **one disadvantage** of using a questionnaire survey for this investigation. [1 mark]Answer: People may not be willing to stop and answer questions / Responses may not be truthful / The questions may not cover all aspects of park use / It can be time-consuming to analyse the data.
Explanation: A key challenge of questionnaires is response bias – people who agree to answer may not represent all park users. Also, people might give socially desirable answers rather than truthful ones.
Marking Notes: Award 1 mark for any valid disadvantage.
3. A student is investigating the types of shops along a street in a town centre. She plans to record the location of each shop on a map. <br> (a) Name the fieldwork technique the student is using. [1 mark]
Answer: Land use mapping / Field sketching / Annotation on a base map.
Explanation: Recording features on a map is a common fieldwork technique. A base map (a simple map of the area) is used to mark the location and type of each shop. This is a form of land use mapping.
Marking Notes: Award 1 mark for "land use mapping" or "field sketching" or "annotation". Do not accept just "mapping" without context.
<br> (b) Suggest **one reason** why using a map to record shop locations is better than just writing a list of shop names. [1 mark]Answer: A map shows the spatial pattern / distribution of shops, whereas a list does not show where they are located / A map allows you to see which shops are near each other / A map helps identify clusters of similar shops.
Explanation: Geography is about space and place. A map is a powerful tool because it shows the location and pattern of features, not just what they are. This helps geographers analyse why shops are located where they are.
Marking Notes: Award 1 mark for any valid reason that highlights the spatial advantage of a map.
4. Study the two locations below for conducting a traffic count survey.
- Location X: A main road outside a school, 8 a.m. on a weekday.
- Location Y: A quiet residential street, 3 p.m. on a Sunday.
Which location is more suitable for investigating the impact of traffic on air pollution near the school? Justify your choice. [2 marks]
Answer: Location X is more suitable. This is because it is a main road outside a school, and the survey is conducted at 8 a.m. on a weekday, which is during the morning rush hour when traffic is heavy. This would provide data on the traffic levels that directly affect the school environment. Location Y is a quiet street on a Sunday afternoon, so it would not show the impact of traffic on the school.
Explanation: The suitability of a fieldwork location depends on the aim of the investigation. Here, the aim is to investigate the impact of traffic on air pollution near the school. Therefore, the location should be near the school and at a time when traffic is high. Location X meets both criteria.
Marking Notes:
- 1 mark for choosing Location X.
- 1 mark for a valid justification linking location and time to the investigation aim.
5. A student wants to investigate whether the noise level in a shopping mall is higher on a Saturday than on a weekday. Describe a sampling method the student could use to collect data at regular intervals. [2 marks]
Answer: The student could use systematic sampling. For example, they could take a noise level reading every 30 minutes from 10 a.m. to 8 p.m. on both a Saturday and a weekday. This ensures data is collected at regular intervals and allows for a fair comparison between the two days.
Explanation: Systematic sampling involves selecting samples at regular intervals (e.g., every 30 minutes, every 10th person). This is useful for collecting data over time because it ensures even coverage and avoids bias in choosing when to measure.
Marking Notes:
- 1 mark for naming the sampling method (systematic sampling).
- 1 mark for describing how it would be applied (e.g., every 30 minutes).
Section B: Data Collection and Recording (Questions 6 – 10)
6. A class is conducting a fieldwork study on litter in a park. They divide the park into a grid of 10 m × 10 m squares and randomly select five squares to survey. Name this sampling method. [1 mark]
Answer: Random sampling / Stratified random sampling.
Explanation: Random sampling means every square has an equal chance of being selected. If the park is divided into a grid, this is a form of stratified sampling (dividing the area into strata/grid squares) followed by random selection within those strata.
Marking Notes: Award 1 mark for "random sampling" or "stratified random sampling".
7. Study the table below showing part of a fieldwork data collection sheet for a river study.
| Site | Width of river (m) | Depth of river (cm) | Speed of flow (m/s) |
|---|---|---|---|
| A | 2.5 | 30 | 0.4 |
| B | 4.0 | 55 | 0.8 |
| C | 1.8 | 20 | 0.3 |
Answer: The site (location along the river).
Explanation: The independent variable is the one that is changed or selected by the researcher. In this case, the students chose different sites along the river to measure. The width, depth, and speed are dependent variables that are measured at each site.
Marking Notes: Award 1 mark for "site" or "location". Do not accept "width", "depth", or "speed" as these are dependent variables.
<br> (b) Describe the **relationship** between the width of the river and the speed of flow shown in the data. [1 mark]Answer: As the width of the river increases, the speed of flow also increases. (Or: There is a positive correlation between width and speed.)
Explanation: Looking at the data: Site A (width 2.5m, speed 0.4 m/s), Site B (width 4.0m, speed 0.8 m/s), Site C (width 1.8m, speed 0.3 m/s). When width is larger, speed is higher. This is a positive relationship.
Marking Notes: Award 1 mark for correctly describing the positive relationship. Do not accept just stating the data without describing the pattern.
8. A student is using a photograph to record evidence of environmental quality in a neighbourhood. Give one advantage of using photographs as a fieldwork recording method. [1 mark]
Answer: Photographs provide a visual record that can be re-examined later / They capture details that might be missed when writing notes / They provide objective evidence of conditions at the time of the survey.
Explanation: Photographs are a valuable fieldwork tool because they create a permanent, visual record. Unlike written notes, they can be reviewed later to check observations or to show others what the area looked like.
Marking Notes: Award 1 mark for any valid advantage.
9. A group of students is conducting a bipolar environmental quality survey in a park. They rate each feature (e.g., noise level, cleanliness) on a scale from –5 to +5. <br> (a) What does a score of –5 indicate? [1 mark]
Answer: A very poor environmental quality / A very negative feature (e.g., very noisy, very dirty).
Explanation: In a bipolar survey, the scale has two poles: negative and positive. A score of –5 represents the most negative or worst possible condition for that feature.
Marking Notes: Award 1 mark for indicating a very poor or negative condition.
<br> (b) What does a score of **+5** indicate? [1 mark]Answer: A very good environmental quality / A very positive feature (e.g., very quiet, very clean).
Explanation: A score of +5 represents the most positive or best possible condition for that feature.
Marking Notes: Award 1 mark for indicating a very good or positive condition.
10. A student is investigating the number of pedestrians using a pedestrian crossing. She counts pedestrians for 5 minutes every hour from 8 a.m. to 8 p.m. Name this sampling method. [1 mark]
Answer: Systematic sampling / Time-interval sampling.
Explanation: The student is taking measurements at regular time intervals (every hour). This is a form of systematic sampling, sometimes called time-interval sampling.
Marking Notes: Award 1 mark for "systematic sampling" or "time-interval sampling".
Section C: Data Presentation and Analysis (Questions 11 – 15)
11. A student has collected data on the types of land use in a neighbourhood. Suggest one suitable method of presenting this data visually and explain why it is suitable. [2 marks]
Answer: A bar graph or pie chart. A bar graph is suitable because it clearly shows the different categories of land use (e.g., residential, commercial, industrial) and allows easy comparison of the area or number of each type. A pie chart is suitable because it shows the proportion of each land use type as a percentage of the total area.
Explanation: The best method depends on what you want to show. Bar graphs are good for comparing quantities between categories. Pie charts are good for showing proportions of a whole. Both are suitable for categorical data like land use types.
Marking Notes:
- 1 mark for naming a suitable method (bar graph, pie chart, or other appropriate method).
- 1 mark for a valid explanation of why it is suitable.
12. Study the bar graph below showing the results of a traffic count survey conducted at two different locations.
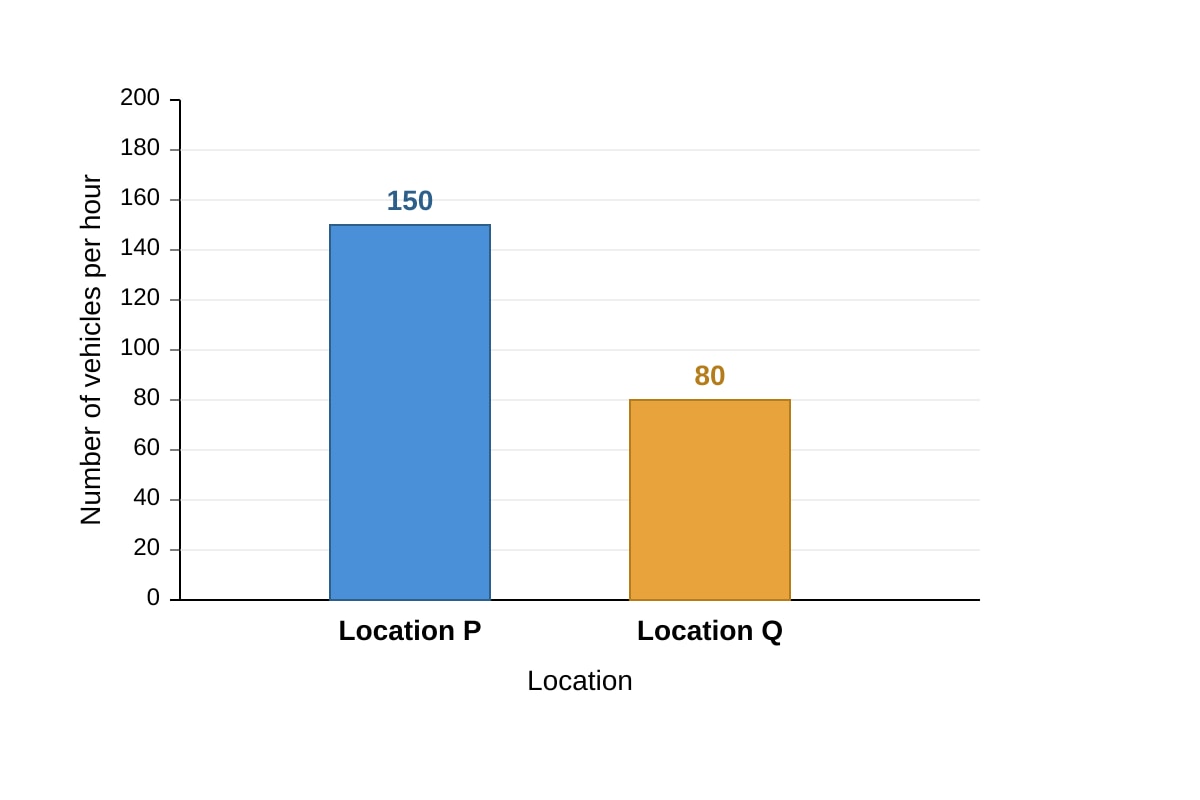
Generated graph for Q12.
<br> (a) State the number of vehicles per hour recorded at **Location P**. [1 mark]Answer: 150 vehicles per hour.
Explanation: Read the value from the bar graph. The bar for Location P reaches the 150 mark on the y-axis.
Marking Notes: Award 1 mark for "150" or "150 vehicles per hour".
<br> (b) Suggest **one possible reason** for the difference in traffic volume between Location P and Location Q. [1 mark]Answer: Location P might be a main road or near a shopping centre, while Location Q might be a quiet residential street / Location P might be near a school or workplace, while Location Q is not.
Explanation: Traffic volume varies by location. Main roads, areas near commercial centres, or routes to schools and workplaces tend to have higher traffic volumes than quiet residential streets.
Marking Notes: Award 1 mark for any reasonable suggestion that explains why one location has more traffic.
13. A student has collected data on the types of litter found in a park. The data is shown below:
| Type of Litter | Number of Items |
|---|---|
| Plastic bottles | 25 |
| Food wrappers | 40 |
| Cigarette butts | 15 |
| Cans | 20 |
Calculate the percentage of total litter that is made up of food wrappers. Show your working. [2 marks]
Working: Total number of litter items = 25 + 40 + 15 + 20 = 100 Percentage of food wrappers = (Number of food wrappers / Total number of items) × 100 = (40 / 100) × 100 = 40%
Answer: 40 %
Explanation: To calculate a percentage, divide the part (food wrappers) by the whole (total litter) and multiply by 100. First, find the total by adding all the numbers together. Then divide 40 by 100 and multiply by 100 to get 40%.
Marking Notes:
- 1 mark for correct working (showing total of 100 and correct division).
- 1 mark for correct answer (40%).
14. A student has drawn a scatter graph to show the relationship between the distance from the city centre and the number of shops. Describe the pattern you would expect to see if there is a negative correlation. [2 marks]
Answer: As the distance from the city centre increases, the number of shops decreases. The points on the scatter graph would slope downwards from left to right. For example, locations close to the city centre would have many shops, while locations far from the city centre would have few shops.
Explanation: A negative correlation means that as one variable increases, the other decreases. In this case, as distance from the city centre (x-axis) increases, the number of shops (y-axis) decreases. The points on the graph would form a downward-sloping pattern.
Marking Notes:
- 1 mark for describing the direction of the relationship (as distance increases, shops decrease).
- 1 mark for describing the visual pattern on the graph (downward slope).
15. A group of students collected data on the height of plants in a field. They recorded the following heights in centimetres: 12, 15, 18, 14, 16, 20, 13, 17. Calculate the mean height of the plants. Show your working. [2 marks]
Working: Sum of all heights = 12 + 15 + 18 + 14 + 16 + 20 + 13 + 17 = 125 cm Number of plants = 8 Mean height = Total sum / Number of plants = 125 / 8 = 15.625 cm
Answer: 15.6 cm (or 15.625 cm)
Explanation: The mean (average) is calculated by adding all the values together and dividing by the number of values. Add all the heights to get 125 cm. There are 8 plants, so divide 125 by 8 to get 15.625 cm. You can round to one decimal place (15.6 cm).
Marking Notes:
- 1 mark for correct working (showing sum and division).
- 1 mark for correct answer (15.6 cm or 15.625 cm).
Section D: Evaluation and Conclusion (Questions 16 – 20)
16. A student concluded that "the air quality in the town centre is poor" based on a survey conducted on one Saturday afternoon. Explain one limitation of this conclusion. [2 marks]
Answer: The conclusion is limited because it is based on data from only one day and time. Air quality can vary depending on the day of the week, time of day, and weather conditions. For example, a Saturday afternoon might have different traffic levels than a weekday morning. Therefore, the conclusion may not be representative of air quality at other times.
Explanation: A valid conclusion must be based on sufficient and representative data. A single survey at one time may not capture the full picture. This is a limitation of the data collection method, not necessarily that the conclusion is wrong, but that it cannot be generalised.
Marking Notes:
- 1 mark for identifying the limitation (only one time/day, not representative).
- 1 mark for explaining why this is a problem.
17. A group of students investigated whether the amount of green space affects the temperature in different parts of a city. They collected temperature readings at 10 locations. Suggest one way the students could improve the reliability of their data. [2 marks]
Answer: The students could take multiple temperature readings at each location (e.g., three readings at each site) and calculate the average. This would reduce the impact of any anomalous readings and provide a more reliable result. Alternatively, they could collect data on the same day and time to control for weather conditions.
Explanation: Reliability refers to the consistency of the data. Taking repeated measurements at each location helps to identify and reduce the effect of errors or unusual readings. Controlling other variables (like time of day) also improves reliability.
Marking Notes:
- 1 mark for a valid suggestion (e.g., repeat measurements, control variables).
- 1 mark for explaining how it improves reliability.
18. A student conducted a survey to find out how residents feel about a new cycling path. She only interviewed people she saw cycling on the path. Explain one way this could affect the validity of her results. [2 marks]
Answer: The results would not be valid because the sample is biased. The student only interviewed people who were already using the cycling path, so they are likely to have a positive view of it. The results would not represent the views of all residents, including those who do not cycle or who may have concerns about the path.
Explanation: Validity means the data actually measures what it is supposed to measure. If the aim is to find out how residents feel, the sample must include all types of residents, not just cyclists. Interviewing only cyclists introduces bias and makes the results invalid for the stated aim.
Marking Notes:
- 1 mark for identifying the bias (only interviewing cyclists).
- 1 mark for explaining how this affects validity.
19. A class investigated the quality of life in two different housing estates. They used a questionnaire with closed questions (e.g., "Rate your satisfaction with the cleanliness of your estate from 1 to 5"). Evaluate one strength and one weakness of using only closed questions in their questionnaire. [3 marks]
Strength: Closed questions produce quantitative data that is easy to compare and analyse. For example, the students can easily calculate the average satisfaction score for each estate and compare them. This makes it straightforward to identify which estate has better perceived cleanliness.
Weakness: Closed questions limit the depth of information collected. Residents may have specific reasons for their rating that the questionnaire does not capture. For example, a resident might rate cleanliness as 2 because of a specific issue like a blocked drain, but the closed question does not allow them to explain this.
Explanation: Closed questions (with fixed answer options) are good for collecting standardised, numerical data that is easy to analyse. However, they do not allow respondents to explain their answers or provide additional context. A mixed approach (using both closed and open questions) often provides a more complete picture.
Marking Notes:
- 1 mark for a valid strength with explanation.
- 1 mark for a valid weakness with explanation.
- 1 mark for using the term "quantitative" or "easy to compare" for strength, and "limited depth" or "no explanation" for weakness.
20. A student investigated whether the number of trees in a school field affects the noise level from a nearby road. She collected data at 5 locations with different numbers of trees. Her results showed that locations with more trees had lower noise levels. Write a conclusion for this investigation and suggest one way the school could use this finding. [3 marks]
Conclusion: The investigation shows that there is a negative correlation between the number of trees and the noise level. Locations with more trees have lower noise levels, suggesting that trees help to reduce noise pollution from the road.
Suggestion: The school could plant more trees along the boundary near the road to reduce noise levels in the school field, creating a quieter and more pleasant environment for students during outdoor activities.
Explanation: A conclusion should summarise the key finding and relate it back to the aim of the investigation. The suggestion should be a practical application of the finding. This demonstrates the value of fieldwork – it can inform real-world decisions.
Marking Notes:
- 1 mark for a clear conclusion that states the relationship (more trees = lower noise).
- 1 mark for a practical suggestion based on the finding.
- 1 mark for using appropriate geographical language (e.g., "negative correlation", "noise pollution").
Common Mistake: Writing a conclusion that just repeats the data without stating the relationship or its significance.