AI Generated Quiz
Secondary 2 Geography Fieldwork Quiz
Free Sec 2 Geography Fieldwork quiz, AI version, with questions, answers, and syllabus-aligned practice for Singapore students.
These static practice materials are generated from the site's syllabus and paper-generation workflow, with source and model context shown so students and parents can evaluate the material before use.
Questions
Free quiz and exam paper access
Enter your details to view this paper
Your access is remembered on this device.
Answers
Secondary 2 Geography Quiz - Fieldwork: Answer Key
Total Marks: 50
Section A: Fieldwork Planning and Methods (Questions 1–5)
Question 1
(a) Systematic sampling [1 mark]
- Explanation: Systematic sampling involves selecting samples at regular intervals. In this case, the students are taking a measurement every hour, which is a fixed interval.
(b) Any one of the following [2 marks]:
- It is easy to implement and requires less decision-making about where and when to sample.
- It provides a good spread of data across the entire time period (9 am to 9 pm), allowing the students to see how pedestrian numbers change throughout the day.
- It is less time-consuming than random sampling, as the sampling points are predetermined.
Marking Notes:
- Award 1 mark for a basic advantage (e.g., "it's easy").
- Award 2 marks for a more detailed explanation that links the advantage to the specific study context.
Question 2
(a) Any one of the following [1 mark]:
- Sound level meter / decibel meter
- Smartphone app that measures noise levels
(b) Any one of the following [2 marks]:
- To get a more representative picture of noise levels across the estate, as noise levels can vary even within the same area due to factors like building layout, trees, and other sources of noise.
- To identify any patterns or hotspots of noise, not just the difference between two specific points.
- To improve the reliability of the findings by having more data points.
Marking Notes:
- Award 1 mark for a basic reason (e.g., "to get more data").
- Award 2 marks for a more detailed explanation that shows understanding of representativeness or reliability.
Question 3
(a) Any one of the following [2 marks]:
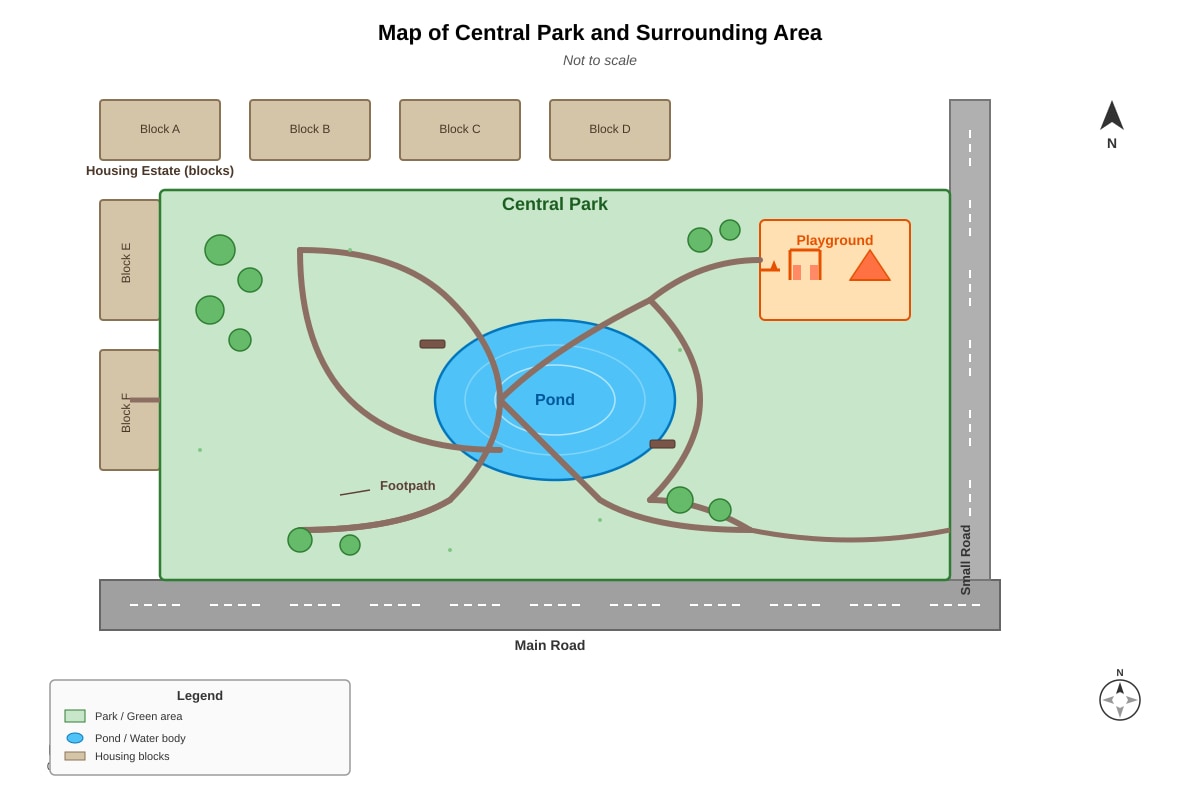
- The playground is likely used mainly by families with young children, so the survey would miss other park users such as joggers, elderly people walking, or teenagers.
- The survey would only capture the views of people using the playground, not those using other parts of the park like the pond or footpaths.
Marking Notes:
- Award 1 mark for identifying a limitation (e.g., "only families with children go there").
- Award 2 marks for explaining why this makes the location unrepresentative.
(b) Any one of the following [2 marks]:
- Near the pond: This location would attract a different group of users, such as people feeding ducks or relaxing by the water, providing a more diverse sample.
- Along the main footpath: This is a high-traffic area used by a wide variety of park users (joggers, walkers, cyclists), making it more representative.
- Near the park entrance: This would capture people as they enter and leave, giving a broad cross-section of users.
Marking Notes:
- Award 1 mark for suggesting a suitable alternative location.
- Award 1 mark for a clear explanation of why this location is more representative.
Question 4
(a) Any one of the following [2 marks]:
- Observation allows the students to see actual littering behaviour, rather than relying on people's self-reported behaviour, which may be inaccurate (people might not admit to littering).
- Observation can capture details that a questionnaire might miss, such as the time of day littering occurs or the specific types of litter dropped.
Marking Notes:
- Award 1 mark for a basic advantage (e.g., "it's more accurate").
- Award 2 marks for a more detailed explanation that contrasts observation with questionnaires.
(b) Any one of the following [1 mark]:
- The students might not be able to observe all instances of littering, as it can happen quickly or in hidden areas.
- The presence of the observers might change people's behaviour (the Hawthorne effect), making them less likely to litter.
- Observation does not provide information about why people litter, only that they do.
Question 5
(a) Any one of the following [1 mark]:
- The time of day the samples are collected.
- The depth from which the water sample is taken.
- The weather conditions (e.g., collecting after a rainstorm vs. a dry period).
- The method used to collect the sample.
(b) [2 marks]
- If the water quality at Point C (downstream) is worse than at Point A (upstream), it suggests that the town is adding pollutants to the river.
- By comparing the two points, the student can isolate the impact of the town itself, as the upstream sample provides a baseline for the river's natural water quality.
Marking Notes:
- Award 1 mark for stating that the comparison shows the town's impact.
- Award 1 mark for explaining the concept of a baseline or control (upstream sample).
Section B: Data Collection and Recording (Questions 6–10)
Question 6
(a) Total number of vehicles = 45 + 12 + 18 = 75 [1 mark]
(b) Percentage of cars = (Number of cars / Total number of vehicles) × 100% [2 marks] = (45 / 75) × 100% = 0.6 × 100% = 60%
Marking Notes:
- Award 1 mark for the correct calculation (45/75).
- Award 1 mark for the correct final answer (60%).
Question 7
(a) [2 marks]
| Shop Type | Frequency |
|---|---|
| Food & Beverage | 12 |
| Clothing | 8 |
| Electronics | 5 |
| Other | 6 |
Marking Notes:
- Award 1 mark for correctly counting the tallies for Food & Beverage (12) and Clothing (8).
- Award 1 mark for correctly counting the tallies for Electronics (5) and Other (6).
(b) Food & Beverage [1 mark]
Question 8
(a) Range = Highest value - Lowest value = 35.2°C - 29.8°C = 5.4°C [1 mark]
(b) Any one of the following [2 marks]:
- Concrete absorbs and retains more heat from the sun than grass or tree cover, causing the temperature near the building to be higher.
- The tree provides shade, which reduces the amount of direct sunlight reaching the ground, keeping the area cooler.
- The building may reflect heat back towards the ground, increasing the local temperature.
Marking Notes:
- Award 1 mark for a basic reason (e.g., "concrete is hotter").
- Award 2 marks for a more detailed explanation that links the material or shade to the temperature difference.
Question 9
(a) Mean = (Sum of all measurements) / (Number of measurements) [2 marks] = (12 + 15 + 10 + 18 + 14) / 5 = 69 / 5 = 13.8 cm
Marking Notes:
- Award 1 mark for correctly summing the measurements (69).
- Award 1 mark for the correct final answer (13.8 cm).
(b) Any one of the following [2 marks]:
- Using multiple quadrats provides a more representative sample of the entire field, as grass height can vary significantly from one spot to another.
- It improves the reliability of the results by reducing the influence of any one anomalous measurement.
Marking Notes:
- Award 1 mark for a basic reason (e.g., "to get more data").
- Award 2 marks for a more detailed explanation that links to representativeness or reliability.
Question 10
(a) Any one of the following [1 mark]:
- "How do you usually travel to work?" (with options: car, bus, MRT, walking, cycling, other)
- "Do you own a car?" (Yes/No)
- "How long does your commute take?" (with time ranges)
(b) Any one of the following [1 mark]:
- "What do you like most about your commute?"
- "What changes would you like to see to improve your commute?"
- "Why do you choose your current mode of transport?"
Section C: Data Presentation and Analysis (Questions 11–15)
Question 11
(a) [3 marks]
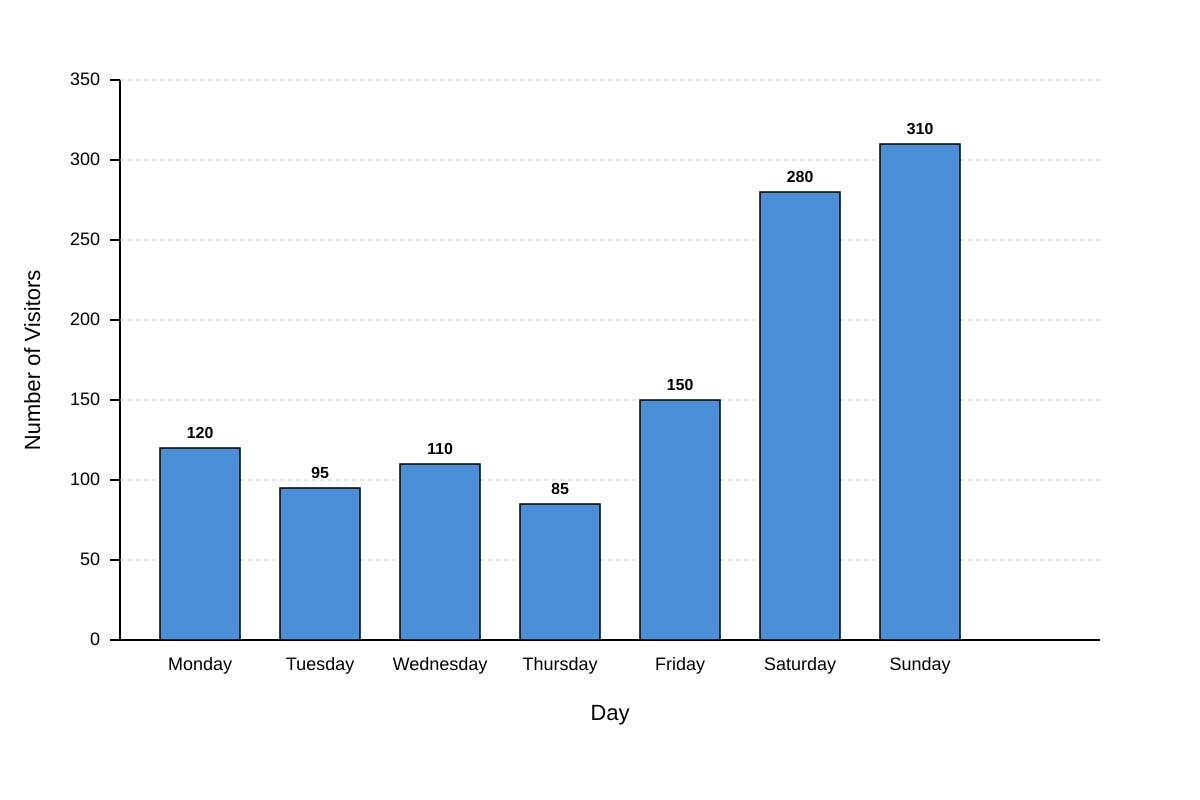
- The bar graph should have the x-axis labeled "Day" and the y-axis labeled "Number of Visitors".
- The y-axis should be scaled appropriately (e.g., from 0 to 350 in increments of 50).
- There should be 7 bars, one for each day, with heights corresponding to the data: Monday (120), Tuesday (95), Wednesday (110), Thursday (85), Friday (150), Saturday (280), Sunday (310).
Marking Notes:
- Award 1 mark for correctly labeling both axes.
- Award 1 mark for appropriate scaling of the y-axis.
- Award 1 mark for correctly plotting all 7 bars.
(b) [2 marks]
- The number of visitors is generally lower on weekdays (Monday to Friday) and much higher on weekends (Saturday and Sunday).
- The number of visitors increases steadily from Thursday to Sunday, with Sunday having the highest number of visitors.
Marking Notes:
- Award 1 mark for identifying the weekday/weekend pattern.
- Award 1 mark for providing specific data to support the pattern (e.g., "weekdays range from 85 to 150, while weekends are 280 and 310").
Question 12
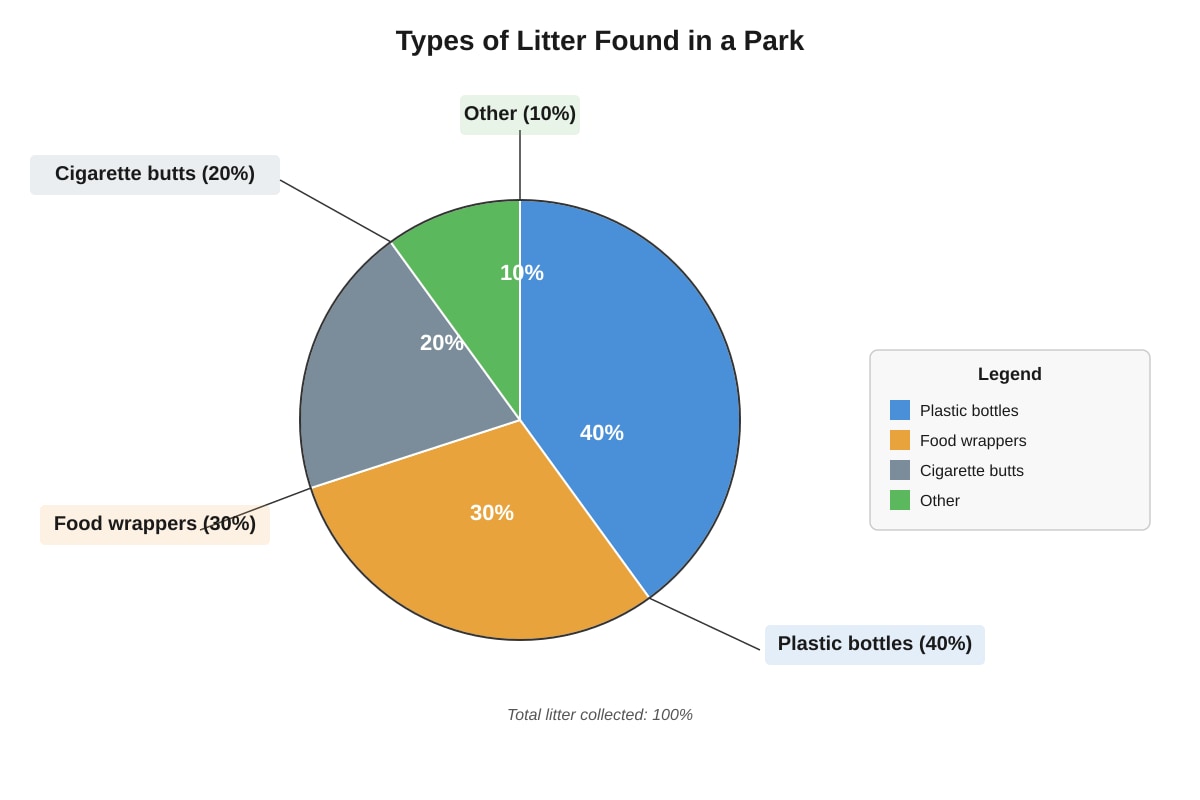
(a) Plastic bottles [1 mark]
(b) Any one of the following [1 mark]:
- People may drink bottled water or soft drinks while in the park and then discard the bottles.
- There may be a lack of recycling bins specifically for plastic bottles in the park.
- Plastic bottles are lightweight and can be easily carried into the park and then left behind.
Question 13
A scatter graph (or scatter plot) would be most suitable. [2 marks]
- A scatter graph is used to show the relationship (correlation) between two continuous variables, such as temperature and humidity.
- Each point on the graph would represent a pair of measurements (temperature and humidity) taken at the same time, allowing the student to see if there is a pattern (e.g., as temperature increases, humidity decreases).
Marking Notes:
- Award 1 mark for identifying the correct graph type.
- Award 1 mark for explaining why it is suitable for showing the relationship between two variables.
Question 14
A box plot (or box-and-whisker plot) would be most suitable. [1 mark]
- Explanation: A box plot visually displays the median, the interquartile range (which shows the spread of the middle 50% of the data), the overall range, and any outliers.
Question 15
Any one of the following [2 marks]:
- Quantitative data provides objective, numerical evidence (e.g., "80% of visitors said..."), while qualitative data provides rich, detailed insights into people's experiences and opinions (e.g., "One visitor described the park as...").
- Using both types of data makes the presentation more comprehensive and convincing, as it combines statistical evidence with human stories.
Marking Notes:
- Award 1 mark for a basic advantage (e.g., "it gives more information").
- Award 2 marks for a more detailed explanation that contrasts the two types of data.
Section D: Evaluation and Conclusion (Questions 16–20)
Question 16
(a) Any one of the following [1 mark]:
- The number of benches is insufficient for the number of visitors at peak times (20 benches for 150 visitors means only 13% of visitors can sit at any one time).
- The park may need more benches to accommodate visitors during busy periods.
(b) Any one of the following [1 mark]:
- He only counted the number of benches, not how many were being used. Some benches might be empty even when the park is busy.
- He did not consider the distribution of benches. Benches might be concentrated in one area, leaving other areas without seating.
- The data was collected over a short period and may not be representative of overall usage patterns.
Question 17
(a) Any one of the following [2 marks]:
- The sample size is very small (only 20 people), which may not be representative of all park visitors.
- The survey was only conducted on a Saturday afternoon, which may attract a specific type of visitor (e.g., people exercising) and miss others (e.g., families with young children who might visit in the morning).
Marking Notes:
- Award 1 mark for identifying a limitation (e.g., "small sample").
- Award 2 marks for explaining why this limitation makes the conclusion inaccurate.
(b) Any one of the following [1 mark]:
- Conduct the survey at different times of the day and on different days of the week.
- Interview a larger number of people.
- Use a more systematic sampling method (e.g., every 10th person who enters the park).
Question 18
(a) Any one of the following [2 marks]:
- She should ensure the privacy of individuals whose data she collects (e.g., not recording license plate numbers or identifying individuals).
- She should obtain permission from the relevant authorities (e.g., the local council or the shopping centre management) before conducting her study.
- She should be transparent about the purpose of her study if she is collecting data from people.
Marking Notes:
- Award 1 mark for identifying an ethical consideration (e.g., "privacy").
- Award 2 marks for explaining how it applies to her specific study.
(b) Any one of the following [1 mark]:
- A public holiday or special event.
- Roadworks or construction in the area.
- Changes in public transport services.
- School holidays.
Question 19
(a) Any one of the following [1 mark]:
- The school garden is home to at least 5 different species of birds.
- The garden provides a habitat for a small but diverse bird population.
(b) Any one of the following [1 mark]:
- Observe the garden at different times of the day (e.g., early morning, evening) to see if different species are active at different times.
- Observe the garden over a longer period (e.g., a month) to account for seasonal variations.
- Use a different method, such as setting up a bird feeder or recording bird calls, to identify species that might be missed by visual observation alone.
Question 20
(a) Any one of the following [2 marks]:
- If the data shows that most litter is food wrappers, she could recommend installing more bins near food stalls or picnic areas.
- If the data shows that littering is highest on weekends when visitor numbers are highest, she could recommend increasing the frequency of bin emptying on weekends.
- If the data shows that a specific type of litter (e.g., plastic bottles) is common, she could recommend a campaign to encourage visitors to bring reusable bottles.
Marking Notes:
- Award 1 mark for a recommendation based on the data.
- Award 1 mark for explaining the link between the data and the recommendation.
(b) Any one of the following [1 mark]:
- The recommendation might be costly (e.g., installing more bins, hiring more staff).
- It might require cooperation from other parties (e.g., food stall owners, the local council).
- It might be difficult to change people's behaviour (e.g., even with more bins, some people might still litter).