AI Generated Quiz
Secondary 2 Geography Fieldwork Quiz
Free Sec 2 Geography Fieldwork quiz, Claude AI version, with questions, answers, and syllabus-aligned practice for Singapore students.
These static practice materials are generated from the site's syllabus and paper-generation workflow, with source and model context shown so students and parents can evaluate the material before use.
Questions
Secondary 2 Geography Quiz - Fieldwork
Name: _________________ Class: _________________ Date: _________________
Score: _____ / 50 Duration: 45 minutes
Instructions:
- Answer all questions in the spaces provided
- Use geographical terminology where appropriate
- Show your working for calculations
- Refer to figures and data where specified
Section A: Fieldwork Planning and Design [12 marks]
1. Define the term "geographical investigation". [2 marks]
2. A student wants to investigate the quality of housing in different parts of their neighbourhood. State two geographical questions they could ask for this investigation. [2 marks]
(a) _________________________________________________________________
(b) _________________________________________________________________
3. Explain why it is important to have a clear hypothesis before conducting fieldwork. [3 marks]
4. A group of students plans to investigate traffic congestion at different times of the day near their school. Suggest one primary data collection method and one secondary data collection method they could use. [2 marks]
Primary: _________________________________________________________________
Secondary: _________________________________________________________________
5. State three safety considerations students should follow when conducting fieldwork in an urban area. [3 marks]
(a) _________________________________________________________________
(b) _________________________________________________________________
(c) _________________________________________________________________
Section B: Sampling Methods and Data Collection [13 marks]
6. Study Figure 1, which shows a residential area where students want to investigate housing types.
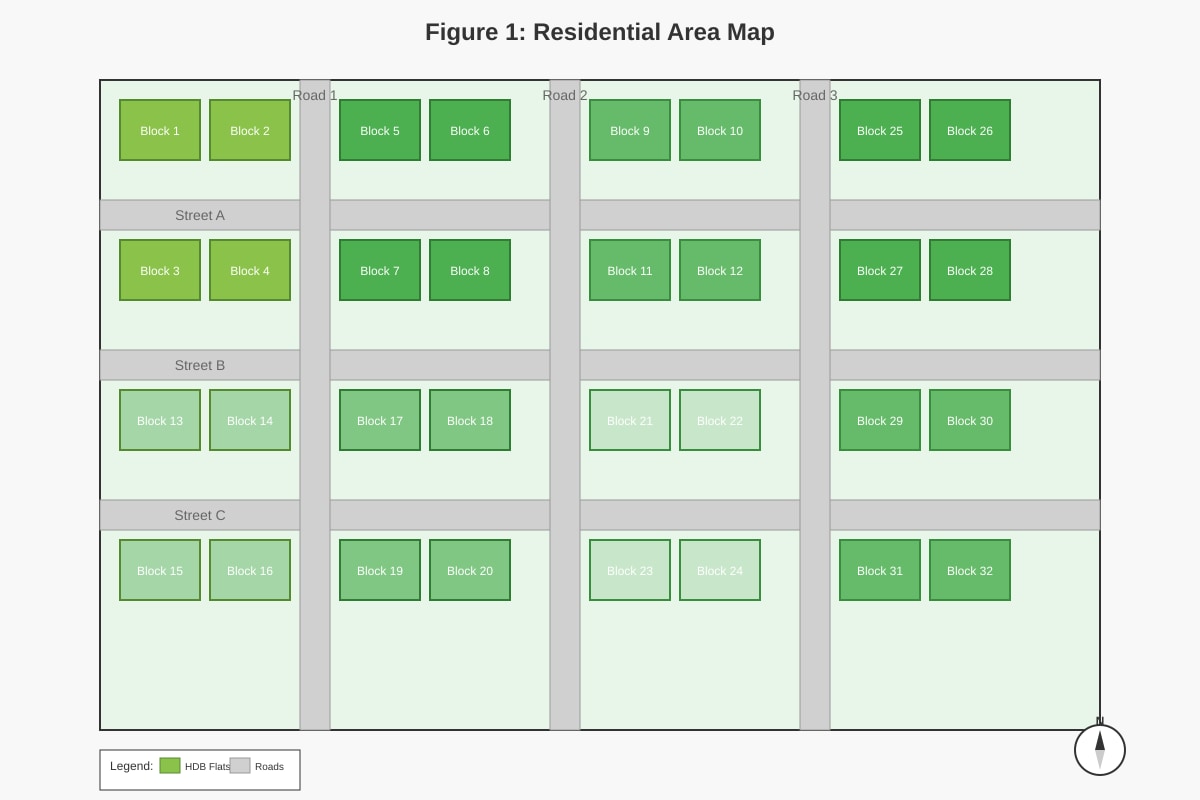
Generated figure for this question.
The students are considering two sampling methods:
- Method A: Random sampling
- Method B: Systematic sampling
Which method would be more suitable for this investigation? Justify your choice. [3 marks]
Method: _________________________________________________________________
Justification: _________________________________________________________________
7. A student is conducting a questionnaire survey about transport usage in their neighbourhood. State two advantages and two limitations of using questionnaires for data collection. [4 marks]
Advantages: (a) _________________________________________________________________
(b) _________________________________________________________________
Limitations: (a) _________________________________________________________________
(b) _________________________________________________________________
8. Explain why it is important to pilot test a questionnaire before using it for the main investigation. [2 marks]
9. A student wants to investigate water quality in a local stream. Suggest two pieces of equipment they would need and explain how each would be used. [4 marks]
Equipment 1: _________________________________________________________________
Use: _________________________________________________________________
Equipment 2: _________________________________________________________________
Use: _________________________________________________________________
10. Explain two ways students could use technology to improve the accuracy of their fieldwork data collection. [4 marks]
Way 1: _________________________________________________________________
Way 2: _________________________________________________________________
Section C: Data Analysis and Presentation [15 marks]
11. Study Figure 2, which shows the results of a housing quality survey conducted by students.
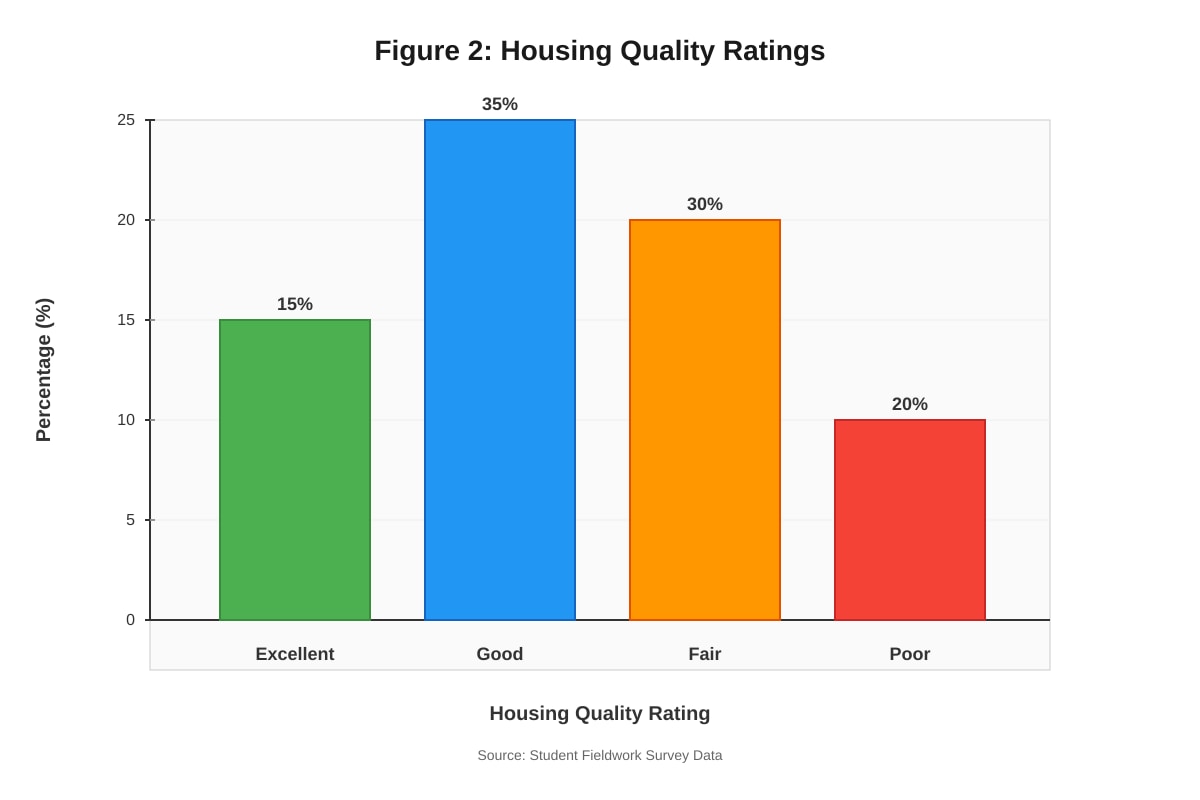
Generated figure for this question.
Calculate the number of houses rated as "Good" if the total sample size was 80 houses. Show your working. [2 marks]
Working: _________________________________________________________________
Answer: _________________ houses
12. Using the data in Figure 2, describe the pattern of housing quality in the surveyed area. [3 marks]
13. A student collected the following data about noise levels near a busy road:
| Time | Noise Level (decibels) |
|---|---|
| 8:00 AM | 75 |
| 10:00 AM | 65 |
| 12:00 PM | 70 |
| 2:00 PM | 68 |
| 4:00 PM | 78 |
| 6:00 PM | 80 |
Identify the time when noise levels were highest and suggest a reason for this pattern. [3 marks]
Highest noise level time: _________________________________________________________________
Reason: _________________________________________________________________
14. A group of students investigated the relationship between distance from the city centre and housing density. Their results showed that housing density decreases as distance from the city centre increases.
Suggest two possible explanations for this pattern. [4 marks]
Explanation 1: _________________________________________________________________
Explanation 2: _________________________________________________________________
15. The students want to present their traffic count data collected at different times of the day. Suggest an appropriate method to display this data and explain why it is suitable. [3 marks]
Method: _________________________________________________________________
Explanation: _________________________________________________________________
Section D: Evaluation and Reflection [10 marks]
16. A student's investigation into local air quality had the following limitations:
- Small sample size
- Data collected on only one day
- Limited to one location
Suggest how each limitation could be improved in a future investigation. [3 marks]
Small sample size: _________________________________________________________________
One day only: _________________________________________________________________
Limited location: _________________________________________________________________
17. Evaluate the reliability of using photographs as evidence in geographical investigations. In your answer, discuss both strengths and weaknesses. [4 marks]
Strengths: _________________________________________________________________
Weaknesses: _________________________________________________________________
18. Explain how fieldwork investigations help students develop as "concerned citizens" who can contribute to sustainable development. [3 marks]
19. State one advantage of using field sketches during geographical investigations. [1 mark]
20. The students in Question 4 decide to collect data at three different times: 7:30 AM, 12:30 PM, and 5:30 PM. Explain why these times were chosen for their investigation. [3 marks]
End of Quiz
Answers
Secondary 2 Geography Quiz - Fieldwork (Answer Key)
Total Marks: 50
Section A: Fieldwork Planning and Design [12 marks]
1. Define the term "geographical investigation". [2 marks]
Answer: A geographical investigation is a systematic inquiry into geographical phenomena using the geographical inquiry process to answer questions about places, environments, and spatial relationships. [1 mark] It involves collecting, analysing and interpreting data to understand geographical patterns and processes. [1 mark]
Marking Notes: Accept definitions that mention systematic inquiry, geographical questions, and data collection/analysis.
2. State two geographical questions for investigating housing quality. [2 marks]
Sample Answers: (a) How does housing quality vary across different parts of the neighbourhood? [1 mark] (b) What factors influence housing quality in this area? [1 mark]
Marking Notes: Accept any relevant geographical questions that focus on spatial patterns, relationships, or processes related to housing quality.
3. Explain why it is important to have a clear hypothesis before conducting fieldwork. [3 marks]
Answer: A clear hypothesis provides direction and focus for the investigation [1 mark], helping students decide what data to collect and which methods to use [1 mark]. It also provides a framework for analysing results and drawing conclusions about whether the hypothesis is supported by evidence [1 mark].
Marking Notes: Accept answers mentioning focus/direction, methodology guidance, and analysis framework.
4. Suggest data collection methods for traffic congestion investigation. [2 marks]
Sample Answers: Primary: Traffic counts/observations, noise level measurements, travel time recordings [1 mark] Secondary: Government traffic data, online traffic reports, previous studies [1 mark]
Marking Notes: Primary methods must involve direct data collection; secondary methods must use existing data sources.
5. State three safety considerations for urban fieldwork. [3 marks]
Sample Answers: (a) Work in groups/pairs, never alone [1 mark] (b) Stay aware of traffic when near roads [1 mark] (c) Inform teacher/supervisor of location and expected return time [1 mark]
Marking Notes: Accept any reasonable safety measures relevant to urban fieldwork.
Section B: Sampling Methods and Data Collection [13 marks]
6. Choose and justify sampling method for residential area investigation. [3 marks]
Answer: Method B: Systematic sampling [1 mark] Justification: Systematic sampling is more suitable because it ensures even spatial coverage across the residential area [1 mark] and is more practical to implement than random sampling, which might result in clustered or inaccessible locations [1 mark].
Marking Notes: Accept either method if well justified. Award marks for clear reasoning about spatial coverage, practicality, or bias reduction.
7. State advantages and limitations of questionnaires. [4 marks]
Sample Answers: Advantages: (a) Can collect large amounts of standardized data efficiently [1 mark] (b) Allows comparison between different groups/areas [1 mark]
Limitations: (a) Response bias - people may not answer honestly [1 mark] (b) Low response rates may make results unrepresentative [1 mark]
Marking Notes: Accept other valid advantages (cost-effective, quantifiable) and limitations (language barriers, leading questions).
8. Explain importance of pilot testing questionnaires. [2 marks]
Answer: Pilot testing identifies unclear or confusing questions that need revision [1 mark] and helps estimate how long the questionnaire takes to complete, allowing for better planning [1 mark].
Marking Notes: Accept answers about identifying problems, improving clarity, or testing logistics.
9. Suggest equipment for water quality investigation. [4 marks]
Sample Answers: Equipment 1: pH meter/pH strips [1 mark] Use: To measure acidity/alkalinity of water [1 mark]
Equipment 2: Thermometer [1 mark] Use: To measure water temperature [1 mark]
Marking Notes: Accept other relevant equipment (dissolved oxygen meter, turbidity tube, conductivity meter) with appropriate uses.
10. Explain two ways technology improves data accuracy. [4 marks]
Sample Answers: Way 1: GPS devices provide precise location coordinates [1 mark], ensuring data is accurately linked to specific places and reducing location errors [1 mark].
Way 2: Digital sensors (e.g., noise meters, air quality monitors) provide objective measurements [1 mark], eliminating human estimation errors and providing standardized, comparable data [1 mark].
Marking Notes: Accept other technologies (smartphones for photos/data recording, online mapping, weather stations) with clear accuracy benefits.
Section C: Data Analysis and Presentation [15 marks]
11. Calculate number of "Good" houses. [2 marks]
Working: 35% of 80 = 35/100 × 80 = 28 [1 mark] Answer: 28 houses [1 mark]
Marking Notes: Award 1 mark for correct working shown, 1 mark for correct answer.
12. Describe housing quality pattern. [3 marks]
Answer: The majority of houses (65%) are rated as Good or Excellent, indicating generally positive housing quality [1 mark]. However, half of all houses (50%) are rated as only Fair or Poor, showing significant quality issues [1 mark]. The largest single category is Good (35%), but Poor housing still affects one in five houses (20%) [1 mark].
Marking Notes: Award marks for accurate data interpretation, use of percentages, and overall pattern description.
13. Identify highest noise level and explain pattern. [3 marks]
Answer: Highest noise level time: 6:00 PM [1 mark] Reason: This corresponds to evening rush hour when traffic volume is highest as people return home from work [1 mark], creating more vehicle noise from engines, brakes, and horns [1 mark].
Marking Notes: Must identify correct time and provide logical explanation linking to traffic patterns.
14. Suggest explanations for housing density pattern. [4 marks]
Sample Answers: Explanation 1: Land prices are higher near city centres, making high-density development more economically necessary [1 mark] to maximize the number of units that can be built on expensive land [1 mark].
Explanation 2: Better transport accessibility near city centres makes high-density living more attractive [1 mark], while suburban areas have more space available for lower-density development [1 mark].
Marking Notes: Accept other valid explanations about economic factors, transport, planning policies, or historical development.
15. Suggest method to display traffic count data. [3 marks]
Answer: Method: Line graph [1 mark] Explanation: A line graph is suitable because it shows changes in traffic volume over time clearly [1 mark], making it easy to identify peak and off-peak periods and trends throughout the day [1 mark].
Marking Notes: Accept bar chart or other appropriate methods if well justified.
Section D: Evaluation and Reflection [10 marks]
16. Suggest improvements for air quality investigation limitations. [3 marks]
Sample Answers: Small sample size: Increase the number of measurement points across different locations [1 mark] One day only: Collect data over multiple days or weeks to account for daily variations [1 mark] Limited location: Expand study to include multiple sites with different characteristics [1 mark]
Marking Notes: Accept any reasonable improvements that address each specific limitation.
17. Evaluate reliability of photographs as evidence. [4 marks]
Sample Answers: Strengths: Provide visual evidence that can be analysed later [1 mark], capture details that might be missed during observation [1 mark].
Weaknesses: May not represent typical conditions if taken at specific moments [1 mark], can be subjective in what photographer chooses to include or exclude [1 mark].
Marking Notes: Accept other valid strengths (permanent record, shareable) and weaknesses (lighting conditions, angle bias).
18. Explain how fieldwork develops concerned citizens. [3 marks]
Answer: Fieldwork helps students understand local environmental and social issues firsthand [1 mark], developing awareness of how human activities impact places and communities [1 mark]. This knowledge enables them to make informed decisions and take action to address sustainability challenges in their own communities [1 mark].
Marking Notes: Accept answers linking fieldwork experience to environmental awareness, community understanding, and active citizenship.
19. State advantage of field sketches. [1 mark]
Sample Answer: Field sketches allow students to record specific details and spatial relationships that photographs might miss [1 mark].
Marking Notes: Accept other advantages such as selective recording, annotation possibilities, or improved observation skills.
20. Explain why specific times were chosen for traffic investigation. [3 marks]
Answer: 7:30 AM represents morning rush hour when people travel to work/school, creating peak traffic [1 mark]. 12:30 PM represents midday when traffic is typically lighter as most people are at work/school [1 mark]. 5:30 PM represents evening rush hour when people return home, creating another peak traffic period [1 mark].
Marking Notes: Must identify the different traffic patterns and explain why each time represents different conditions.
End of Answer Key
Free quiz and exam paper access
Enter your details to view this paper
Your access is remembered on this device.