Secondary 2 Geography Quiz - Map Graph Data Skills
Name: ___________________________
Class: ____________
Date: ____________
Score: ____________
Duration: 45 minutes
Total Marks: 40
Instructions:
- This quiz tests your map, graph, and data interpretation skills.
- Answer all 20 questions.
- Section A: Map Skills (Questions 1–5)
- Section B: Photograph & Visual Interpretation (Questions 6–10)
- Section C: Graph & Data Interpretation (Questions 11–20)
- Write your answers in the spaces provided.
Section A: Map Skills (10 marks)
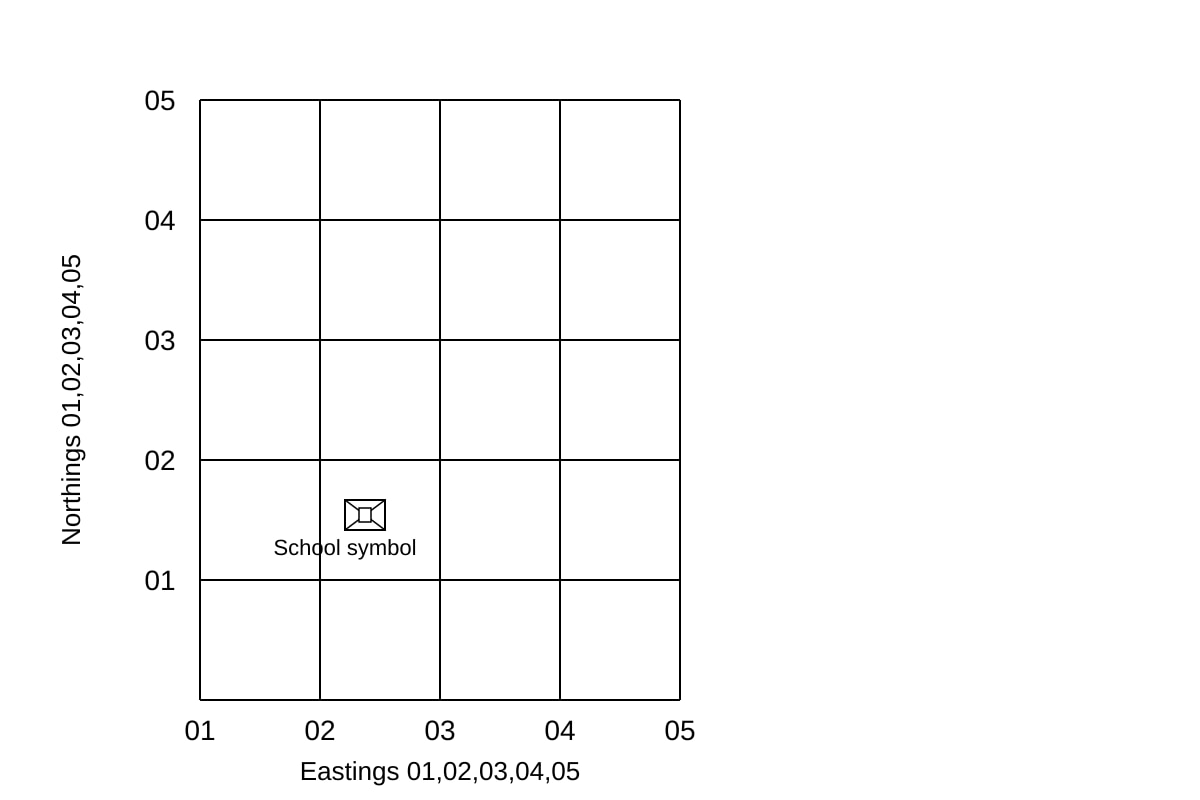
1. Study the map extract below. State the four-figure grid reference of the school. (1 mark)
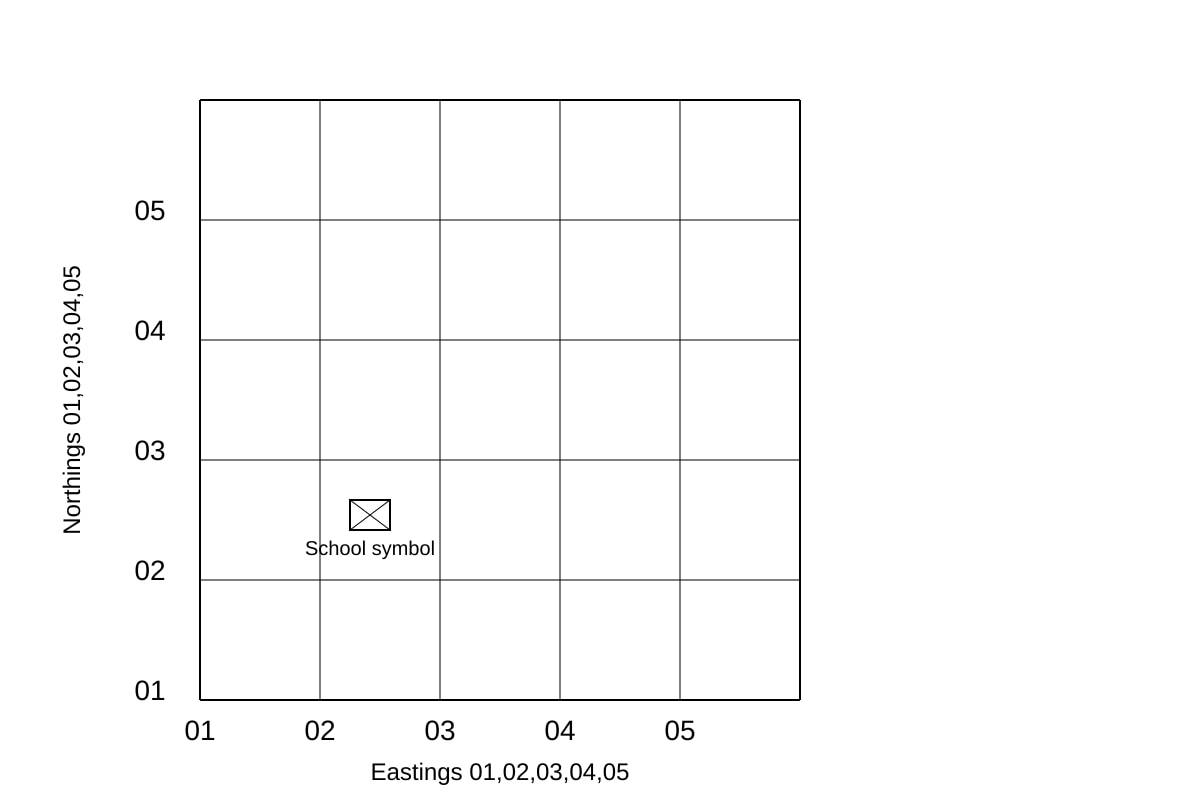
Generated map for Q1.
Answer: __________
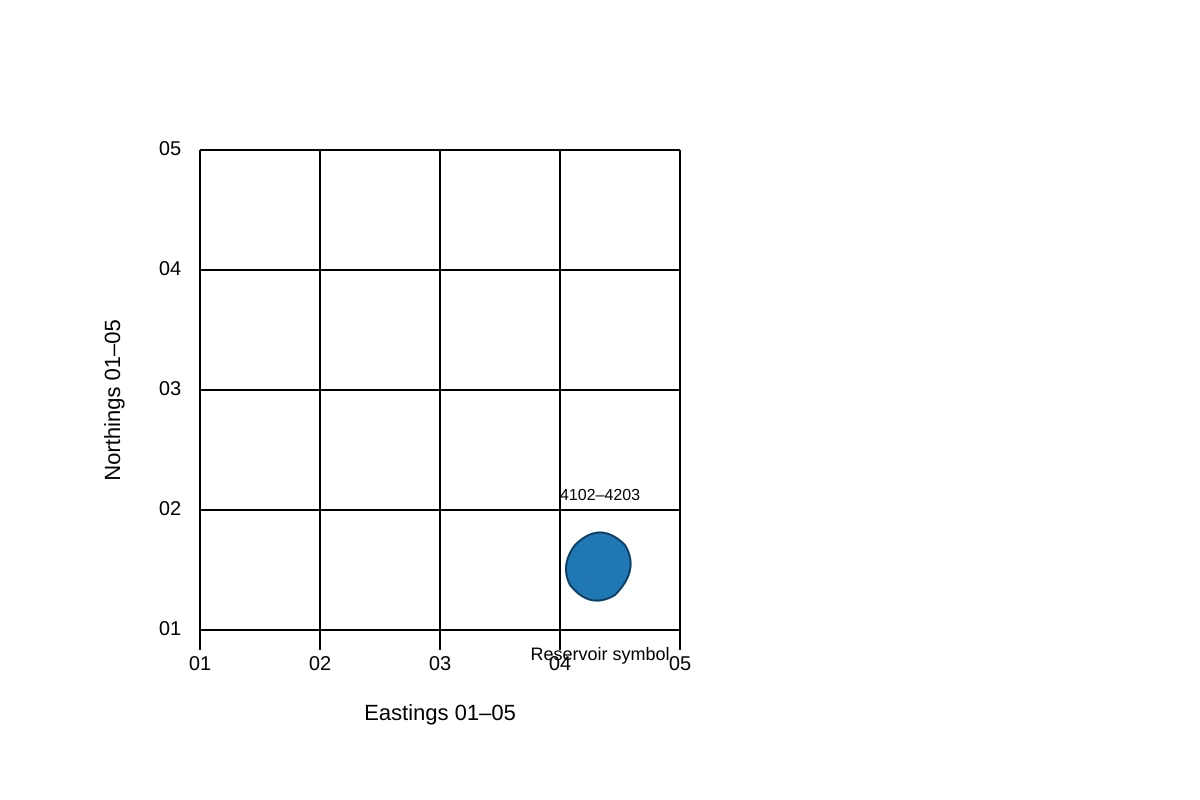
2. On the same map, give the four-figure grid reference of the reservoir. (1 mark)
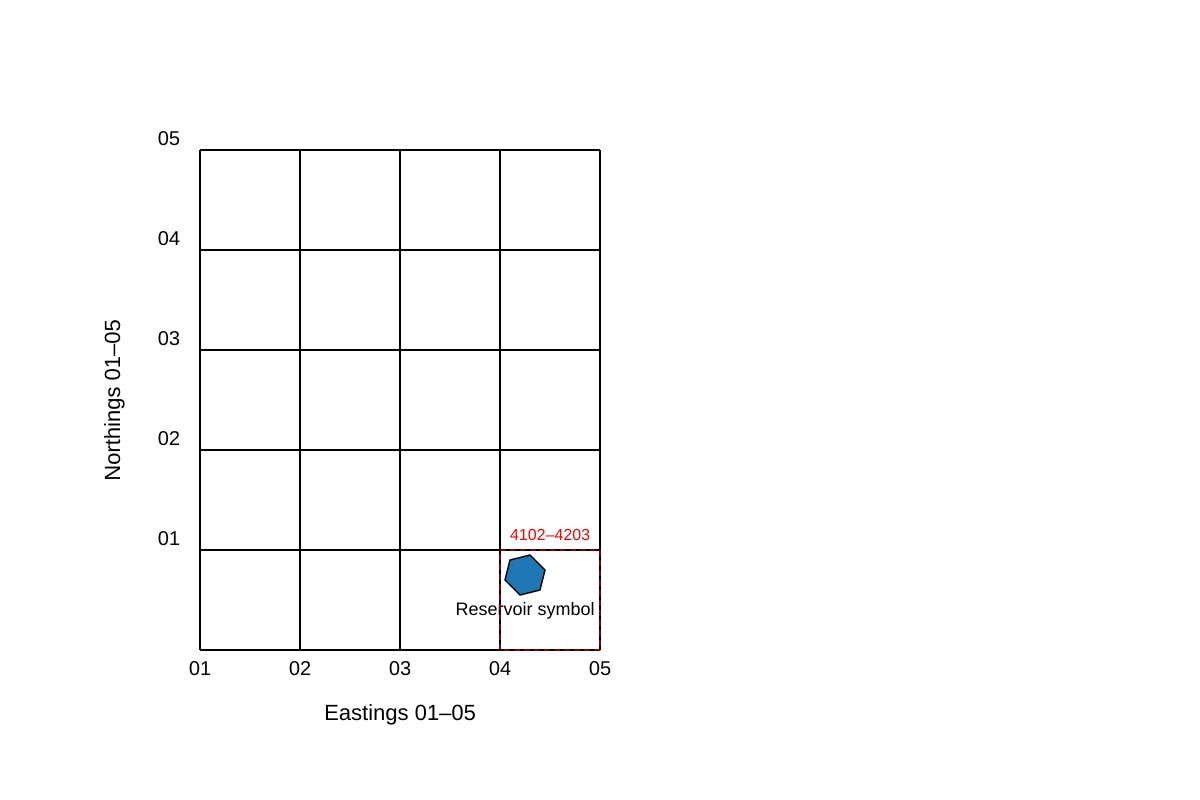
Generated map for Q2.
Answer: __________
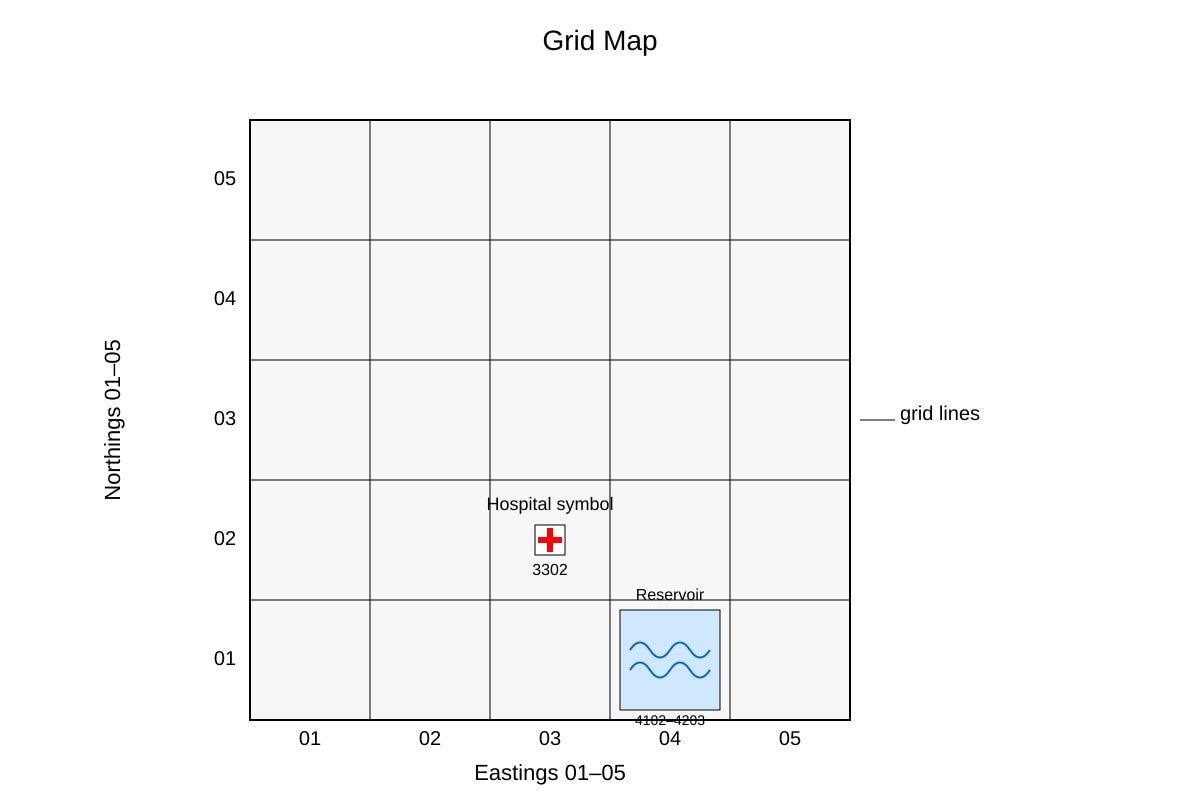
3. A student gives the grid reference of the hospital as 3204. State one mistake in this answer. (1 mark)
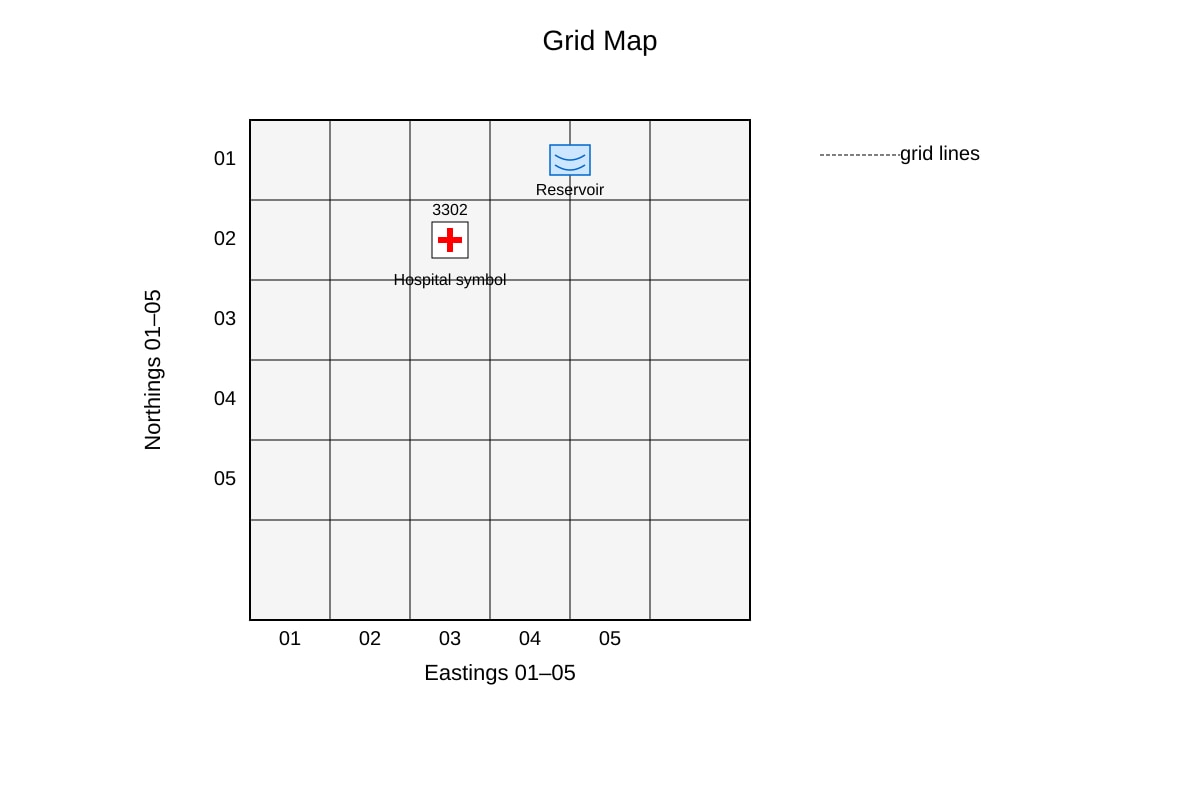
Generated map for Q3.
Answer: __________________________________________________
4. State the six-figure grid reference of the market, which is located two-tenths east and three-tenths north within grid square 2403. (2 marks)
Answer: __________
5. Name one type of information that a four-figure grid reference can give but a street address cannot easily show on a topographic map. (1 mark)
Answer: __________________________________________________
Section B: Photograph & Visual Interpretation (10 marks)
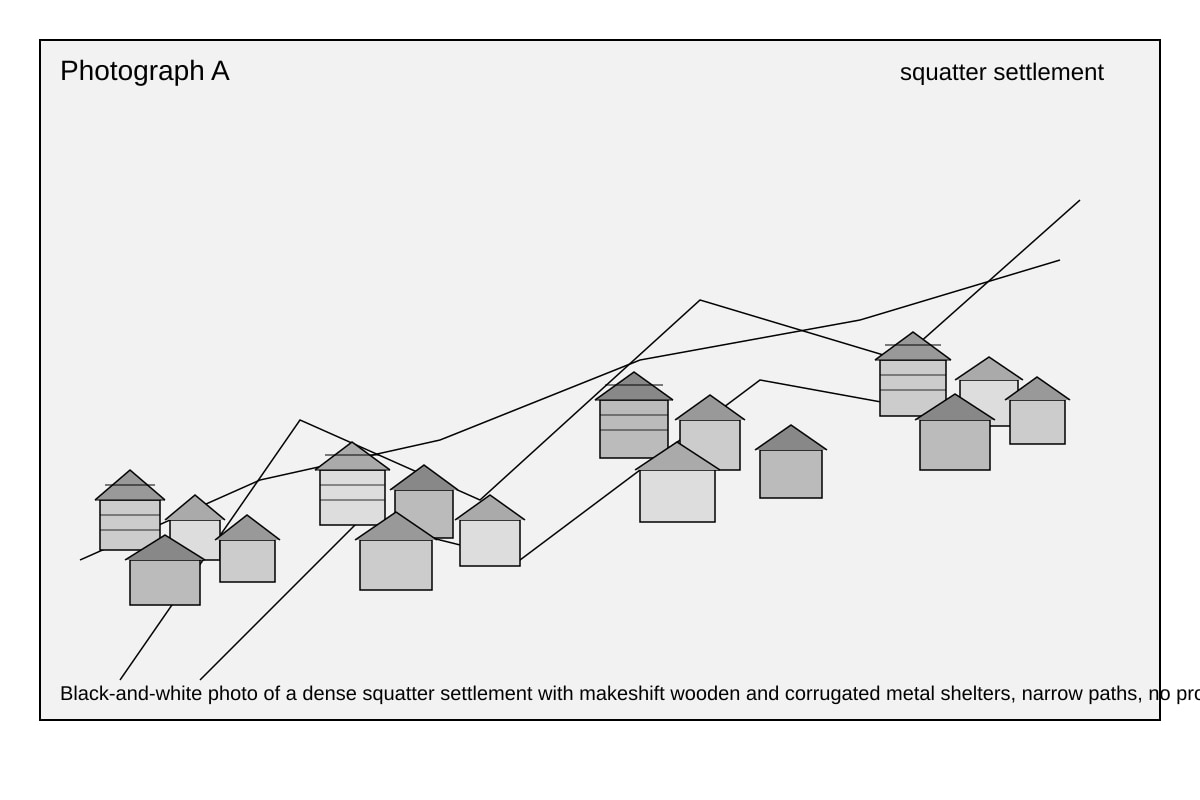
6. Study Photograph A showing a squatter settlement. Describe ONE physical characteristic of the housing. (1 mark)
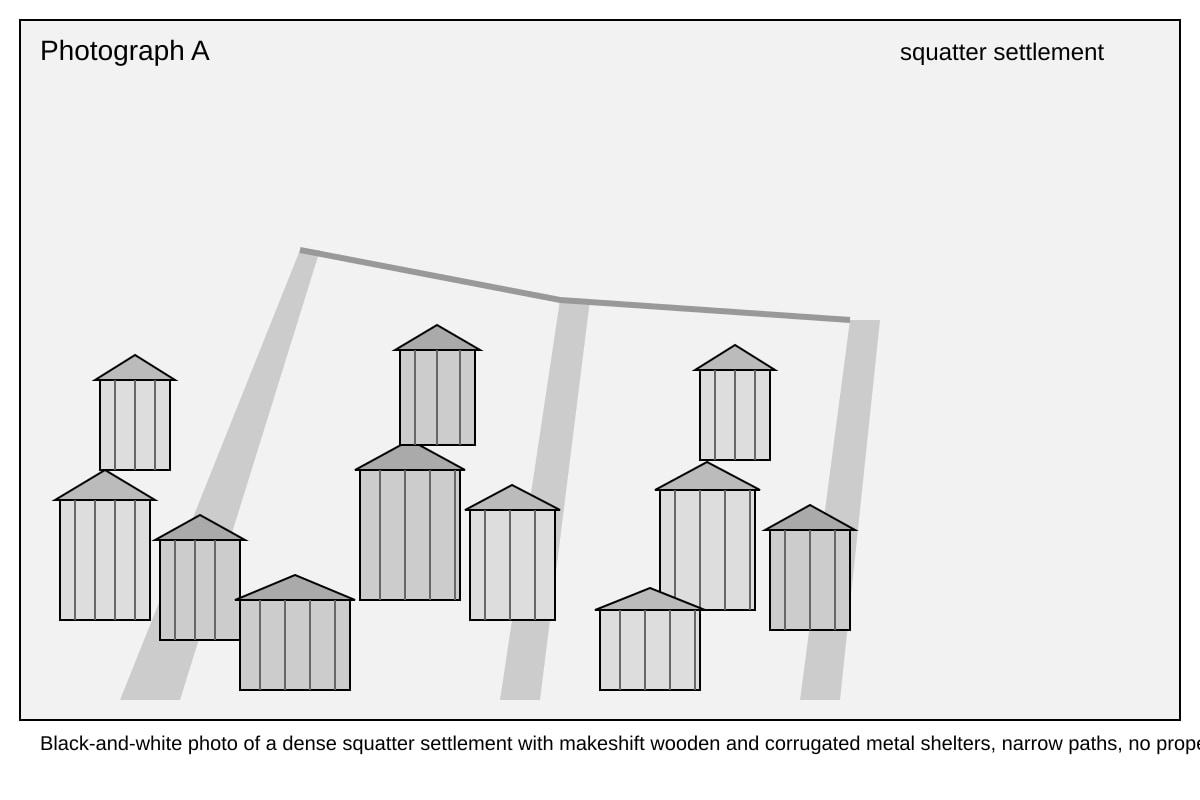
Generated source_image for Q6.
Answer: __________________________________________________
7. Study Photograph A again. Explain why such settlements often lack basic services. (2 marks)
Answer: __________________________________________________
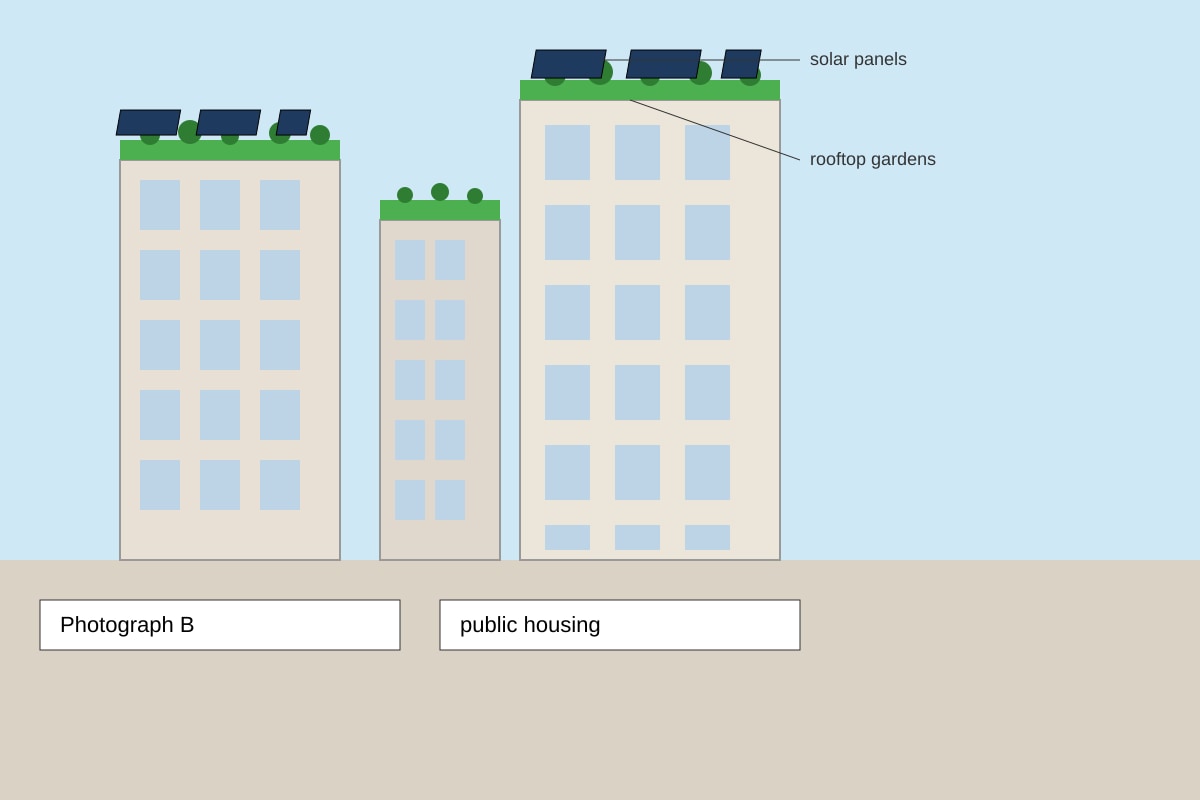
8. Study Photograph B showing a public housing estate with rooftop gardens. Describe ONE sustainable feature visible. (1 mark)
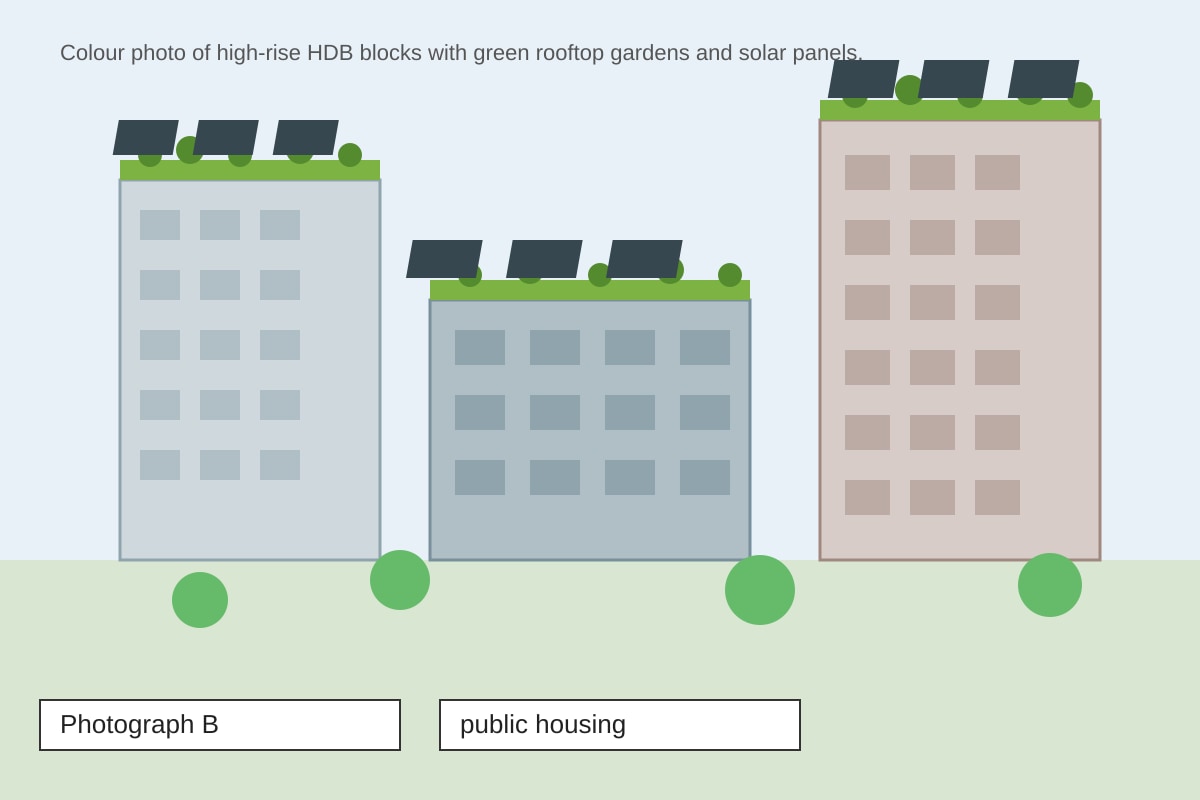
Generated source_image for Q8.
Answer: __________________________________________________
9. Explain how the feature you described in Q8 helps the environment. (3 marks)
Answer: __________________________________________________
10. Compare Photographs A and B. State one difference in the type of housing shown. (2 marks)
Answer: __________________________________________________
Section C: Graph & Data Interpretation (20 marks)
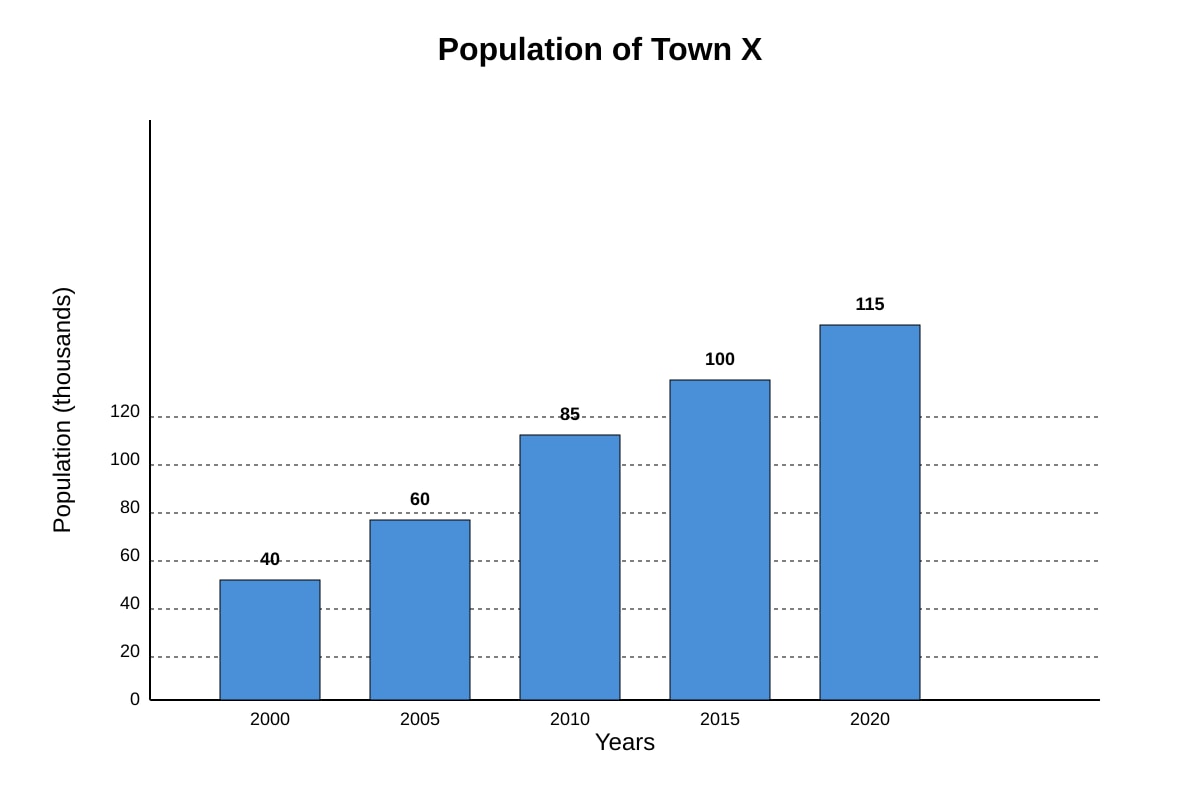
11. The bar graph below shows the population of Town X from 2000 to 2020. State the population in 2010. (1 mark)
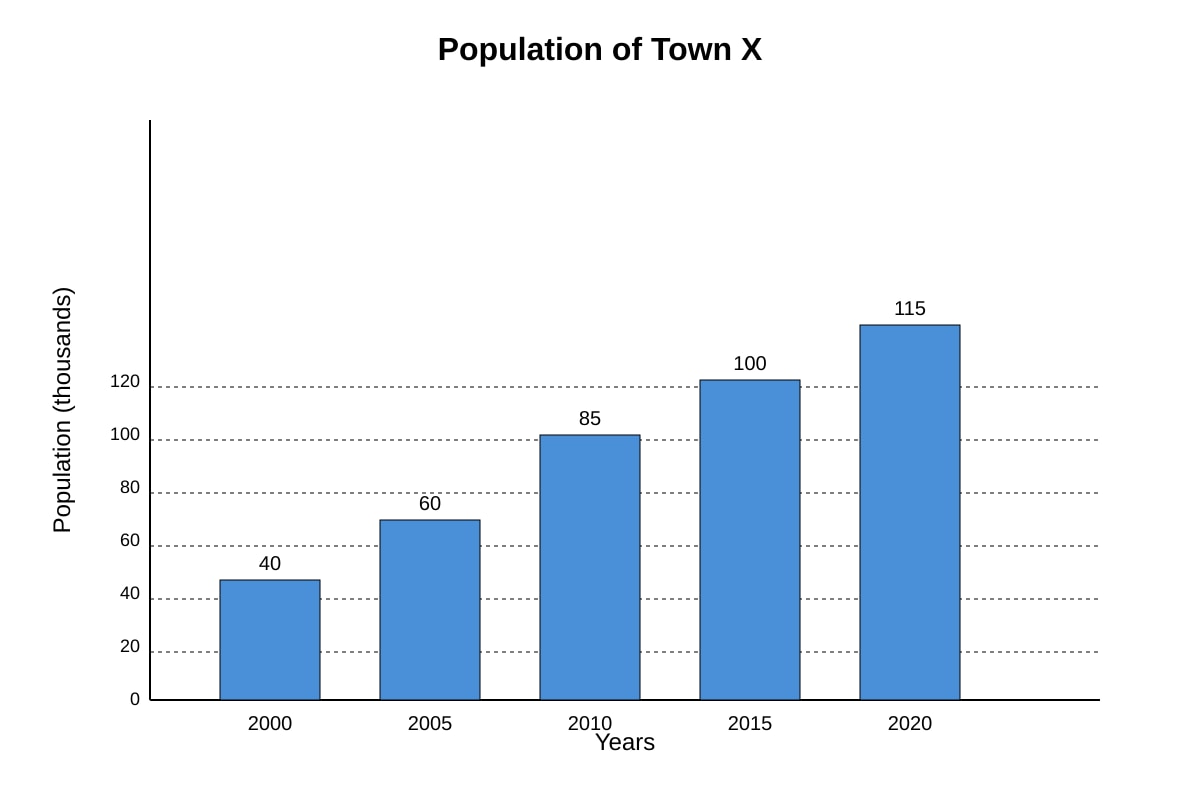
Generated graph for Q11.
Answer: __________
12. With reference to Fig. Q11, describe the trend in population from 2000 to 2020. (2 marks)
Answer: __________________________________________________
13. Calculate the percentage increase in population from 2000 to 2020. Show your working. (2 marks)
Working: __________________________________________________
Answer: __________
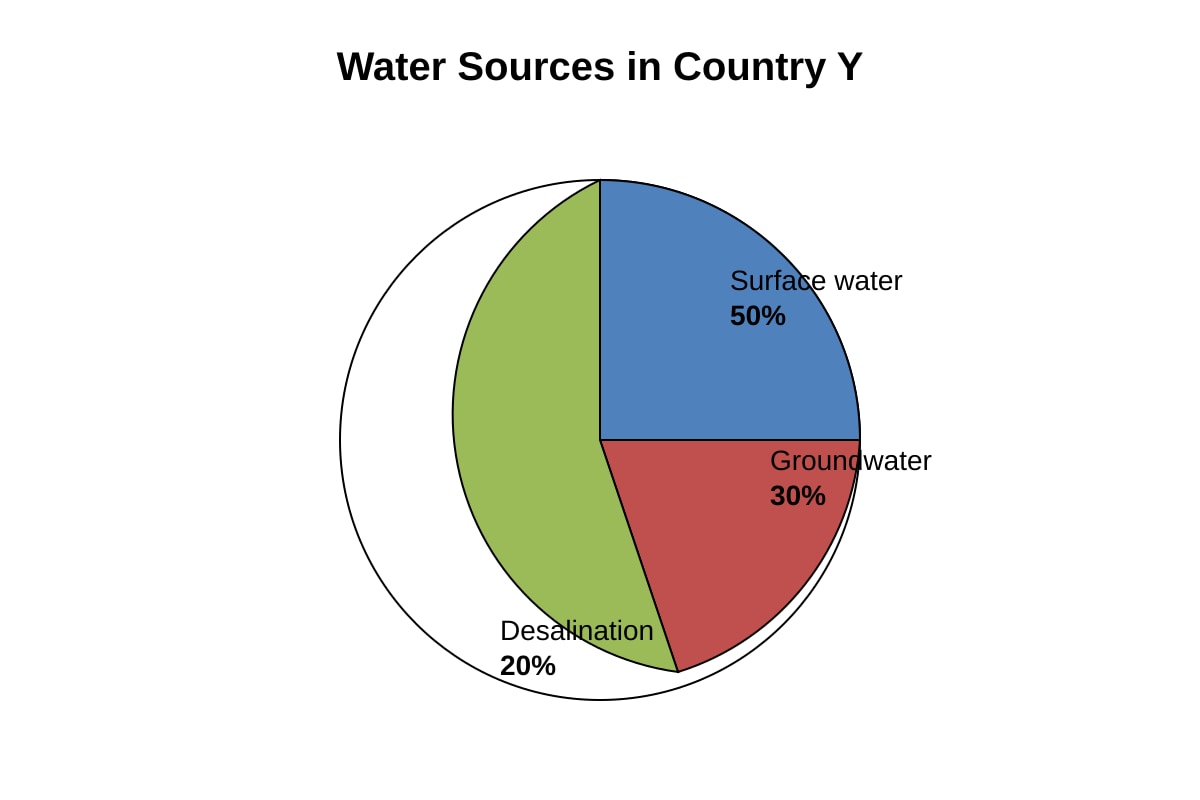
14. The pie chart shows water sources in Country Y. What fraction of water comes from groundwater if it is 30%? (1 mark)
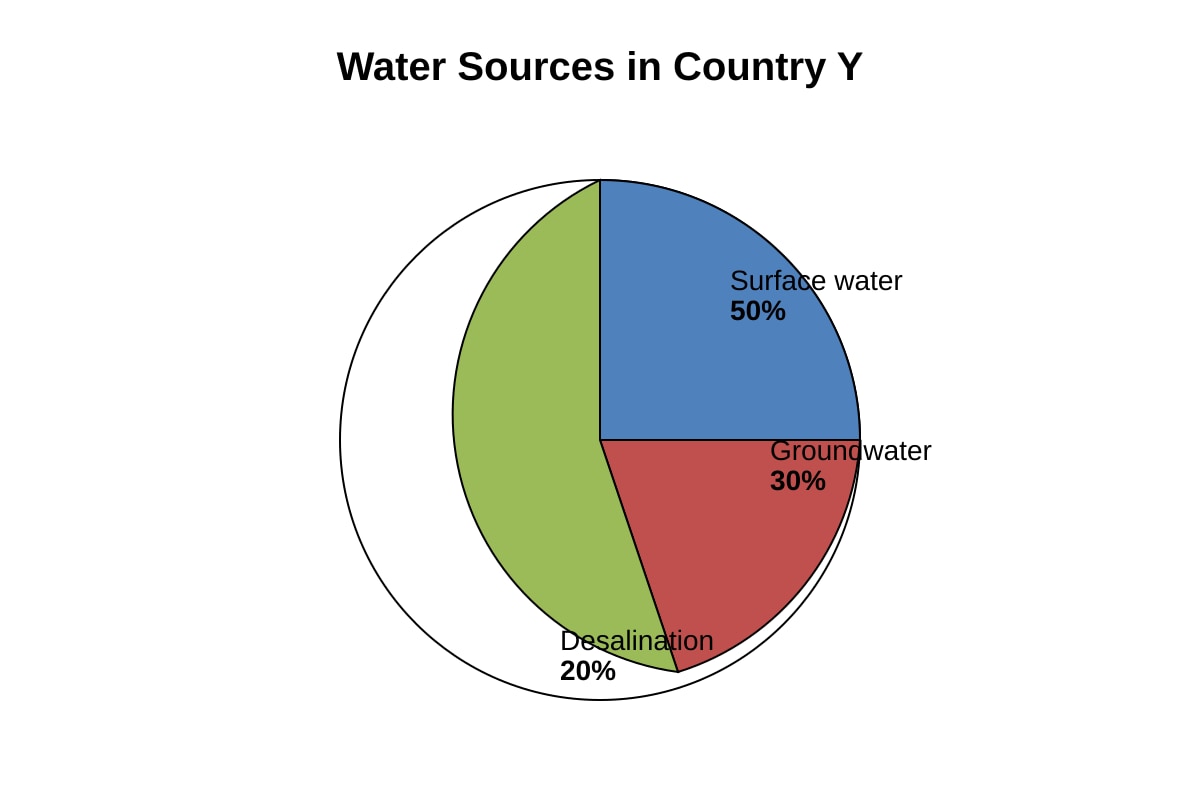
Generated chart for Q14.
Answer: __________
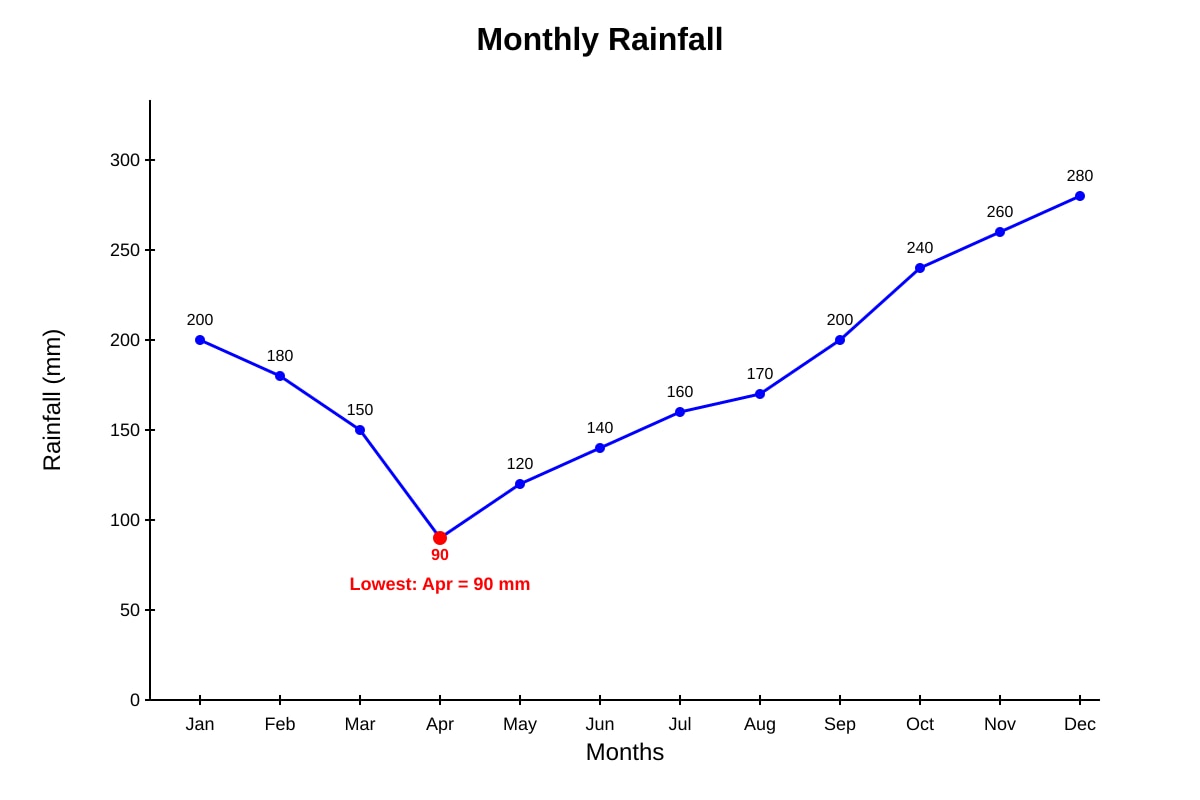
15. Study the line graph of monthly rainfall. In which month was rainfall the lowest? (1 mark)
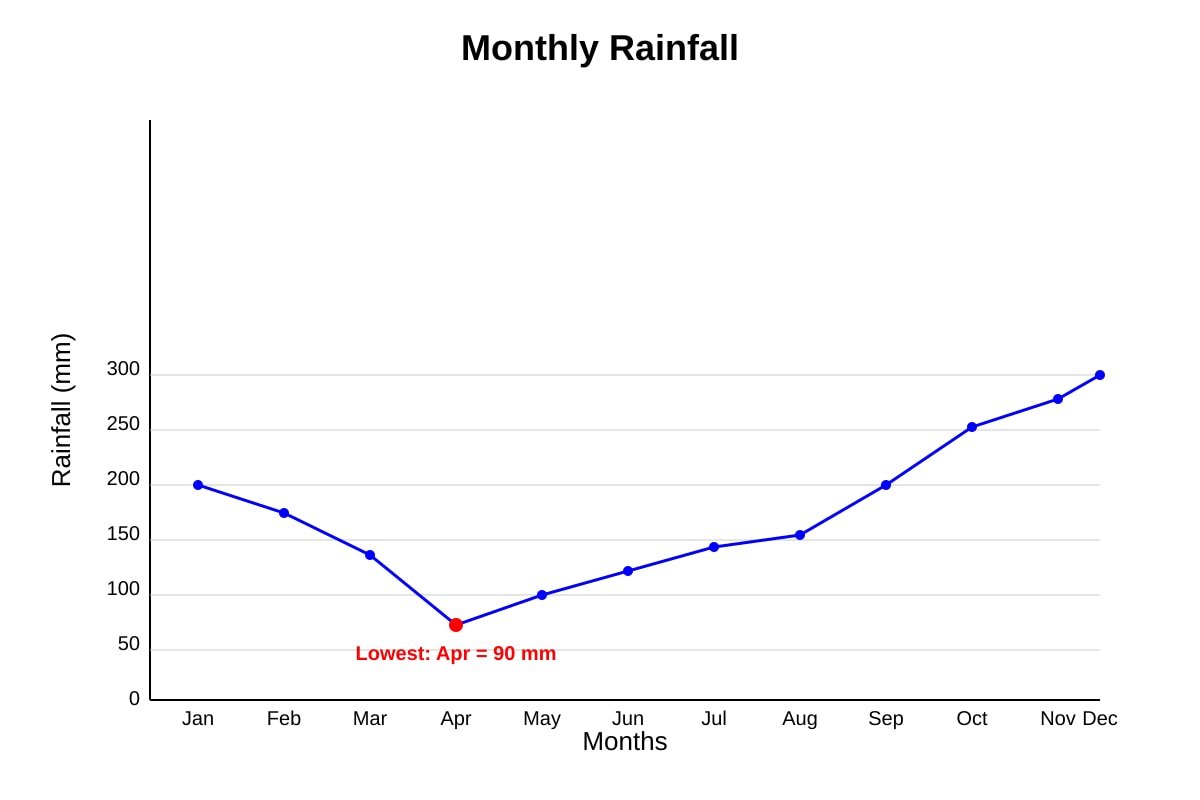
Generated graph for Q15.
Answer: __________
16. Describe the rainfall pattern from January to April using the graph in Q15. (2 marks)
Answer: __________________________________________________
17. The table shows urban and rural population (%) in 1990 and 2020. Calculate the change in urban percentage. (2 marks)
| Year | Urban % | Rural % |
|---|
| 1990 | 35 | 65 |
| 2020 | 68 | 32 |
Working: __________________________________________________
Answer: __________
18. Explain how a congestion pricing strategy can help reduce traffic in a city. (3 marks)
Answer: __________________________________________________
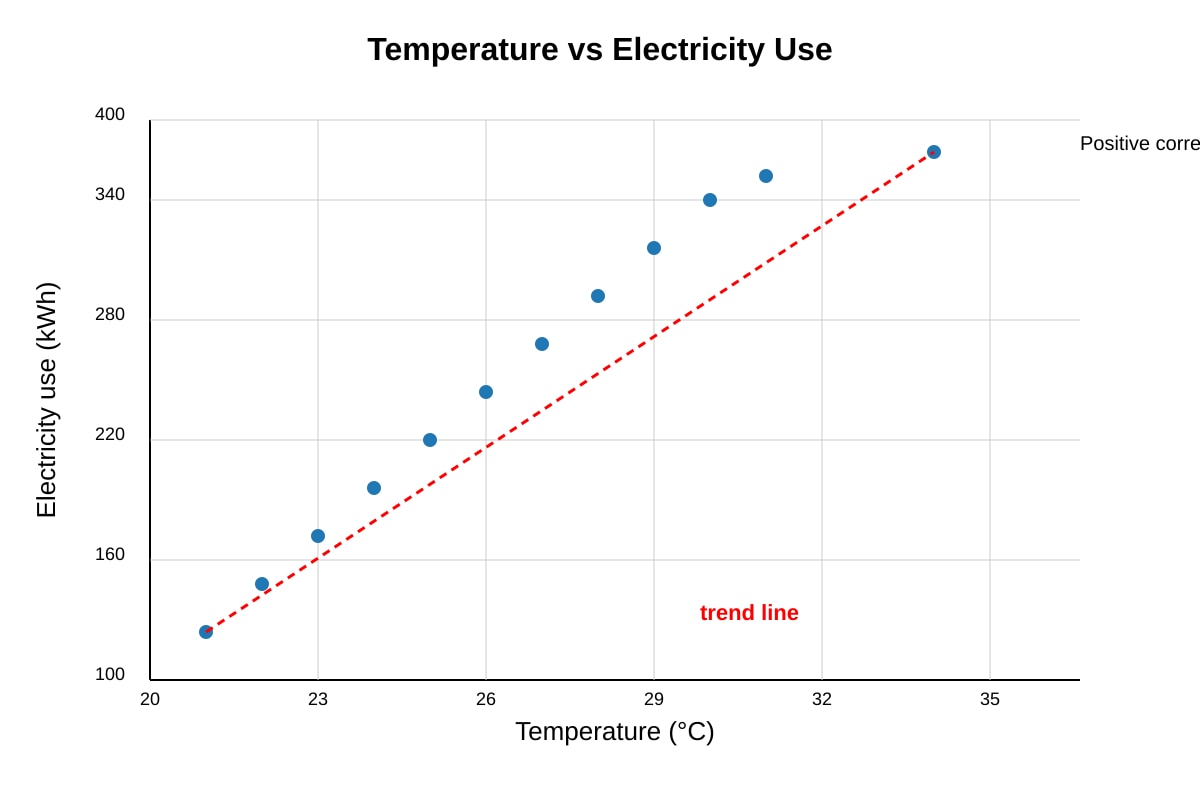
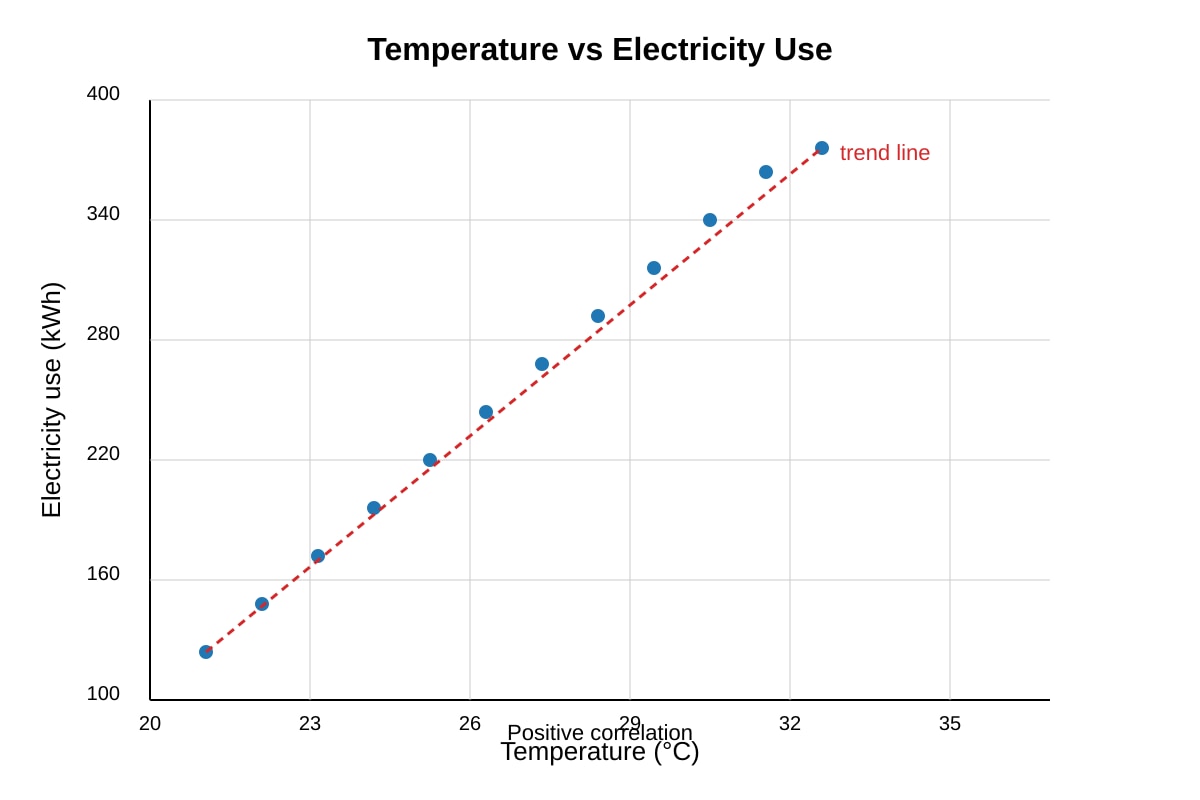
19. Study the scatter plot of temperature vs. electricity use. State the relationship shown. (2 marks)
Generated graph for Q19.
Answer: __________________________________________________
20. A fieldwork group wants to survey pedestrians. Location P is a busy shopping street; Location Q is a quiet residential lane. Which is more suitable? Justify. (2 marks)
Answer: __________________________________________________
</stage3_quiz_answers_md>
Secondary 2 Geography Quiz - Answer Key
Topic: Map Graph Data Skills
Total Marks: 40
Section A: Map Skills
1. 2303 (1 mark)
- Teaching note: Four-figure grid reference is read by taking the easting (horizontal line on the left of the feature) first, then the northing (vertical line below the feature). The school is between easting 02 and 03, and northing 03 and 04, so 2303.
- Common mistake: Writing northing first (0323) or using only two digits.
2. 4102 (1 mark)
- Teaching note: Reservoir is between easting 04–05 and northing 01–02. Easting first → 41, northing → 02, so 4102.
3. The student reversed easting and northing OR the numbers do not match the hospital's square. (1 mark)
- Teaching note: Hospital is in easting 03–04, northing 02–03, so correct is 3302. Answer 3204 swaps the order and uses wrong digits.
- Marking: 1 mark for identifying reversal or wrong square.
4. 242303 (2 marks)
- Working: Base square 2403. Two-tenths east → add 2 to easting tenths: 240 + 2 = 242. Three-tenths north → add 3 to northing tenths: 303. So 242303.
- Teaching note: Six-figure splits each grid square into 10 parts. First three digits = easting (24 + 2), last three = northing (30 + 3).
- Marking: 1 mark for easting 242, 1 mark for northing 303.
5. Relative position on a map / grid location / distance from other features (1 mark)
- Teaching note: Grid references show exact map position using coordinates, useful where street names are absent.
Section B: Photograph & Visual Interpretation
6. Makeshift structures / corrugated metal roofs / dense layout (1 mark)
- Teaching note: Squatter housing uses informal, self-built materials.
7. (2 marks)
- Because they are informal and unplanned (1), authorities may not provide pipes, sewage, or electricity (1).
- Teaching note: Squatter settlements are built without official permission, so basic services are lacking.
8. Rooftop garden / solar panels / green spaces (1 mark)
9. (3 marks)
- Rooftop gardens absorb rainwater (1), reduce heat (1), provide greenery that improves air (1).
- Teaching note: Sustainable features reduce environmental impact.
10. (2 marks)
- A: informal self-built; B: formal high-rise public housing (1+1).
- Marking: 1 for each correct contrast.
Section C: Graph & Data Interpretation
11. 85,000 (or 85 thousand) (1 mark)
12. (2 marks)
- Population increased overall from 40k to 115k (1). Rise was steady, fastest between 2005–2010 (1).
13. (2 marks)
- Working: Increase = 115 − 40 = 75. % = (75/40) × 100 = 187.5%.
- Answer: 187.5% (1 for working, 1 for answer)
14. 3/10 (1 mark)
- Teaching note: 30% = 30/100 = 3/10.
15. April (1 mark)
16. (2 marks)
- Rainfall fell from 200 mm (Jan) to 90 mm (Apr) (1). Steady decline over 4 months (1).
17. (2 marks)
- Working: 68 − 35 = 33 percentage points.
- Answer: +33% (1 working, 1 answer)
18. (3 marks)
- Drivers pay to enter congested zone (1). This discourages unnecessary trips (1). Less traffic, faster flow (1).
- Teaching note: Pricing changes behaviour via cost.
19. (2 marks)
- Positive correlation (1): as temperature rises, electricity use increases (1).
20. (2 marks)
- Location P (1) because more pedestrians = better sample (1).
- Teaching note: Busy areas give representative data.
</stage3_quiz_answers_md>
<stage3_quiz_md>
Secondary 2 Geography Quiz - Map Graph Data Skills
Name: ___________________________
Class: ____________
Date: ____________
Score: ____________
Duration: 45 minutes
Total Marks: 40
Instructions:
- This quiz tests your map, graph, and data interpretation skills.
- Answer all 20 questions.
- Section A: Map Skills (Questions 1–5)
- Section B: Photograph & Visual Interpretation (Questions 6–10)
- Section C: Graph & Data Interpretation (Questions 11–20)
- Write your answers in the spaces provided.
Section A: Map Skills (10 marks)
1. Study the map extract below. State the four-figure grid reference of the school. (1 mark)
Generated map for Q1.
Answer: __________
2. On the same map, give the four-figure grid reference of the reservoir. (1 mark)
Generated map for Q2.
Answer: __________
3. A student gives the grid reference of the hospital as 3204. State one mistake in this answer. (1 mark)
Generated map for Q3.
Answer: __________________________________________________
4. State the six-figure grid reference of the market, which is located two-tenths east and three-tenths north within grid square 2403. (2 marks)
Answer: __________
5. Name one type of information that a four-figure grid reference can give but a street address cannot easily show on a topographic map. (1 mark)
Answer: __________________________________________________
Section B: Photograph & Visual Interpretation (10 marks)
6. Study Photograph A showing a squatter settlement. Describe ONE physical characteristic of the housing. (1 mark)
Generated source_image for Q6.
Answer: __________________________________________________
7. Study Photograph A again. Explain why such settlements often lack basic services. (2 marks)
Answer: __________________________________________________
8. Study Photograph B showing a public housing estate with rooftop gardens. Describe ONE sustainable feature visible. (1 mark)
Generated source_image for Q8.
Answer: __________________________________________________
9. Explain how the feature you described in Q8 helps the environment. (3 marks)
Answer: __________________________________________________
10. Compare Photographs A and B. State one difference in the type of housing shown. (2 marks)
Answer: __________________________________________________
Section C: Graph & Data Interpretation (20 marks)
11. The bar graph below shows the population of Town X from 2000 to 2020. State the population in 2010. (1 mark)
Generated graph for Q11.
Answer: __________
12. With reference to Fig. Q11, describe the trend in population from 2000 to 2020. (2 marks)
Answer: __________________________________________________
13. Calculate the percentage increase in population from 2000 to 2020. Show your working. (2 marks)
Working: __________________________________________________
Answer: __________
14. The pie chart shows water sources in Country Y. What fraction of water comes from groundwater if it is 30%? (1 mark)
Generated chart for Q14.
Answer: __________
15. Study the line graph of monthly rainfall. In which month was rainfall the lowest? (1 mark)
Generated graph for Q15.
Answer: __________
16. Describe the rainfall pattern from January to April using the graph in Q15. (2 marks)
Answer: __________________________________________________
17. The table shows urban and rural population (%) in 1990 and 2020. Calculate the change in urban percentage. (2 marks)
| Year | Urban % | Rural % |
|---|
| 1990 | 35 | 65 |
| 2020 | 68 | 32 |
Working: __________________________________________________
Answer: __________
18. Explain how a congestion pricing strategy can help reduce traffic in a city. (3 marks)
Answer: __________________________________________________
19. Study the scatter plot of temperature vs. electricity use. State the relationship shown. (2 marks)
Generated graph for Q19.
Answer: __________________________________________________
20. A fieldwork group wants to survey pedestrians. Location P is a busy shopping street; Location Q is a quiet residential lane. Which is more suitable? Justify. (2 marks)
Answer: __________________________________________________