From Real Exams Quiz
Secondary 2 Geography Human Geography Quiz
Free Sec 2 Geography Human Geography quiz, HY3 Exam version, with questions, answers, and syllabus-aligned practice for Singapore students.
These static practice materials are generated from the site's syllabus and paper-generation workflow, with source and model context shown so students and parents can evaluate the material before use.
Questions
Free quiz and exam paper access
Enter your details to view this paper
Your access is remembered on this device.
Answers
Secondary 2 Geography Quiz - Human Geography (Answer Key)
Total Marks: 40
Duration: 45 minutes
Section A: Answers (Q1–7)
Q1. [1 mark]
Answer: 130,000
Working: 250,000 (2020) – 120,000 (2000) = 130,000.
Teaching note: Population increase is found by subtracting the earlier value from the later value. Common mistake: subtracting the wrong way (120,000 – 250,000).
Q2. [1 mark]
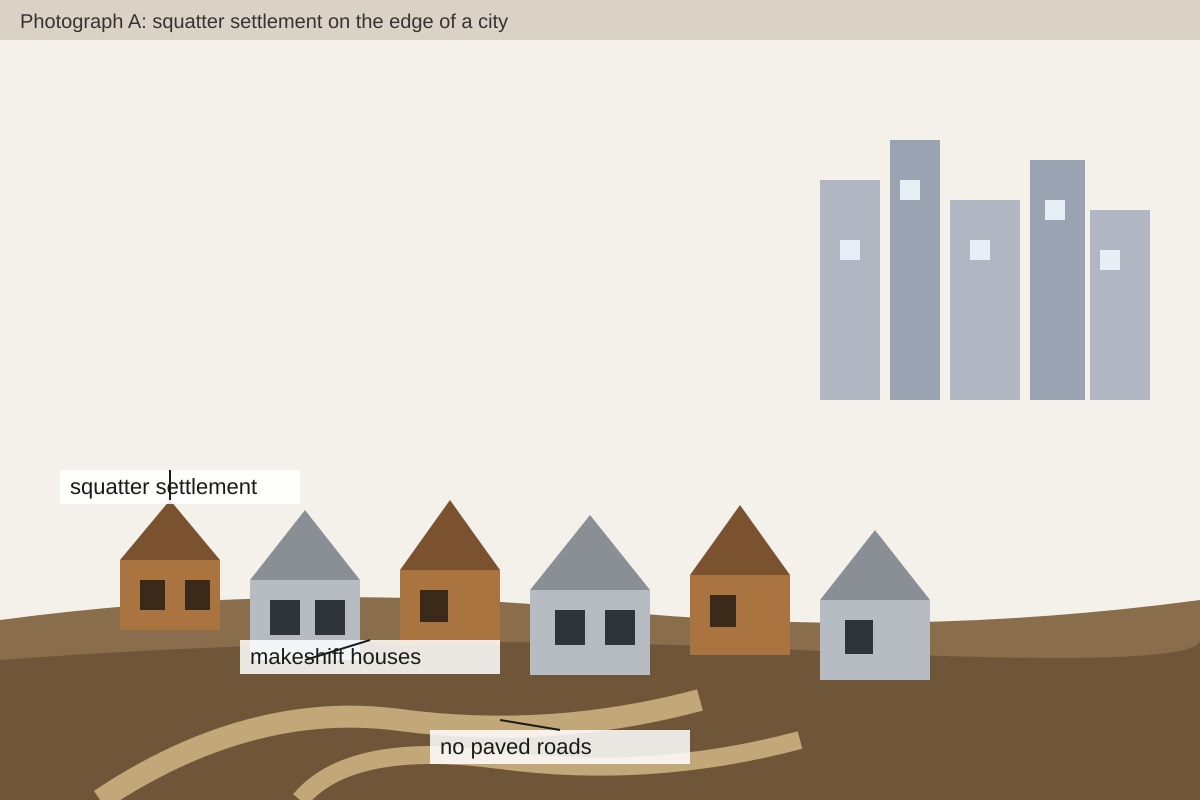
Answer: Any one correct: makeshift houses / built from wood and metal / no proper roads / dense cluster.
Teaching note: A squatter settlement has self-built housing using cheap materials. Accept observation from Photograph A.
Q3. [2 marks]
Answer: Because the settlement is informal and not planned, the government does not provide services (1); houses are built on land not meant for housing so no water pipes or sewage (1).
Marking: 1 mark for lack of planning, 1 mark for no infrastructure link.
Q4. [2 marks]
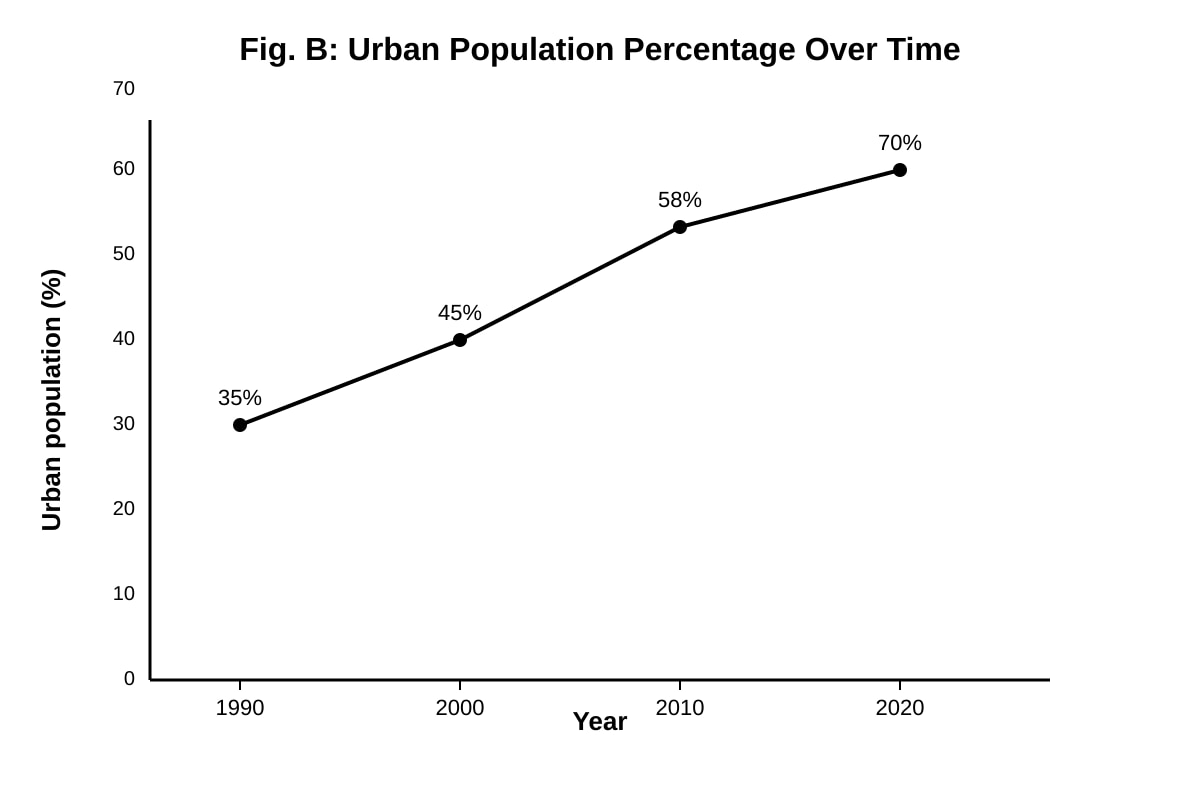
Answer: The urban population percentage increased steadily from 35% in 1990 to 70% in 2020 (1). It rose by 35 percentage points over 30 years (1).
Teaching note: Describe trend with data. Do not just give end points.
Q5. [1 mark]
Answer: 35 percentage points (70% – 35%).
Teaching note: Percentage point increase = final % – start %.
Q6. [1 mark]
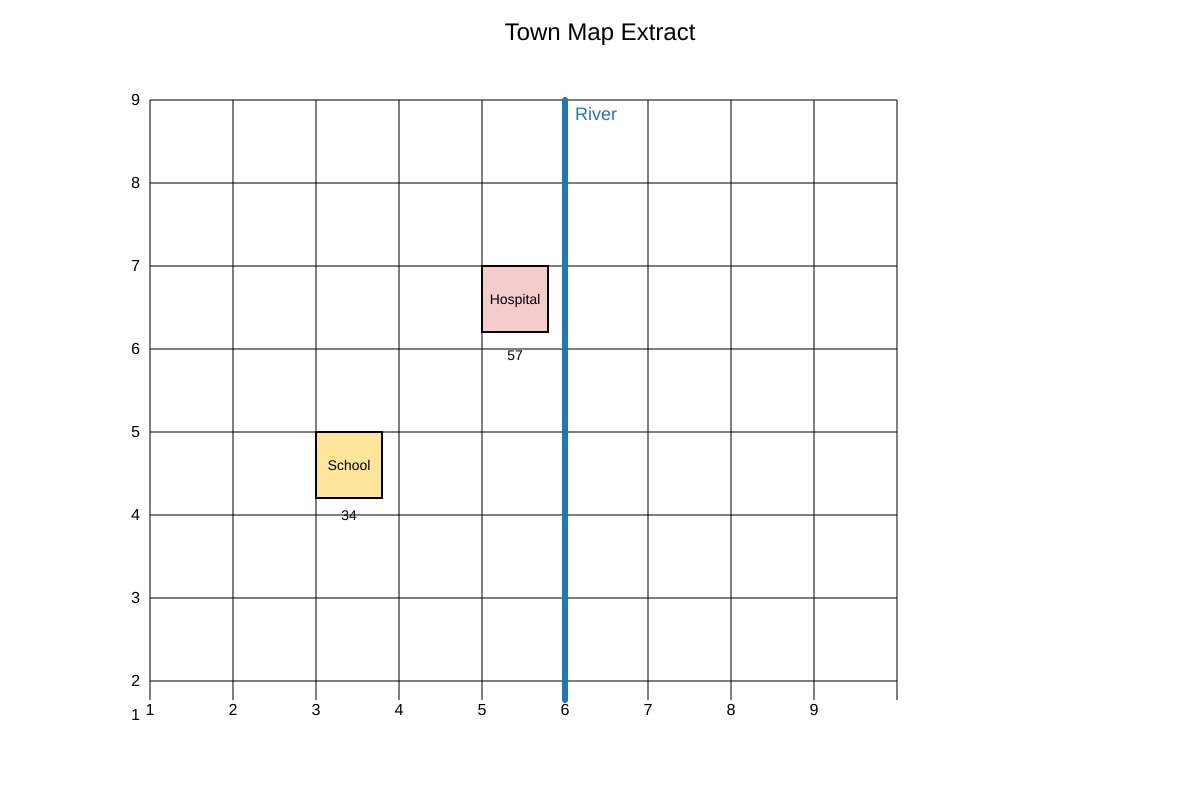
Answer: 57
Teaching note: Grid reference: easting first (5) then northing (7). Common trap: writing 75.
Q7. [1 mark]
Answer: Any one: more jobs / better services / education.
Teaching note: Push-pull factors: villages push out, cities pull in.
Section B: Answers (Q8–14)
Q8. [3 marks]
Answer: High-rise housing uses less land per person (1); more people can live in a small area, reducing sprawl (1); public housing is planned with water and power, improving living conditions (1).
Teaching note: Link building up (not out) to sustainability.
Q9. [2 marks]
Answer: Formal: planned, legal, with services. Informal: self-built, illegal, no services. (1 each)
Marking: 1 mark per clear difference.
Q10. [3 marks]
Answer: Drivers pay a fee to enter centre (1); this makes them use cars less (1); fewer cars means less congestion (1).
Teaching note: Mechanism: price → behaviour change → outcome.
Q11. [2 marks]
Answer: Recycled waste increased from 40,000 to 70,000 tonnes (1); a rise of 30,000 tonnes (1).
Teaching note: Use table numbers.
Q12. [3 marks]
Answer: No proper sanitation causes disease (1); illegal sites damage environment (1); lack of services means poor quality of life (1).
Teaching note: Unsustainable = cannot continue without harm.
Q13. [2 marks]
Answer: Clean water improves health (1); roads allow access for emergency and services (1).
Marking: 1 mark per benefit.
Q14. [2 marks]
Answer: Urban farming grows food locally, reducing transport (1); uses empty land, cooling the city (1).
Teaching note: Sustainability = local resource use.
Section C: Answers (Q15–20)
Q15. [2 marks]
Answer: Not enough housing (1); informal settlements without toilets/clean water (1).
Marking: 1 mark per problem from extract.
Q16. [2 marks]
Answer: People moved for jobs/city growth (1); villages had fewer opportunities (1).
Teaching note: Pull factor = city, push = village.
Q17. [2 marks]
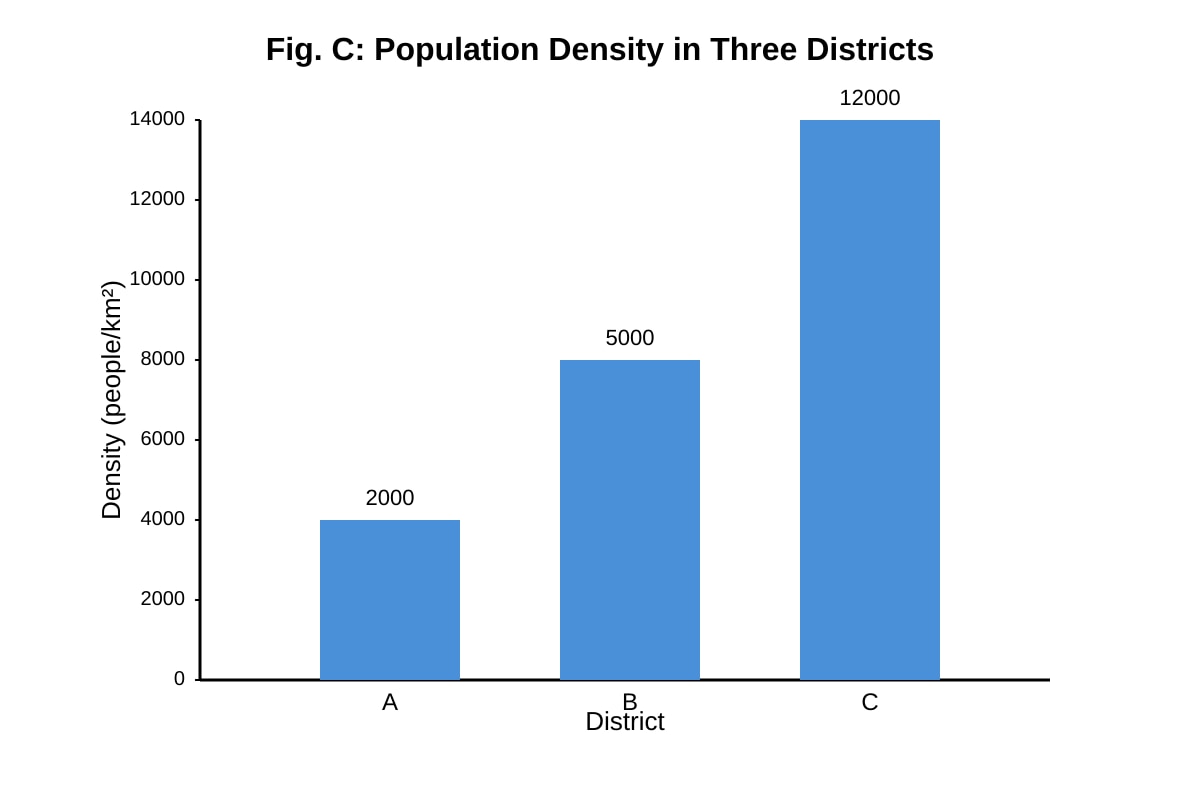
Answer: Density rises from District A (2000) to C (12000) (1); District C is most crowded (1).
Teaching note: Describe pattern with values.
Q18. [3 marks]
Answer: Plan parks for recreation (1); build public transport to reduce crowding (1); zone areas for homes and services close together (1).
Teaching note: Quality of life = health, access, space.
Q19. [4 marks]
Answer: Solar panels – use sun, less fossil fuel (2); rainwater collection – saves water (2).
Marking: 2 marks each: feature + explanation.
Q20. [5 marks]
Answer: Agree: housing shortage, pollution, slums (2 examples, 2 marks). Disagree: more jobs, services (2 examples, 2 marks). Conclusion with own view (1 mark).
Marking descriptors: 2 marks for two problems, 2 marks for two opportunities, 1 mark for balanced conclusion.
Teaching note: Use examples from syllabus (squatter settlements, public housing).