AI Generated Exam Paper
Secondary 2 Geography Practice Paper 5
Free Sec 2 Geography Practice Paper 5, HY3 AI version, with questions, answers, and syllabus-aligned practice for Singapore students.
These static practice materials are generated from the site's syllabus and paper-generation workflow, with source and model context shown so students and parents can evaluate the material before use.
Questions
Free quiz and exam paper access
Enter your details to view this paper
Your access is remembered on this device.
Answers
TuitionGoWhere Practice Paper — Geography Secondary 2 (Version 5) Answer Key
Total Marks: 40
Topic: Map Graph Data Skills
Section A: Map Skills (14 marks)
Q1 [1 mark]
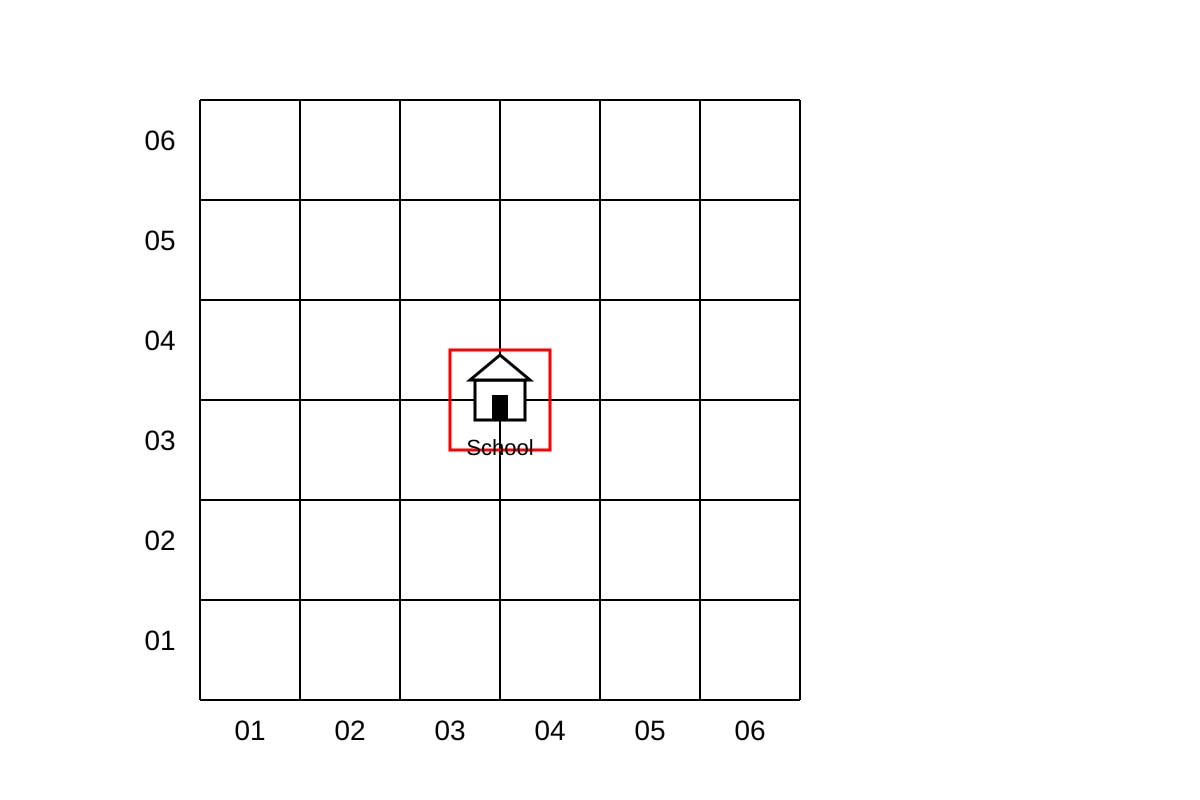
Answer: 0304
Teaching note: Four-figure grid reference uses easting (horizontal) first, then northing (vertical). School is between easting 03 and 04, northing 04 and 05 → 0304.
Common mistake: Writing northing first (0403).
Q2 [2 marks]
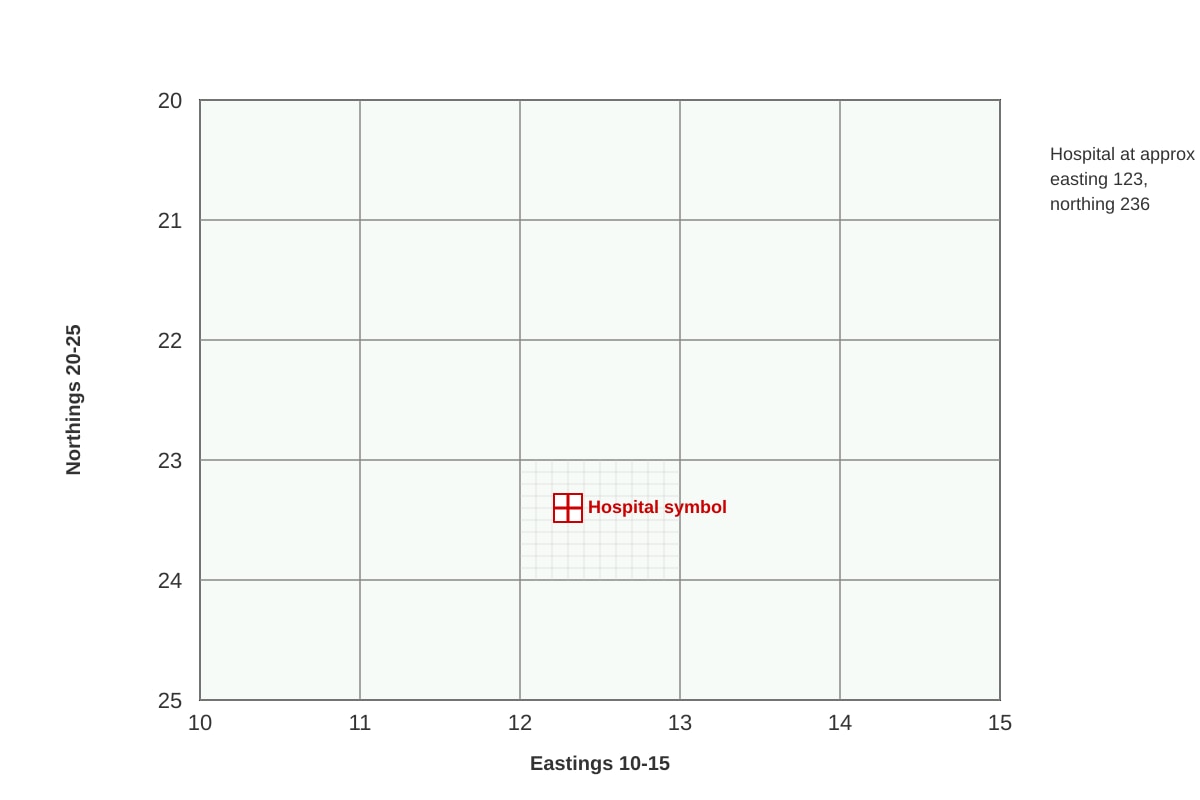
Answer: 123236
Mark breakdown: 1 mark for easting 123, 1 mark for northing 236.
Teaching note: Six-figure splits the square into tenths. Hospital is 3 tenths across 12–13 → 123; 6 tenths up 23–24 → 236.
Q3 [1 mark]
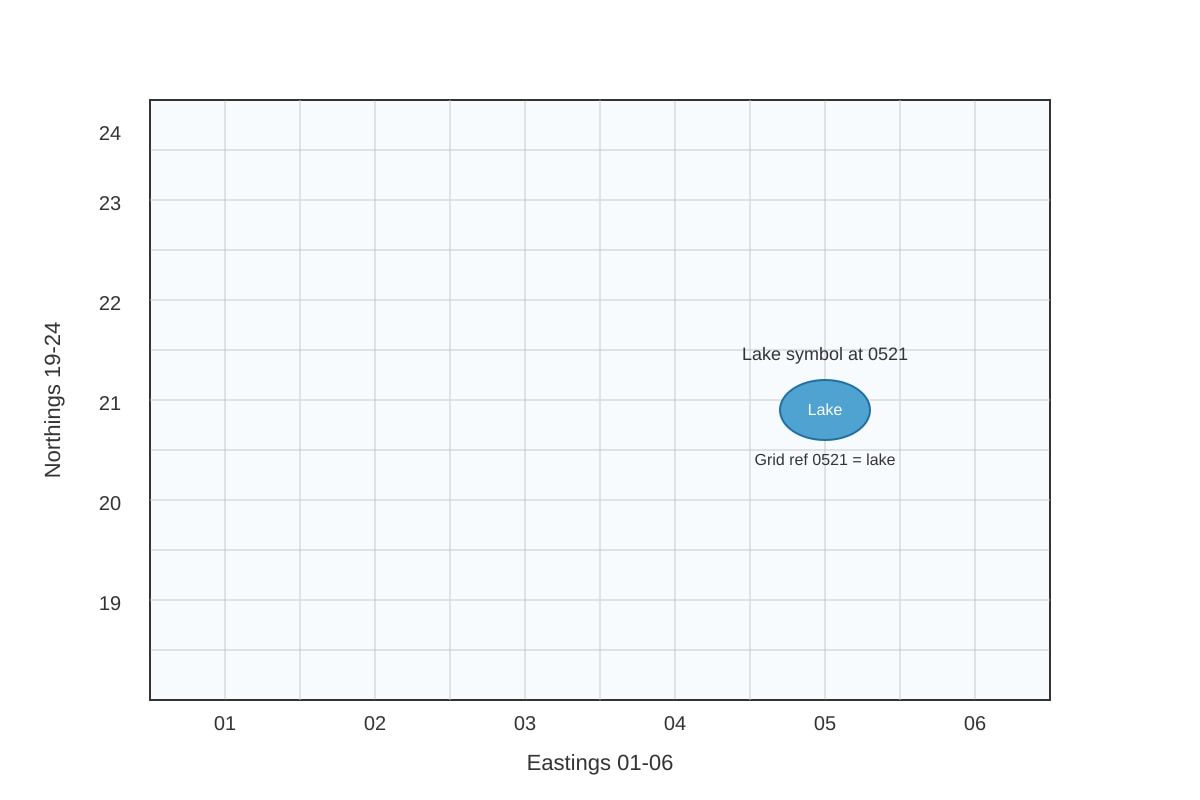
Answer: Lake
Teaching note: At easting 05, northing 21 the symbol shown is a lake.
Q4 [2 marks]
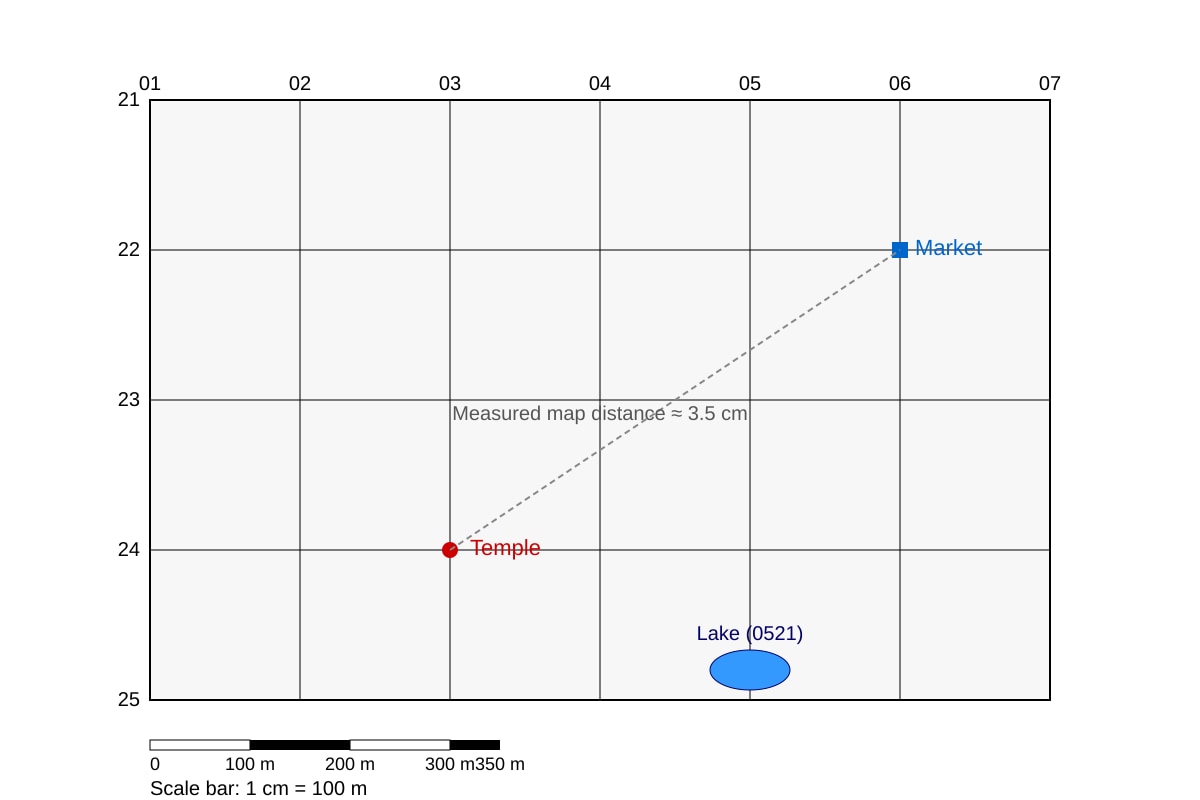
Answer: 350 m
Working: Map distance = 3.5 cm. Scale 1 cm = 100 m.
Distance = 3.5 × 100 = 350 m.
Mark breakdown: 1 mark measurement, 1 mark calculation.
Q5 [2 marks]
Answer (any two): relief/height, water bodies, roads, buildings, land use.
1 mark each. Teaching note: Topographic maps show natural and human features.
Q6 [2 marks]
Answer: Because easting runs horizontally (left–right) like x-axis, northing vertically (bottom–top) like y-axis; standard convention avoids confusion.
Mark breakdown: 1 mark for easting explanation, 1 mark for northing/convention.
Q7 [2 marks]
Answer: Student reversed order; correct is 2145.
Mark breakdown: 1 mark identify reversal, 1 mark correct reference.
Section B: Graph and Data Interpretation (14 marks)
Q8 [1 mark]
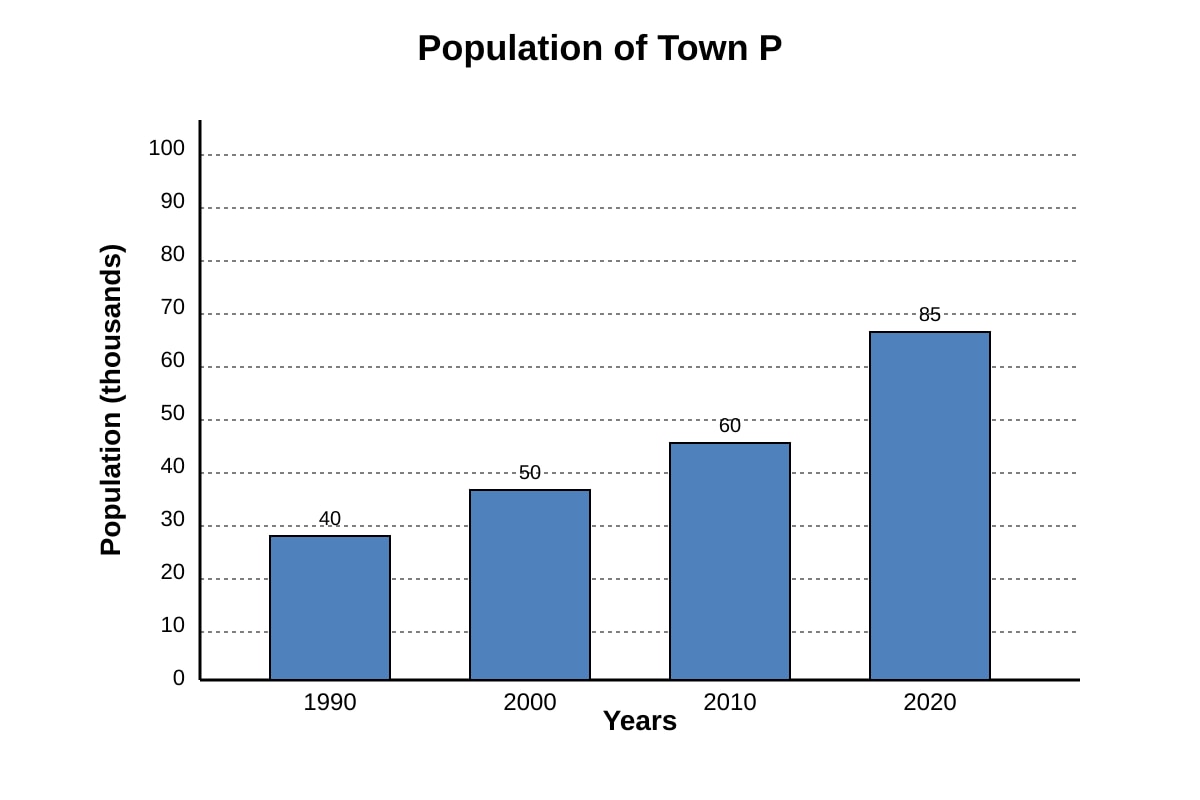
Answer: 60 000 (or 60 thousand)
Teaching note: Read bar for 2010 = 60 on y-axis (thousands).
Q9 [2 marks]
Answer: 112.5%
Working: 1990 = 40, 2020 = 85. Increase = 85 – 40 = 45.
Percentage = (45 ÷ 40) × 100 = 112.5%.
Mark breakdown: 1 mark for difference, 1 mark for percentage.
Q10 [2 marks]
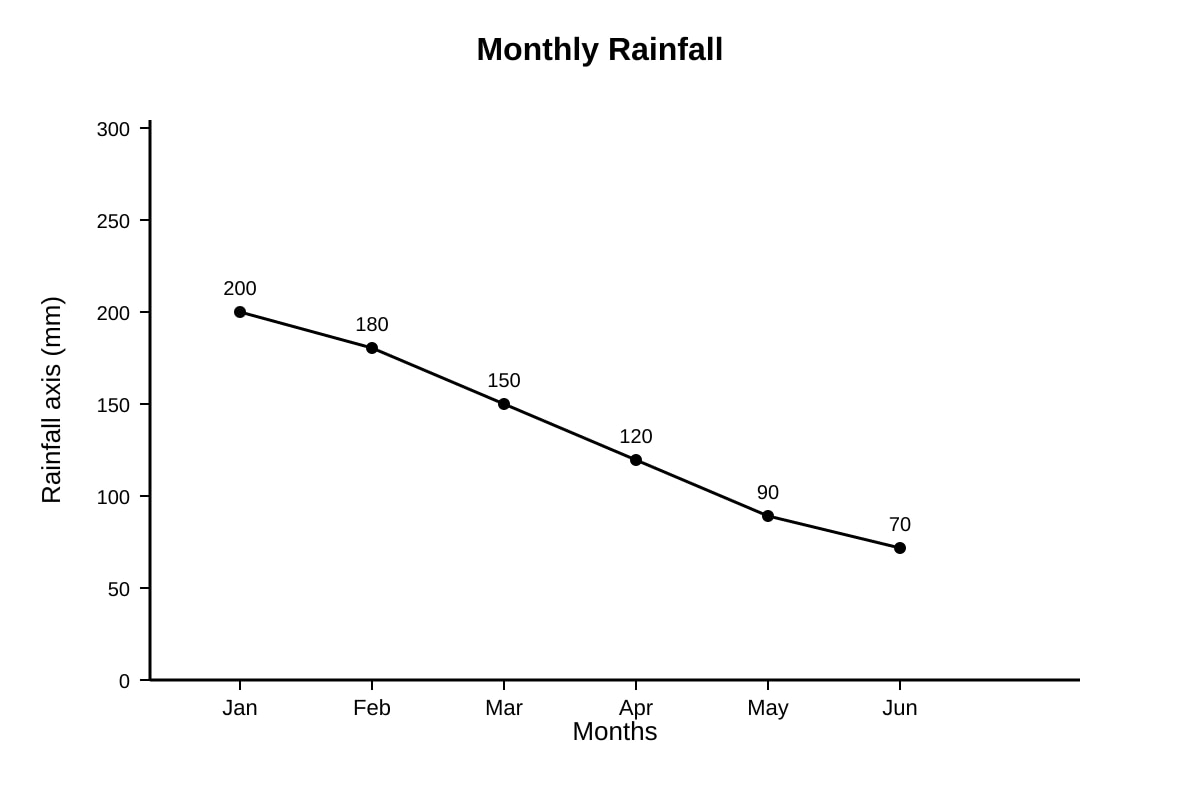
Answer: Rainfall decreased steadily from 200 mm in Jan to 70 mm in Jun.
Mark breakdown: 1 mark trend, 1 mark data reference.
Q11 [1 mark]
Answer: City B (31 °C)
Q12 [2 marks]
Answer: Graph shows visual trend/pattern at a glance; table needs reading numbers.
1 mark each point.
Q13 [2 marks]
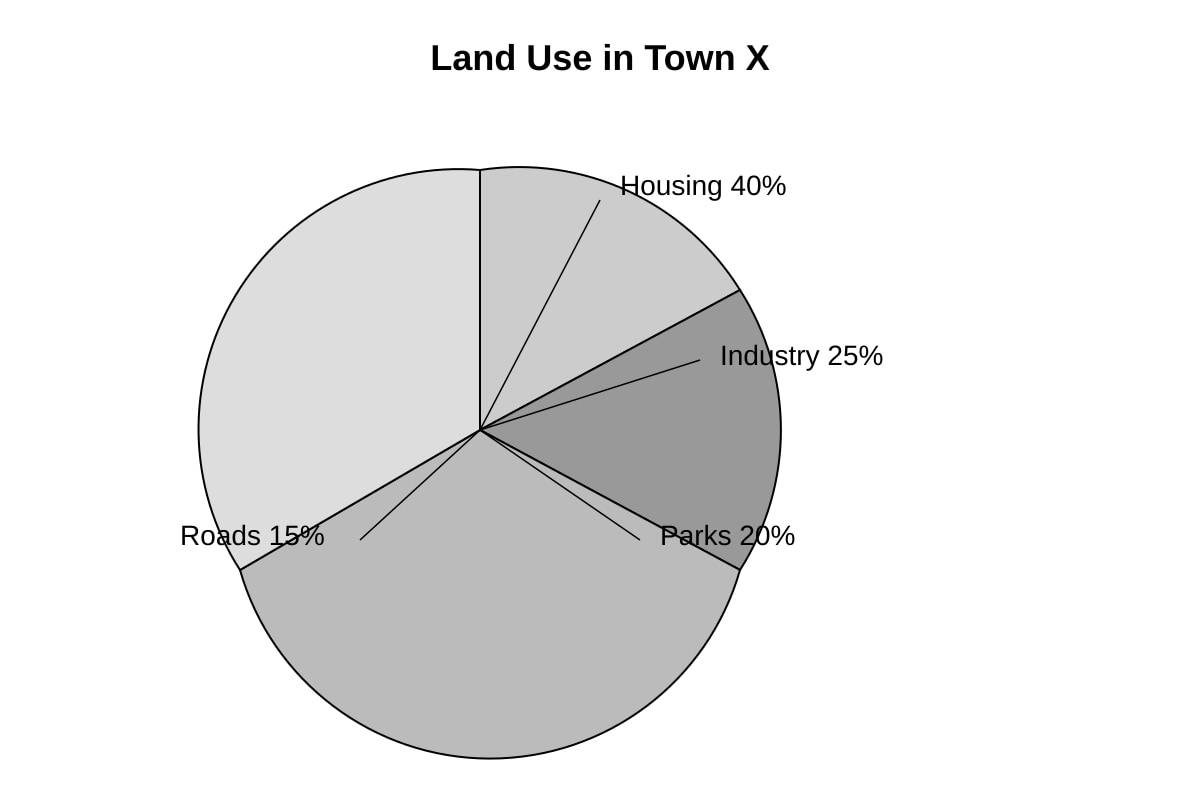
Answer: 40%
Teaching note: Slice labelled Housing = 40%.
Q14 [2 marks]
Answer: Incorrect. 2000 = 50, 2020 = 85. 85 ÷ 50 = 1.7, not double (double = 100).
Mark breakdown: 1 mark correct values, 1 mark explanation.
Section C: Photograph and Data Synthesis (12 marks)
Q15 [1 mark]
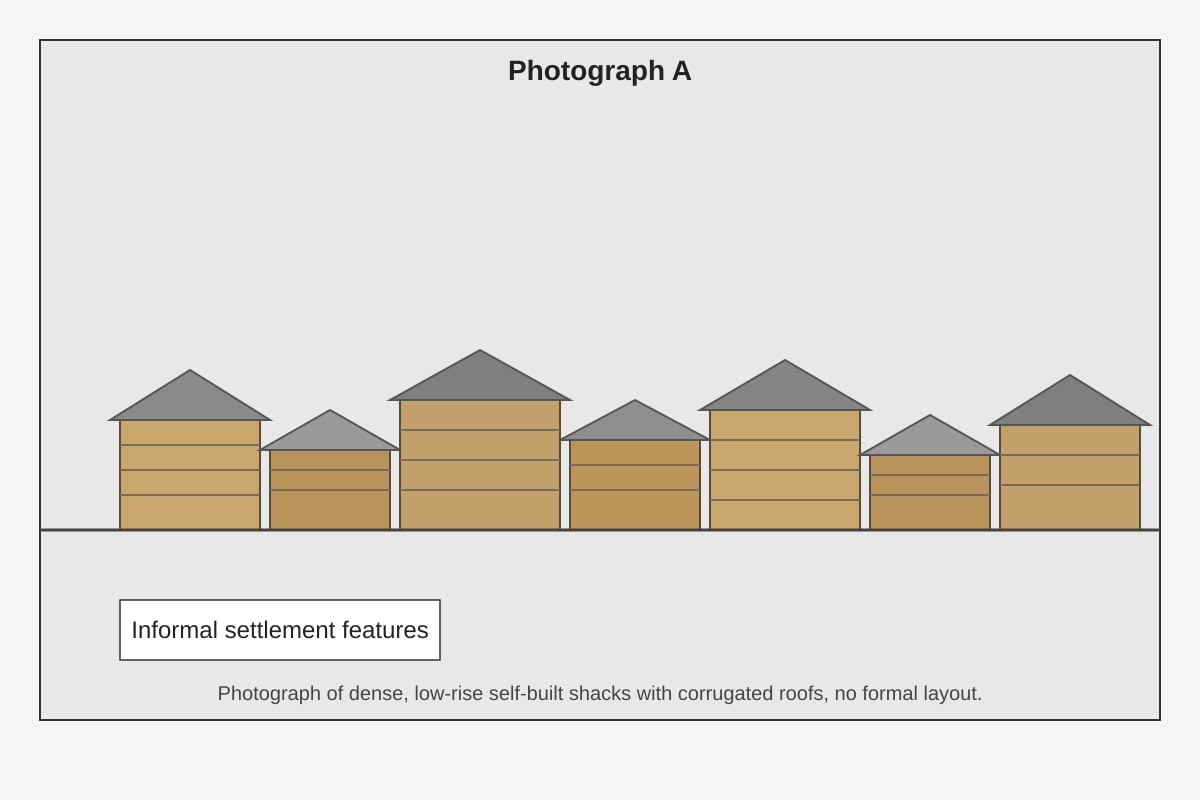
Answer: Squatter settlement / informal housing
Q16 [2 marks]
Answer: (e.g.) densely packed; makeshift materials; no planning.
1 mark each characteristic.
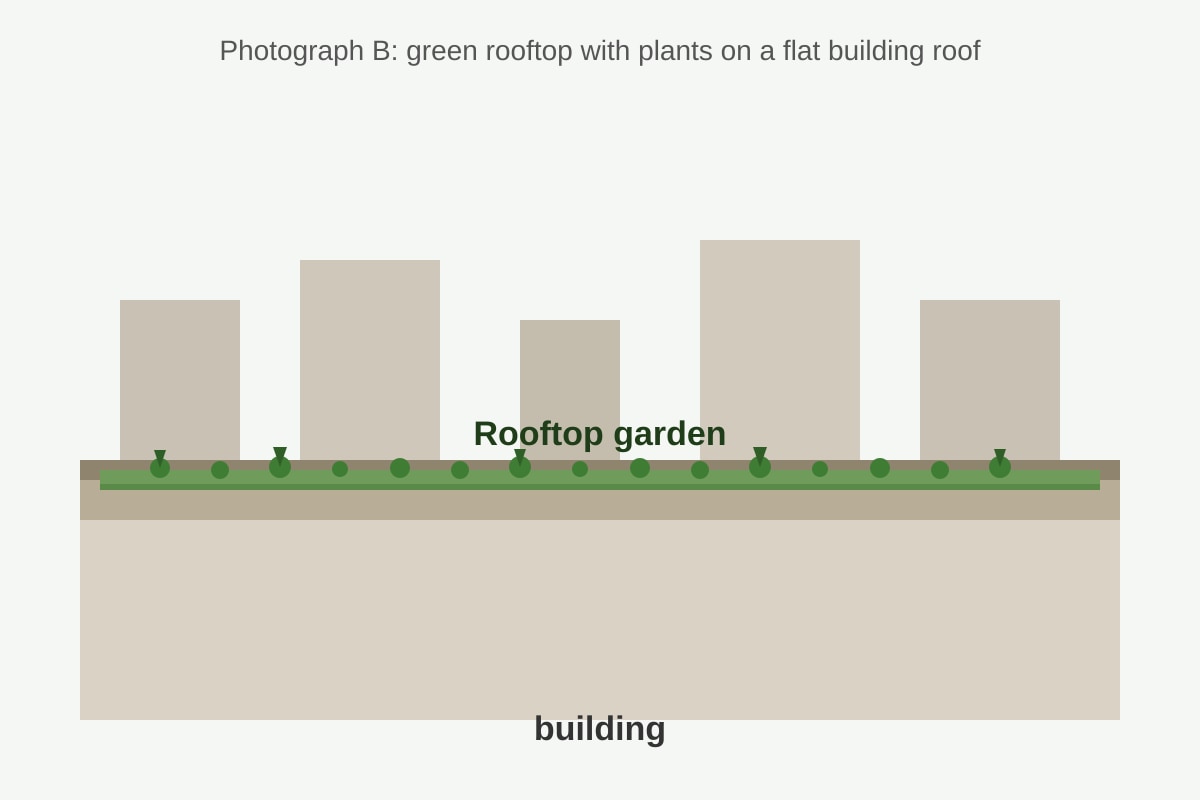
Q17 [2 marks]
Answer: Reduces heat, absorbs rainwater, adds greenery.
Mark breakdown: 1 mark identify feature, 1 mark link to sustainability.
Q18 [1 mark]
Answer: 2018 (55%)
Q19 [3 marks]
Answer: Rate rose from 55% (2018) to 70% (2021), showing better recycling.
Marking descriptors: 1 mark data, 1 mark trend, 1 mark conclusion on waste mgmt.
Q20 [3 marks]
Answer: Map shows spatial location; graph shows change over time/numbers.
Marking descriptors: 1 mark map point, 1 mark graph point, 1 mark clear difference.
End of Answer Key