AI Generated Exam Paper
Secondary 2 Geography Practice Paper 4
Free Sec 2 Geography Practice Paper 4, HY3 AI version, with questions, answers, and syllabus-aligned practice for Singapore students.
These static practice materials are generated from the site's syllabus and paper-generation workflow, with source and model context shown so students and parents can evaluate the material before use.
Questions
TuitionGoWhere Practice Paper - Geography Secondary 2
TuitionGoWhere Practice Paper (AI) — Version 4
Subject: Geography
Level: Secondary 2
Paper: Practice Paper (Map, Graph & Data Skills)
Duration: 45 minutes
Total Marks: 40
Name: ________________________
Class: ________
Date: ____________
Instructions:
- This practice paper has 20 questions across three sections.
- Answer all questions in the spaces provided.
- Use the maps, graphs, and data given to support your answers with statistics where asked.
- Marks for each question are shown in brackets [ ].
- Section totals add up exactly to 40 marks.
Section A: Map Reading (Questions 1–7) — Total 12 marks
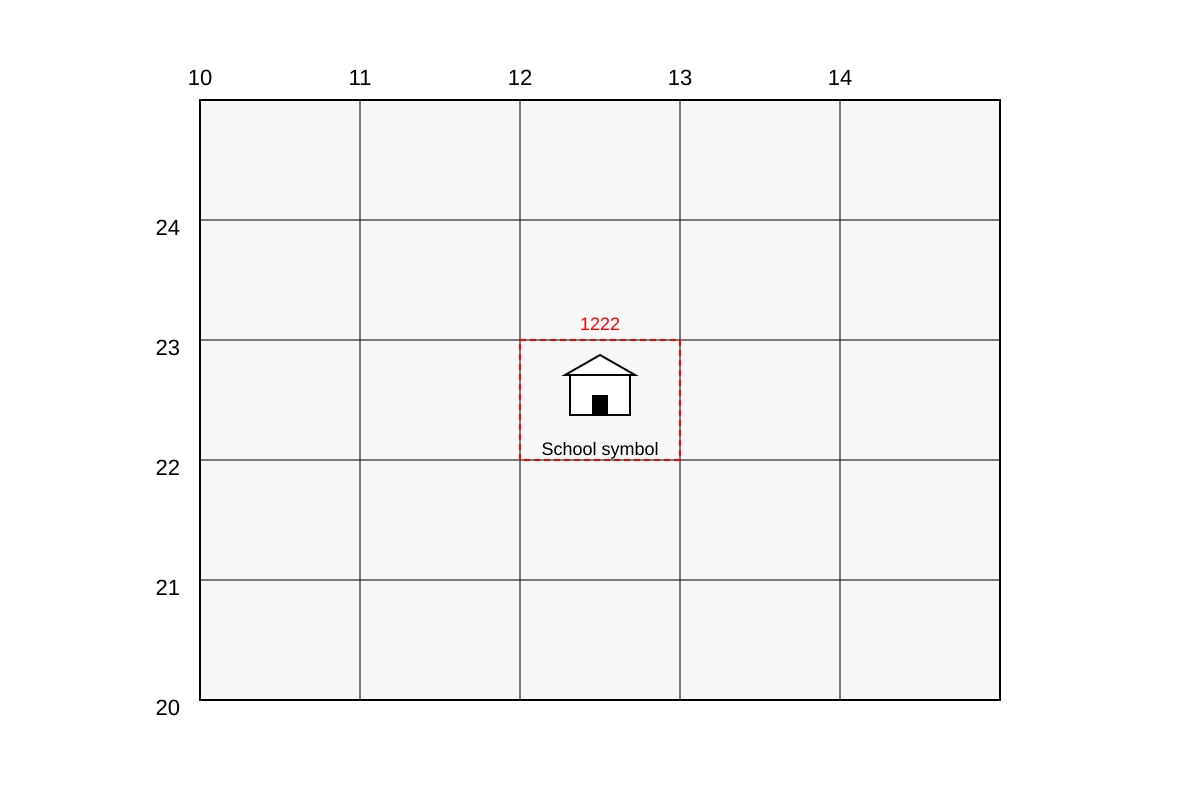
1. Study the map extract below. State the four-figure grid reference of the school. [1]
Image pending generation: map for Q1.
2. Give the six-figure grid reference of the hospital shown on the map extract in Q1. [1]
3. Name the feature found at grid reference 1323. [1]
4. State the direction of the river from the school using the map in Q1. [1]
5. Measure the straight-line distance from the school (1222) to the hospital (approx. 1322) using the map scale of 1 cm = 500 m. The measured map distance is 2 cm. Calculate the actual distance. [2]
__________________________ km
6. State two types of information that a four-figure grid reference gives. [2]
(i) __________________________
(ii) __________________________
7. Explain why grid references are useful for geographers. [4]
Section B: Graph & Data Interpretation (Questions 8–14) — Total 16 marks
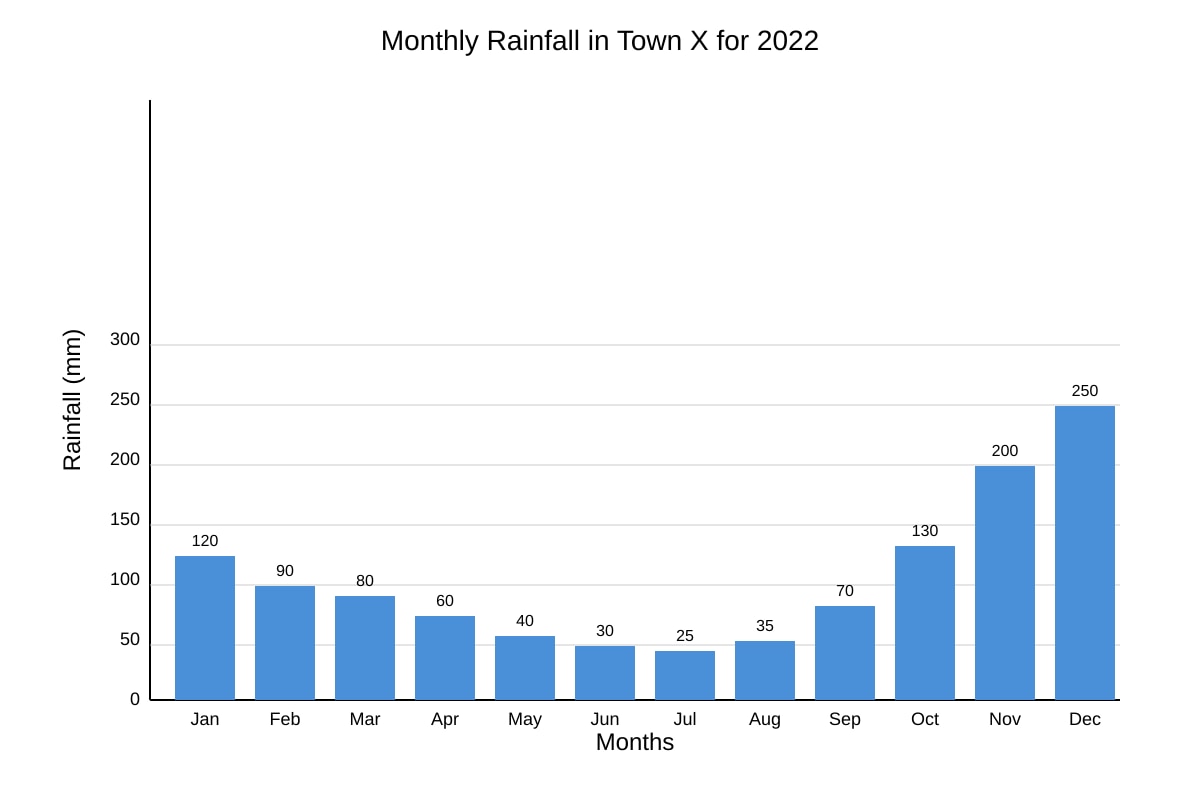
8. Study the bar graph below showing monthly rainfall in Town X for 2022.
Image pending generation: graph for Q8.
With reference to Fig. Q8, describe the trend of rainfall from January to July. [2]
9. Using the same graph, calculate the percentage decrease in rainfall from January (120 mm) to July (25 mm). Show your working. [2]
__________________________ %
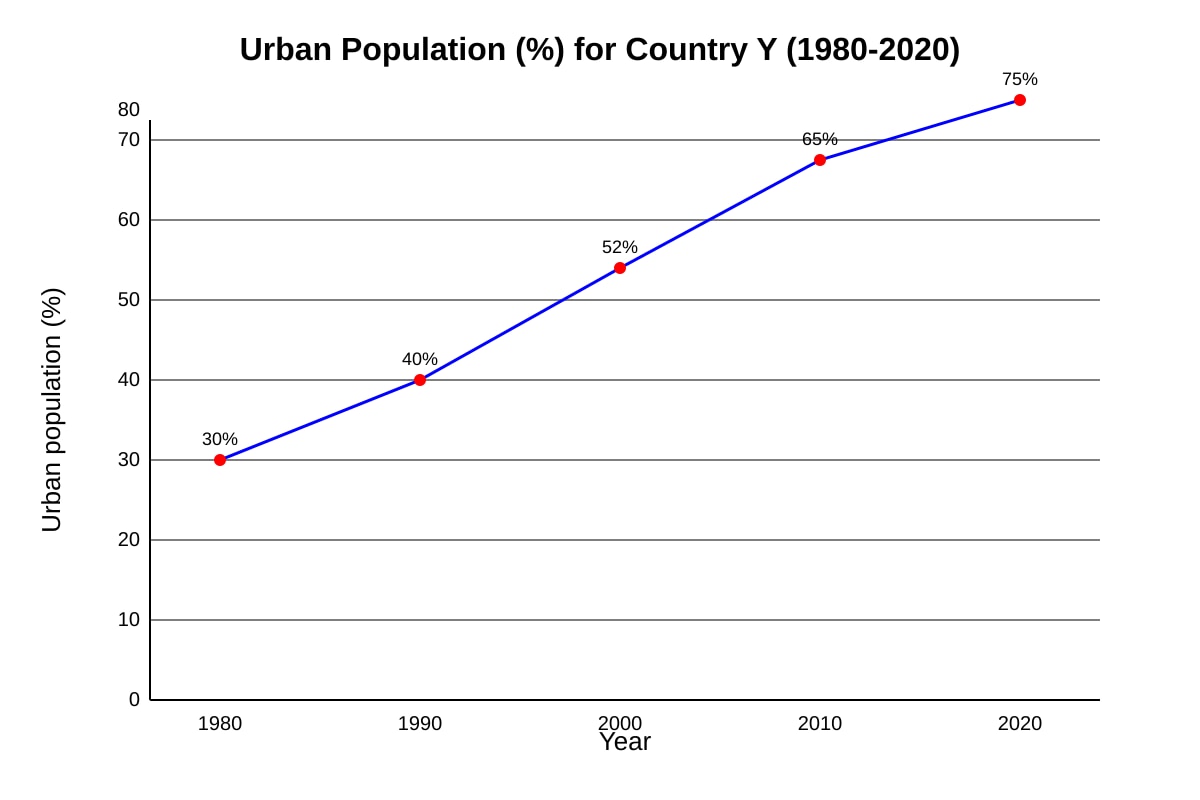
10. Study the line graph of urban population (%) for Country Y from 1980 to 2020.
Image pending generation: graph for Q10.
Describe the change in urban population from 1980 to 2020 and refer to statistics. [3]
11. Using the graph in Q10, calculate the total increase in urban population percentage from 1980 to 2020. [1]
__________________________ %
12. The table below shows land use in a town.
| Land use | Area (km²) |
|---|---|
| Housing | 12 |
| Industry | 5 |
| Park | 3 |
| Transport | 4 |
What is the total area of the town? [1]
__________________________ km²
13. Using the table in Q12, calculate the percentage of land used for housing. Show working. [2]
__________________________ %
14. Explain how a geographer can use the land use table to identify sustainability issues. [2]
Section C: Photograph & Data Synthesis (Questions 15–20) — Total 12 marks
15. Study Photograph A below showing a squatter settlement.
Image pending generation: source_image for Q15.
Describe two visible characteristics of the settlement. [2]
(i) __________________________
(ii) __________________________
16. Explain one problem caused by the type of housing in Photograph A. [2]
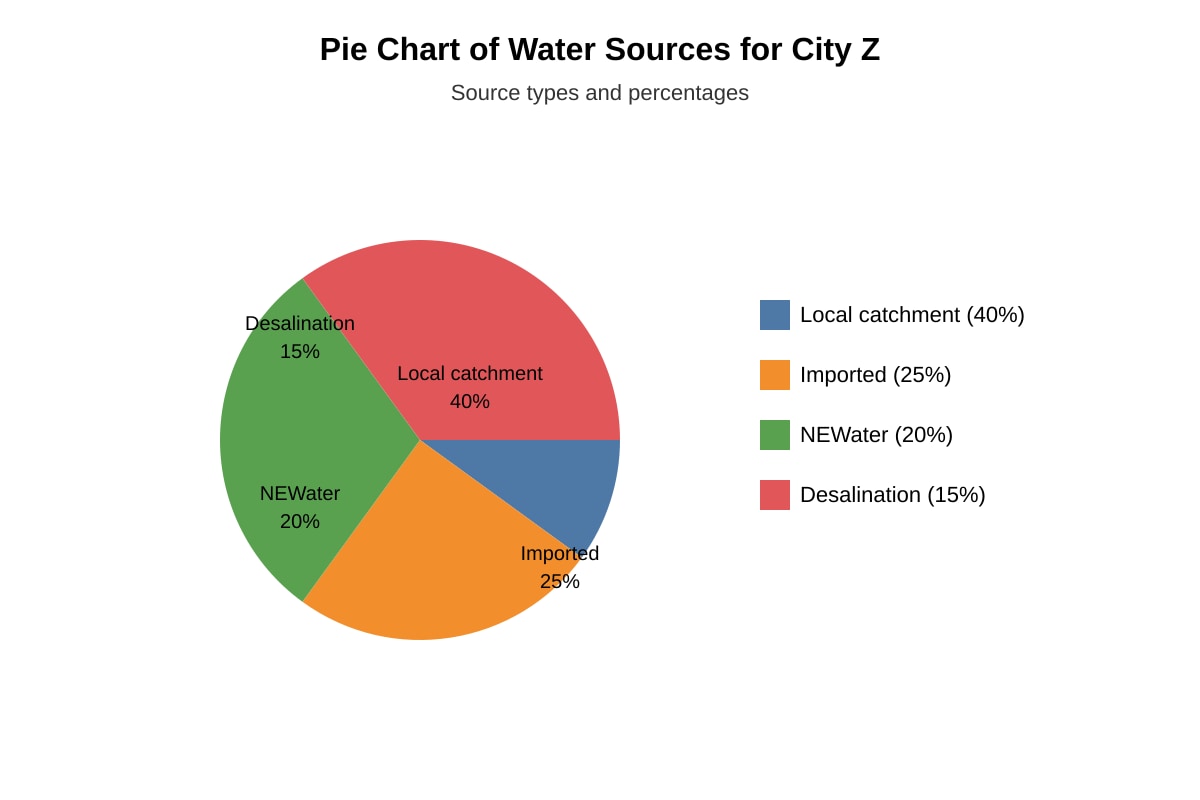
17. Study the pie chart of water sources for City Z.
Image pending generation: chart for Q17.
State the two largest water sources for City Z. [2]
(i) __________________________
(ii) __________________________
18. Using the pie chart in Q17, calculate the combined percentage of NEWater and desalination. [1]
__________________________ %
19. Explain why a city might use four different water sources. [3]
20. A student recorded temperature at two sites: Site A (urban) 32°C, Site B (rural) 28°C. Explain what this shows about urban areas. [2]
Answers
TuitionGoWhere Practice Paper Answer Key — Geography Secondary 2 (Version 4)
Total Marks: 40
Section A: Map Reading (12 marks)
Q1. [1] Grid reference: 1222
Teaching note: Read easting (left edge of square = 12) first, then northing (bottom edge = 22). Four-figure grid reference uses the bottom-left corner of the square containing the feature.
Q2. [1] Six-figure: 132222 (hospital at easting 13.2, northing 22.2 approx.)
Teaching note: Divide square into tenths; 132 = 13 + 0.2 easting, 222 = 22 + 0.2 northing.
Q3. [1] River (or named feature at 1323 per map)
Teaching note: Locate grid square 13 easting, 23 northing.
Q4. [1] North-east (based on river position relative to school)
Teaching note: Use compass rose; river is up-right from school.
Q5. [2] Actual distance = 2 cm × 500 m/cm = 1000 m = 1.0 km
Marking: 1 mark for method (2×500), 1 mark for answer 1.0 km.
Common mistake: forgetting to convert m to km.
Q6. [2] (i) Easting (horizontal location) (ii) Northing (vertical location)
1 mark each.
Q7. [4] Grid references give precise location; allow communication without ambiguity; help in map reading; used in fieldwork to record sites.
Marking descriptors: 1 mark per valid point (max 4). Example: "They allow a geographer to state exactly where a feature is using numbers, which is clearer than words."
Section B: Graph & Data Interpretation (16 marks)
Q8. [2] Rainfall decreased from 120 mm in Jan to 25 mm in Jul; overall declining trend / dry season by mid-year.
Marking: 1 mark trend, 1 mark reference to stats.
Q9. [2] Decrease = (120−25)/120 × 100 = 79.17% ≈ 79%
Working: (95/120)×100. 1 mark working, 1 mark answer.
Q10. [3] Urban population rose from 30% (1980) to 75% (2020), more than doubling; steady increase each decade.
Marking: 1 mark start/end, 1 mark trend, 1 mark statistic.
Q11. [1] 45% (75−30)
Q12. [1] Total = 12+5+3+4 = 24 km²
Q13. [2] % housing = 12/24 × 100 = 50%
1 mark working, 1 mark answer.
Q14. [2] Table shows most land for housing; little park means less green space; geographer can assess balance for sustainability.
1 mark per point.
Section C: Photograph & Data Synthesis (12 marks)
Q15. [2] (i) Dense makeshift structures (ii) Narrow paths / no drainage
1 mark each.
Q16. [2] Poor sanitation due to no drainage leads to health problems.
Marking: 1 mark problem, 1 mark link.
Q17. [2] (i) Local catchment (40%) (ii) Imported (25%)
1 mark each.
Q18. [1] 20%+15% = 35%
Q19. [3] Multiple sources reduce reliance on one; improve water security; match local conditions (e.g., sea for desal).
1 mark each.
Q20. [2] Urban area warmer (urban heat island); 4°C higher than rural.
1 mark observation, 1 mark concept.
Free quiz and exam paper access
Enter your details to view this paper
Your access is remembered on this device.