AI Generated Exam Paper
Secondary 2 Geography Practice Paper 2
Free Sec 2 Geography Practice Paper 2, HY3 AI version, with questions, answers, and syllabus-aligned practice for Singapore students.
These static practice materials are generated from the site's syllabus and paper-generation workflow, with source and model context shown so students and parents can evaluate the material before use.
Questions
TuitionGoWhere Practice Paper - Geography Secondary 2
TuitionGoWhere Practice Paper (AI) — Version 2 of 5
Subject: Geography
Level: Secondary 2
Paper: Practice Paper (Map Graph Data Skills)
Duration: 45 minutes
Total Marks: 40
Name: ________________________
Class: ________
Date: ____________
Instructions:
- This practice paper has three sections.
- Answer all questions.
- Use a ruler and pencil for map questions if needed.
- Write your answers in the spaces provided.
Section A: Map Reading (12 marks)
Questions 1–6 carry 1–3 marks each.
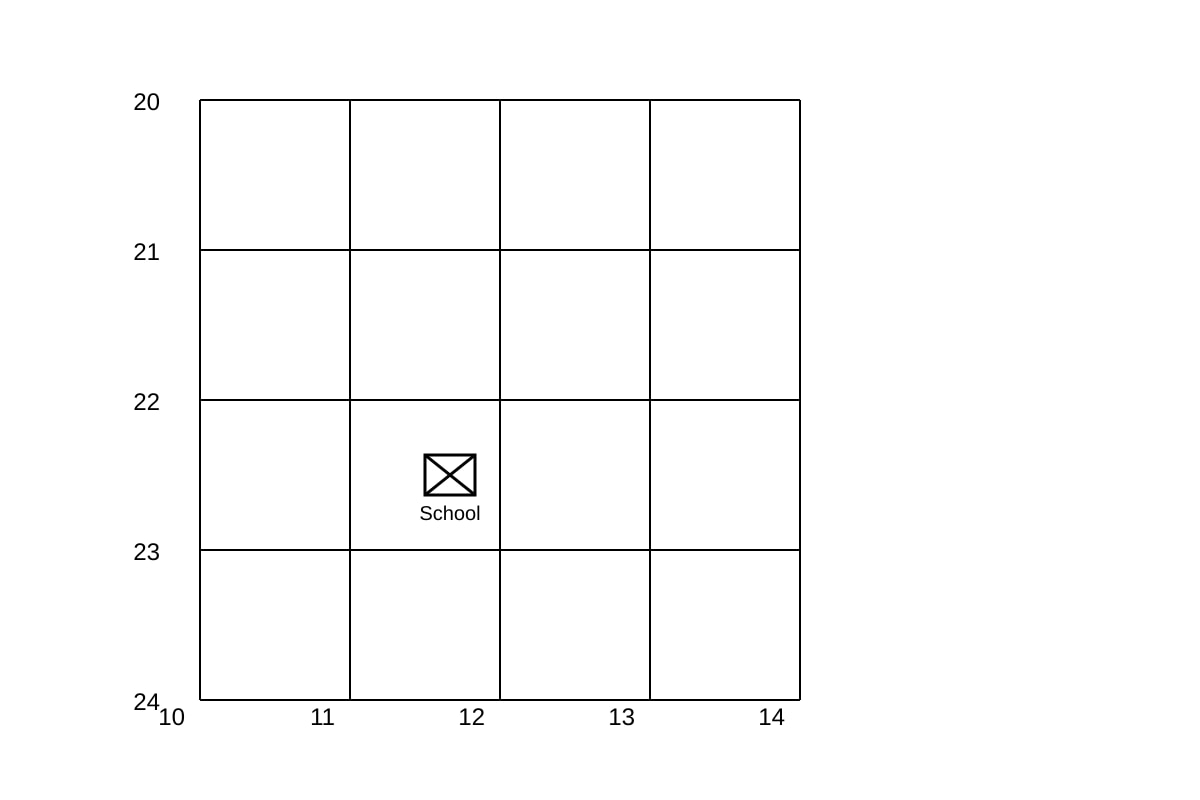
1. Study the map extract below. State the four-figure grid reference of the school. (1 mark)
Image pending generation: map for Q1.
2. Give the six-figure grid reference of the hospital shown on the map above. (2 marks)
3. Describe the direction of the river from the school using the map. (1 mark)
4. Measure the straight-line distance from the school to the hospital if the map scale is 1 cm = 500 m and the measured map distance is 4 cm. (2 marks)
5. State two features you can identify from the map that show this is an urban area. (2 marks)
(a) __________________________________________________
(b) __________________________________________________
6. Explain why grid references are useful for geographers. (4 marks)
Section B: Graph and Data Interpretation (16 marks)
Questions 7–13 carry 2–3 marks each.
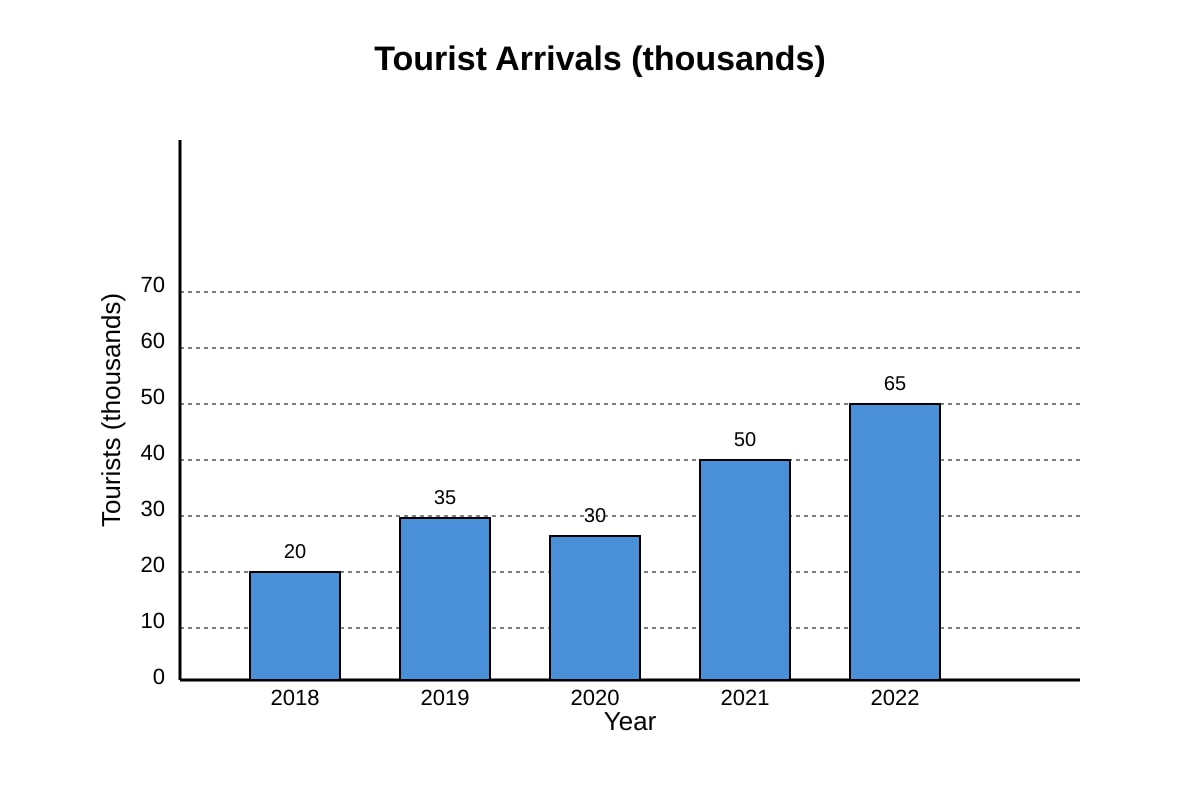
The bar graph below shows the number of tourists visiting a coastal town from 2018 to 2022.
Image pending generation: graph for Q7.
7. With reference to Fig. Q7-fig2, describe the trend in tourist arrivals from 2018 to 2022. (3 marks)
8. Calculate the percentage increase in tourist arrivals from 2018 to 2022. (2 marks)
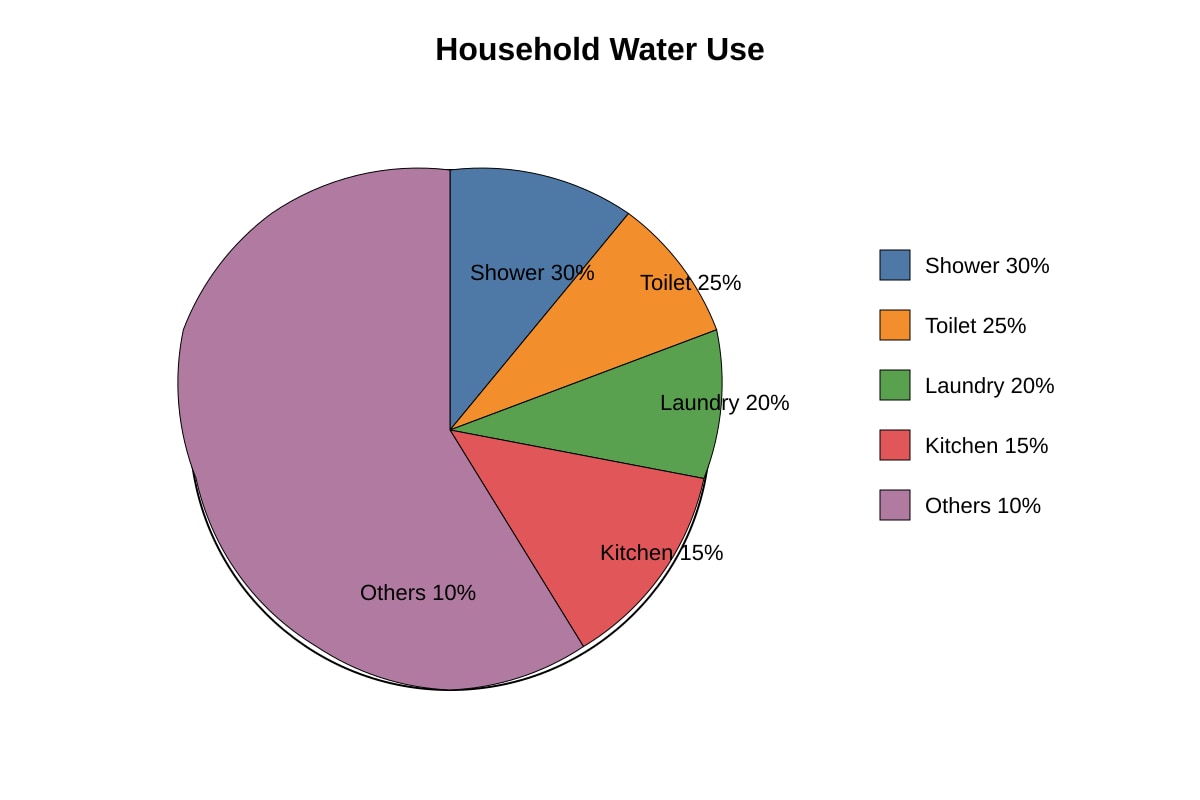
9. Study the pie chart below showing water usage in a household. State the two largest categories. (2 marks)
Image pending generation: chart for Q9.
(a) __________________________________________________
(b) __________________________________________________
10. A line graph shows monthly rainfall in mm: Jan 100, Feb 120, Mar 90, Apr 80, May 60. Describe the distribution of rainfall. (2 marks)
11. Using the table below, state which city has the highest average temperature. (2 marks)
| City | Avg Temp (°C) |
|---|---|
| A | 28 |
| B | 31 |
| C | 26 |
12. Explain one reason why reading graphs carefully is important in Geography. (2 marks)
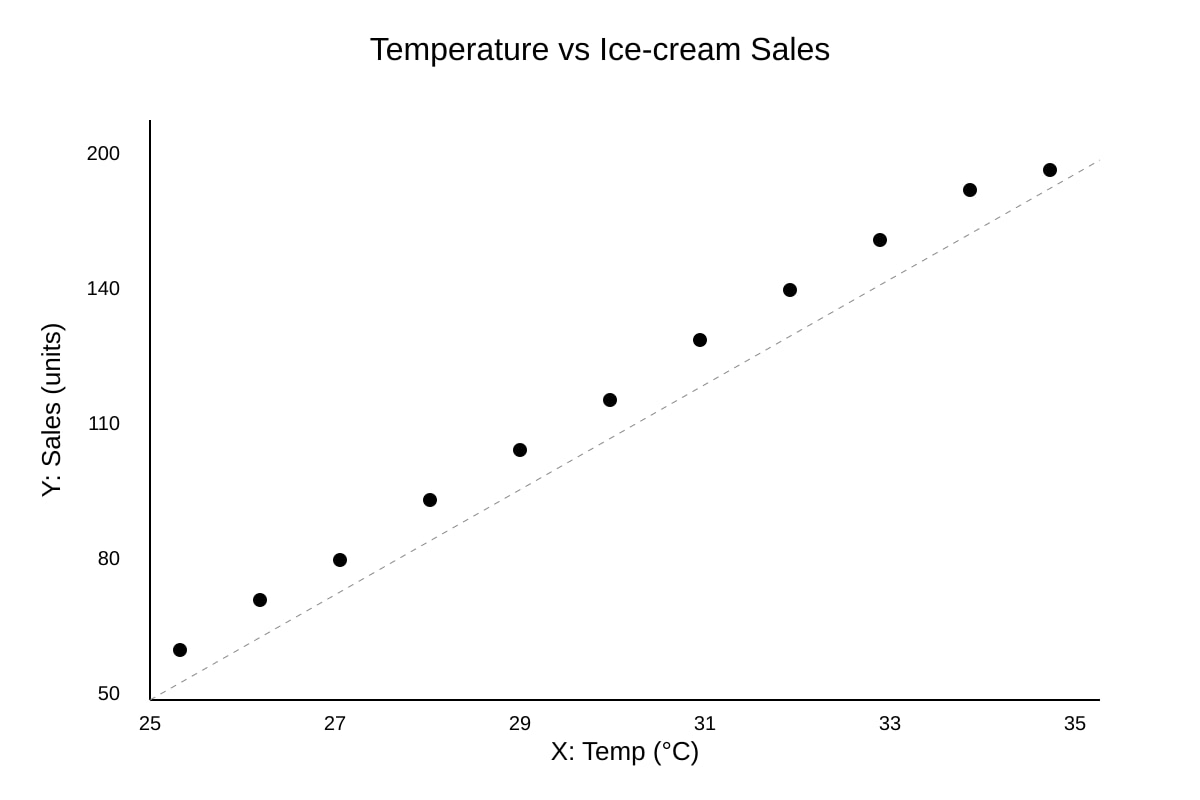
13. The scatter plot shows temperature vs ice-cream sales. Describe the relationship. (3 marks)
Image pending generation: graph for Q13.
Section C: Photograph and Fieldwork Skills (12 marks)
Questions 14–20 carry 1–3 marks each.
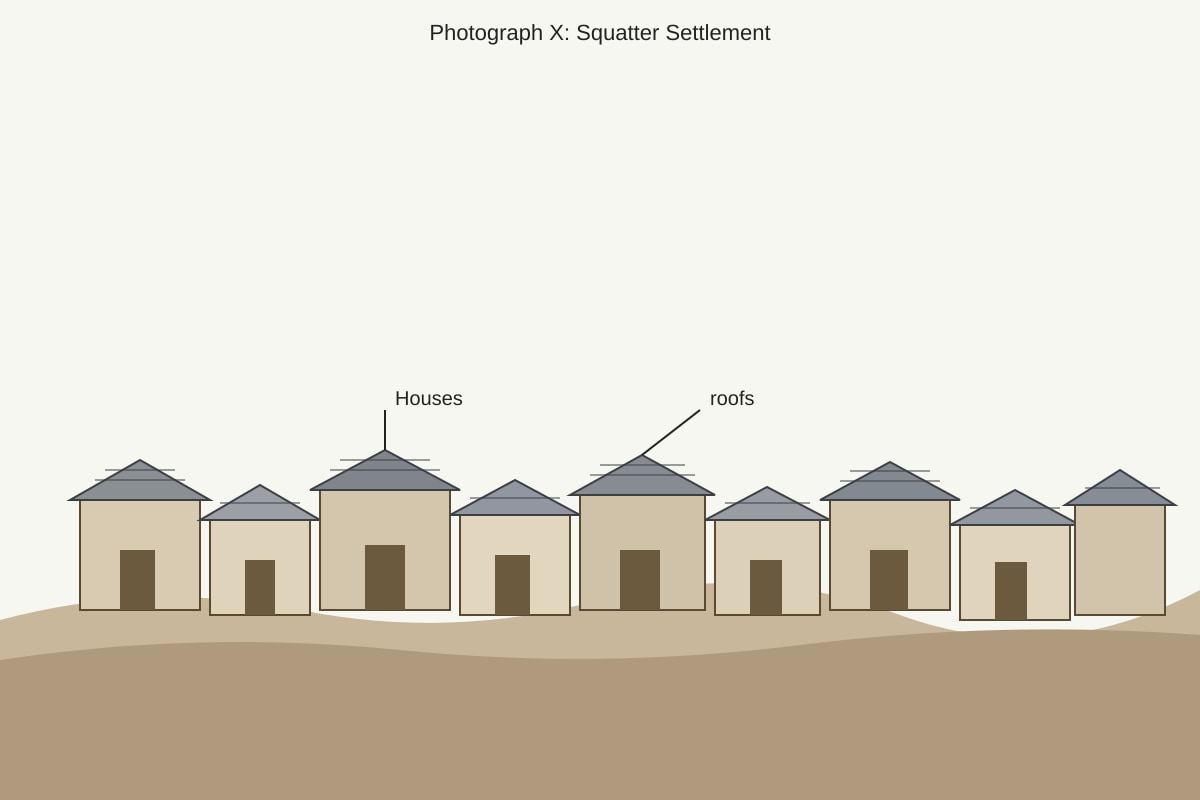
14. Study Photograph X showing a squatter settlement. State one visible characteristic. (1 mark)
Image pending generation: source_image for Q14.
15. Explain how the housing type in Photograph X can affect the environment. (3 marks)
16. A student wants to survey litter in a park. Which of two locations (near entrance or deep inside) is better? Justify. (2 marks)
17. State the compass direction of the wind if smoke blows from west to east. (1 mark)
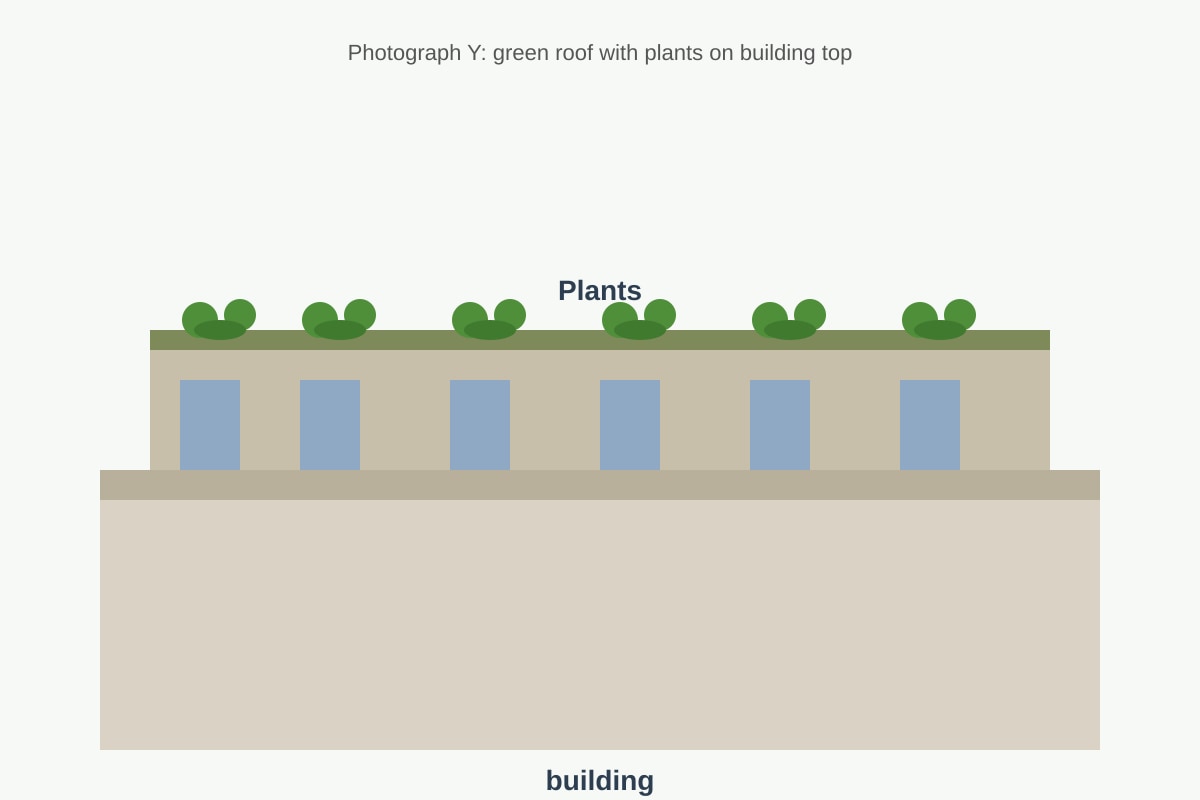
18. Study Photograph Y of a rooftop garden. Describe one sustainability feature. (2 marks)
Image pending generation: source_image for Q18.
19. Give one reason why fieldwork data should be recorded in a table. (2 marks)
20. Explain how a bar graph differs from a pie chart in showing data. (3 marks)
End of Paper
Answers
TuitionGoWhere Practice Paper Answer Key — Geography Secondary 2 (Version 2)
Total Marks: 40
Section A: Map Reading (12 marks)
Q1. (1 mark)
Answer: 1222
Teaching note: Four-figure grid reference uses easting first (12) then northing (22). The school is within square 12–13 east, 22–23 north, so bottom-left corner is 1222.
Common mistake: Reversing to 2212.
Q2. (2 marks)
Answer: 123223 (or appropriate six-figure based on hospital position)
Marking: 1 mark for easting 123, 1 mark for northing 223.
Teaching note: Six-figure splits the square into tenths; hospital at easting 12 + 3/10, northing 22 + 3/10 → 123223.
Q3. (1 mark)
Answer: River is north / north-east of school (depending on map).
Teaching note: Use map arrow or grid to find relative direction.
Q4. (2 marks)
Answer: 4 cm × 500 m/cm = 2000 m = 2 km.
Marking: 1 mark for method, 1 mark for correct distance.
Teaching note: Multiply map distance by scale.
Q5. (2 marks)
Answer: (a) School (b) Hospital / roads / buildings (any two urban features).
1 mark each.
Q6. (4 marks)
Answer points:
- Grid references give exact location (1)
- Avoid confusion in describing places (1)
- Useful for navigation and mapping (1)
- Standard method used worldwide (1)
Teaching note: Explain each point briefly.
Section B: Graph and Data Interpretation (16 marks)
Q7. (3 marks)
Answer: Overall increase from 20k (2018) to 65k (2022). Dip in 2020 (30k). Rise after 2020.
Marking: 1 trend, 1 data, 1 detail.
Teaching note: Cite numbers.
Q8. (2 marks)
Answer: (65−20)/20 × 100 = 225%.
Marking: 1 formula, 1 answer.
Q9. (2 marks)
Answer: (a) Shower 30% (b) Toilet 25%. 1 mark each.
Q10. (2 marks)
Answer: Rainfall decreases from 100 to 60 mm Jan–May, highest in Feb.
1 mark trend, 1 mark data.
Q11. (2 marks)
Answer: City B (31°C). 1 mark identify, 1 mark correct.
Q12. (2 marks)
Answer: To avoid misreading data / make accurate conclusions. 1+1.
Q13. (3 marks)
Answer: Positive correlation; higher temp → more sales.
Marking: 1 relationship, 2 explanation.
Section C: Photograph and Fieldwork (12 marks)
Q14. (1 mark)
Answer: Dense makeshift houses / corrugated roofs.
Q15. (3 marks)
Answer: Causes pollution, poor sanitation, deforestation. 1 mark each.
Q16. (2 marks)
Answer: Near entrance – more representative of user litter. 1+1 justify.
Q17. (1 mark)
Answer: East (wind from west).
Q18. (2 marks)
Answer: Reduces heat, absorbs rainwater. 1+1.
Q19. (2 marks)
Answer: Organised, easy compare. 1+1.
Q20. (3 marks)
Answer: Bar shows comparison of amounts; pie shows proportion of whole. 1.5+1.5.
End of Answer Key
Free quiz and exam paper access
Enter your details to view this paper
Your access is remembered on this device.