AI Generated Exam Paper
Secondary 2 Geography Practice Paper 1
Free Sec 2 Geography Practice Paper 1, HY3 AI version, with questions, answers, and syllabus-aligned practice for Singapore students.
These static practice materials are generated from the site's syllabus and paper-generation workflow, with source and model context shown so students and parents can evaluate the material before use.
Questions





Free quiz and exam paper access
Enter your details to view this paper
Your access is remembered on this device.
Answers
Answer Key — TuitionGoWhere Practice Paper Geography Secondary 2 (Version 1)
Subject: Geography
Level: Secondary 2
Paper: Practice Paper (Map, Graph & Data Skills)
Total Marks: 40
Section A: Map Reading (12 marks)
Q1 [1]
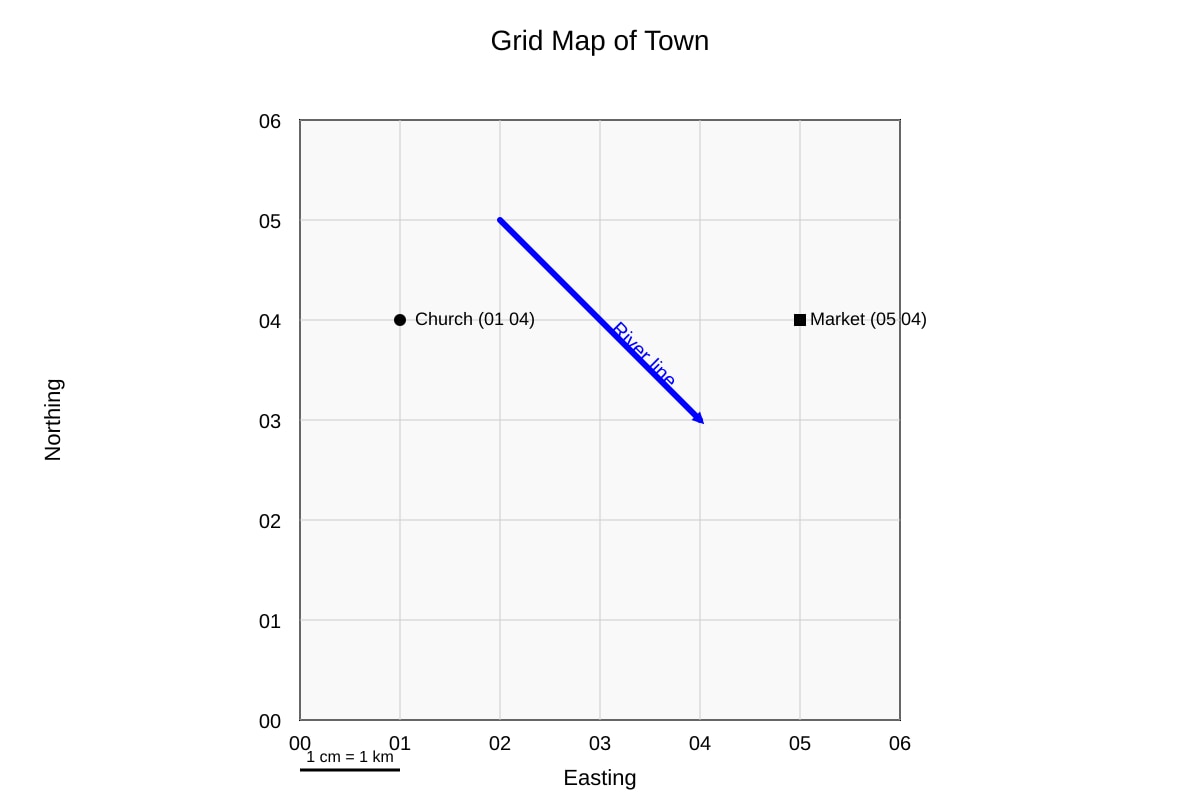
Answer: 03 04
Teaching note: Read easting (horizontal, 03) first, then northing (vertical, 04). Common mistake: writing northing first.
Q2 [2]
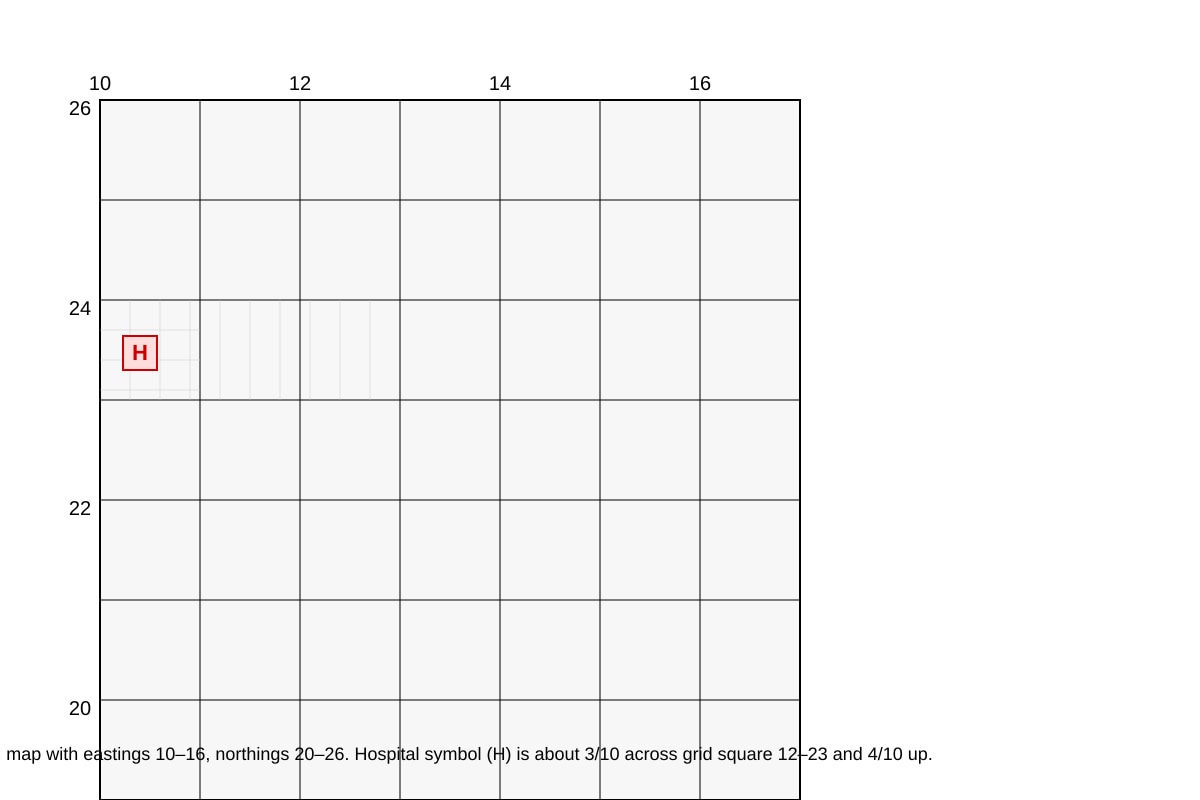
Answer: 123 234
Working: Base easting 12 + 3 tenths = 123; base northing 23 + 4 tenths = 234. Six-figure splits each square into 10.
Marking: 1 for easting 123, 1 for northing 234.
Q3 [1]
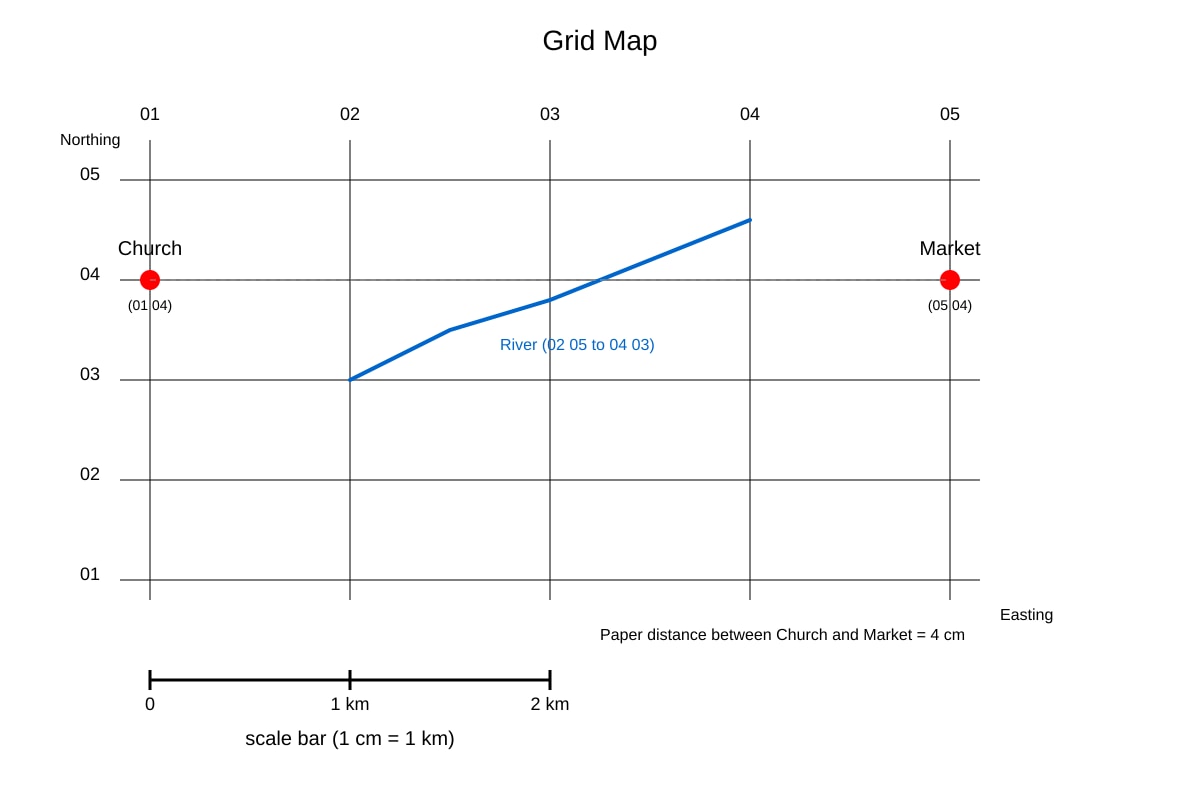
Answer: Lake
Teaching note: At easting 05, northing 02 the symbol is a lake.
Q4 [2]
Answer: (any two) symbols meaning, colours used, scale, north arrow.
Marking: 1 mark each.
Q5 [1]
Answer: South-east (from 02 05 to 04 03 = east + south)
Teaching note: Easting increases (east), northing decreases (south).
Q6 [2]
Answer: 4 km
Working: Paper distance 4 cm × 1 km/cm = 4 km.
Marking: 1 for 4 cm measured, 1 for converted.
Q7 [3]
Answer: Easting before northing is standard so locations are unique and consistent; matches coordinate (x,y) order; avoids confusion.
Marking: 1 each for standard convention, coordinate analogy, avoids error.
Section B: Graph & Data Interpretation (16 marks)
Q8 [1]
Answer: 35,000 (or 35 thousand)
Teaching note: Read 2010 bar height.
Q9 [3]
Answer: Rainfall decreased steadily from 200 mm in Jan to 70 mm in Jun.
Marking: 1 trend, 1 start figure, 1 end figure.
Teaching: Cite stats from graph.
Q10 [3]
Working: Increase = 64 – 40 = 24 percentage points.
% increase = (24 / 40) × 100 = 60%.
Answer: 60%.
Marking: 1 diff, 1 division, 1 final %.
Q11 [1]
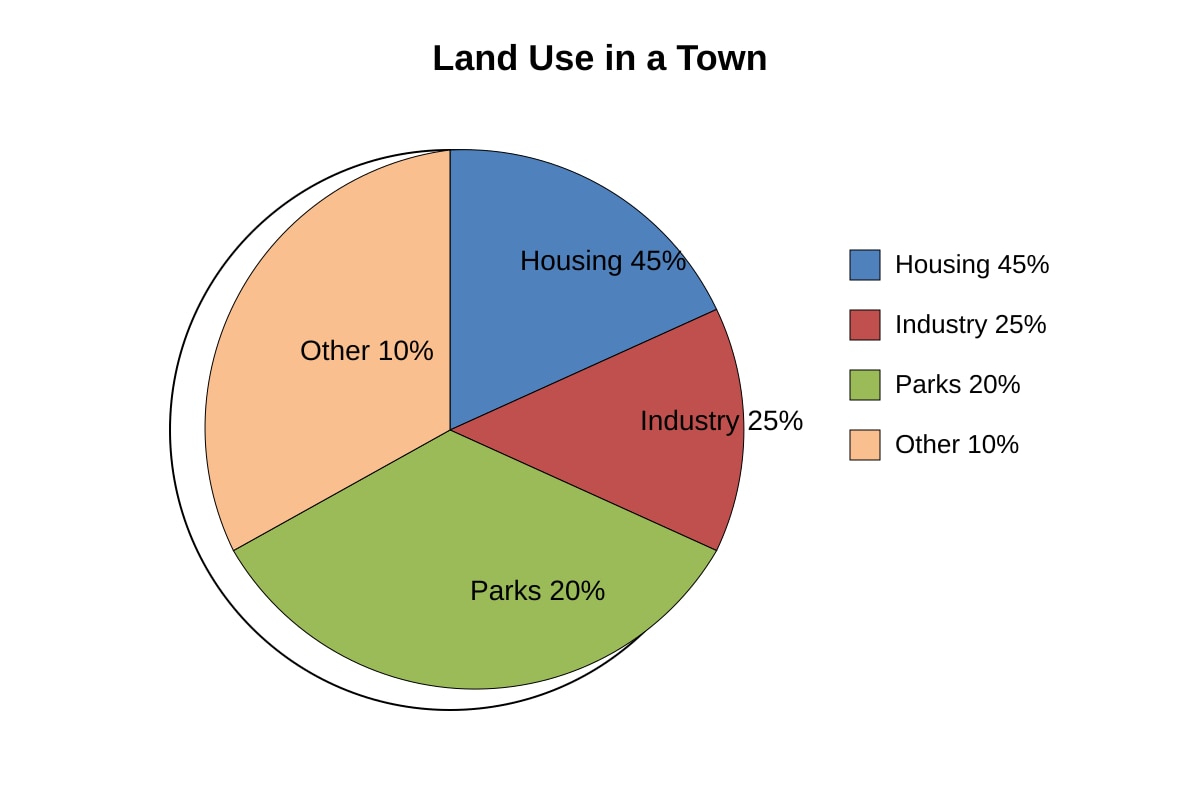
Answer: Housing (45%)
Q12 [2]
Answer: 2010–2020 (0.9°C rise vs 0.6°C).
Marking: 1 years, 1 reason.
Q13 [3]
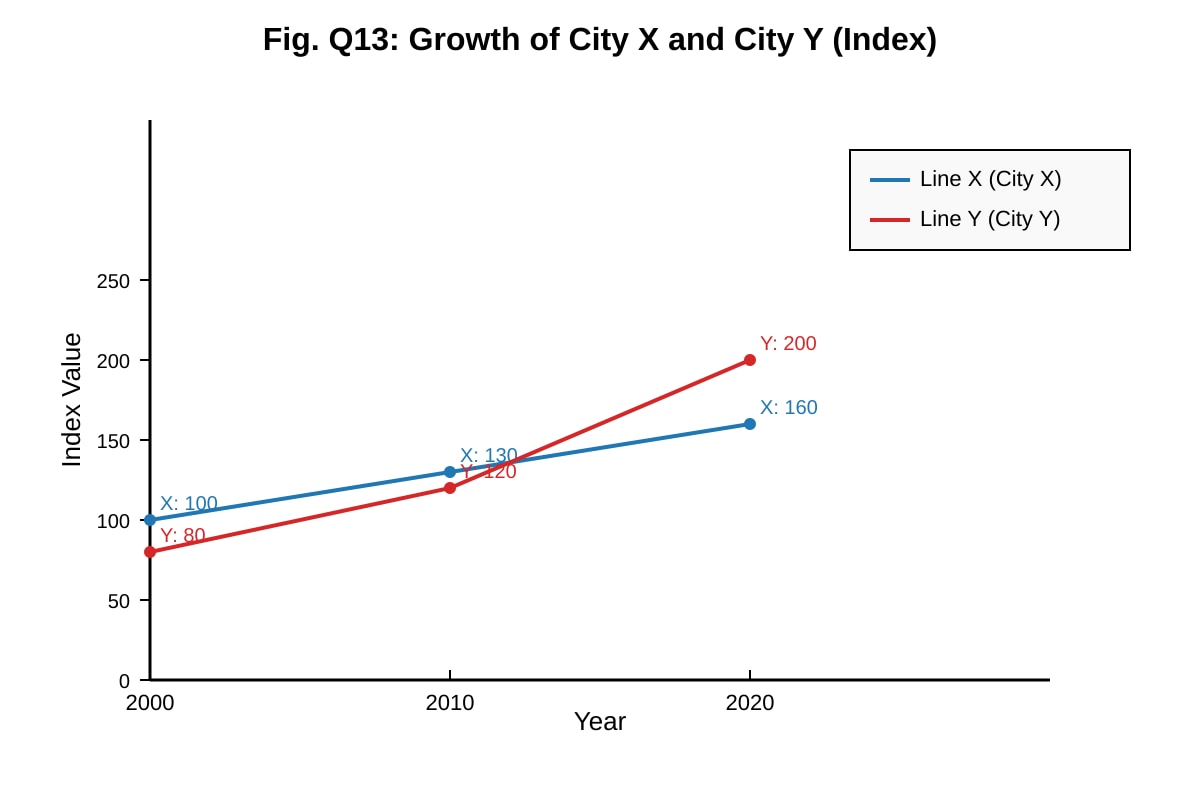
Answer: City Y grew faster (80→200, +150) than X (100→160, +60). Both increased.
Marking: 1 each for Y growth, X growth, comparison.
Q14 [3]
Answer: Starting y-axis above 0 exaggerates differences; small changes look large; misleads reader.
Marking: 1 exaggerate, 1 example, 1 misleading effect.
Section C: Photograph & Fieldwork (12 marks)
Q15 [1]
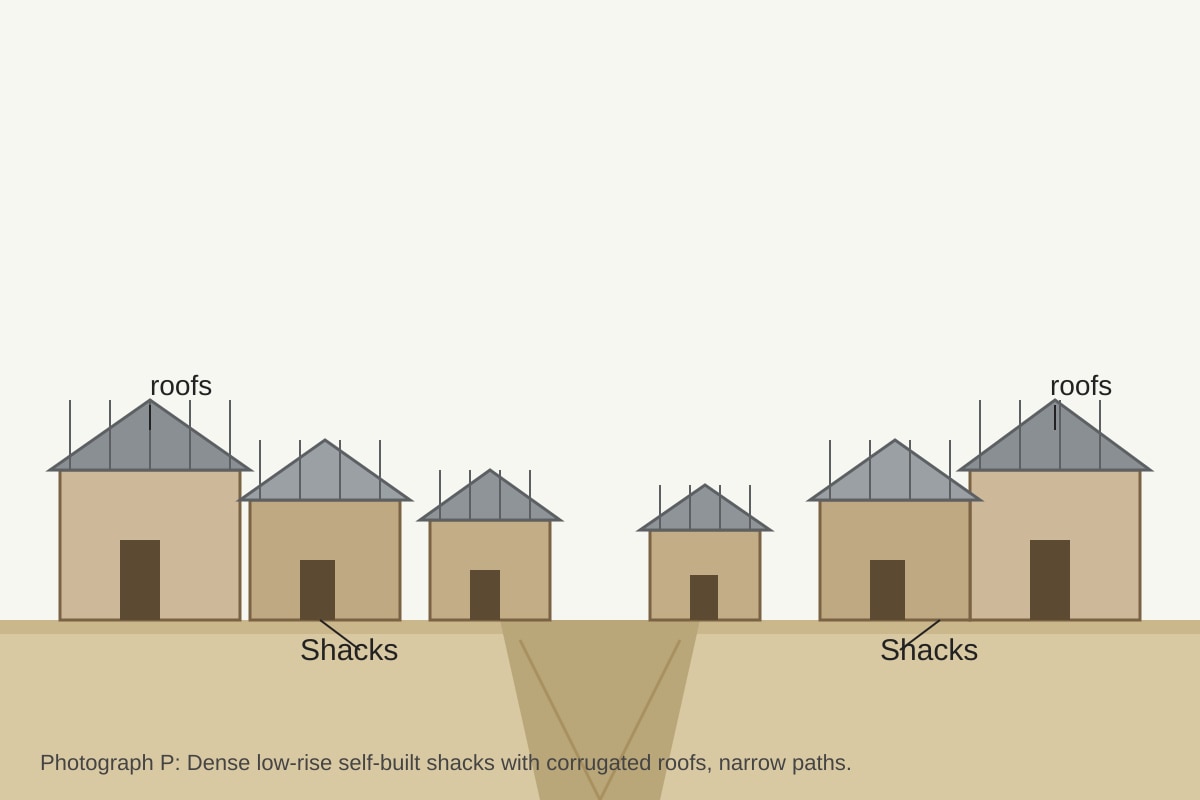
Answer: e.g., corrugated metal roofs / dense shacks.
Q16 [3]
Answer: Informal housing/squatter settlement; challenge: poor sanitation.
Marking: 1 type, 2 for explained challenge.
Q17 [2]
Answer: Busy road; more traffic to observe, relevant to study.
Marking: 1 location, 1 justification.
Q18 [2]
Answer: Title, north arrow, scale, key (any two). 1 each.
Q19 [2]
Answer: Reduces heat, absorbs rain, adds greenery. 1 each for feature + benefit.
Q20 [2]
Answer: Not representative of whole neighbourhood; results biased. 1 each.
Total 40 marks — matches paper.