From Real Exams Exam Paper
Secondary 2 Geography Semestral Assessment 2 (End of Year) Paper 5
Free Sec 2 Geography SA2 Paper 5, HY3 Exam version, with questions, answers, and syllabus-aligned practice for Singapore students.
These static practice materials are generated from the site's syllabus and paper-generation workflow, with source and model context shown so students and parents can evaluate the material before use.
Questions
Free quiz and exam paper access
Enter your details to view this paper
Your access is remembered on this device.
Answers
TuitionGoWhere Exam Practice (AI) — SA2 Geography Secondary 2 (Version 5) Answer Key
Total Marks: 60
Duration: 60 minutes
Section A: Map and Grid Skills (12 marks)
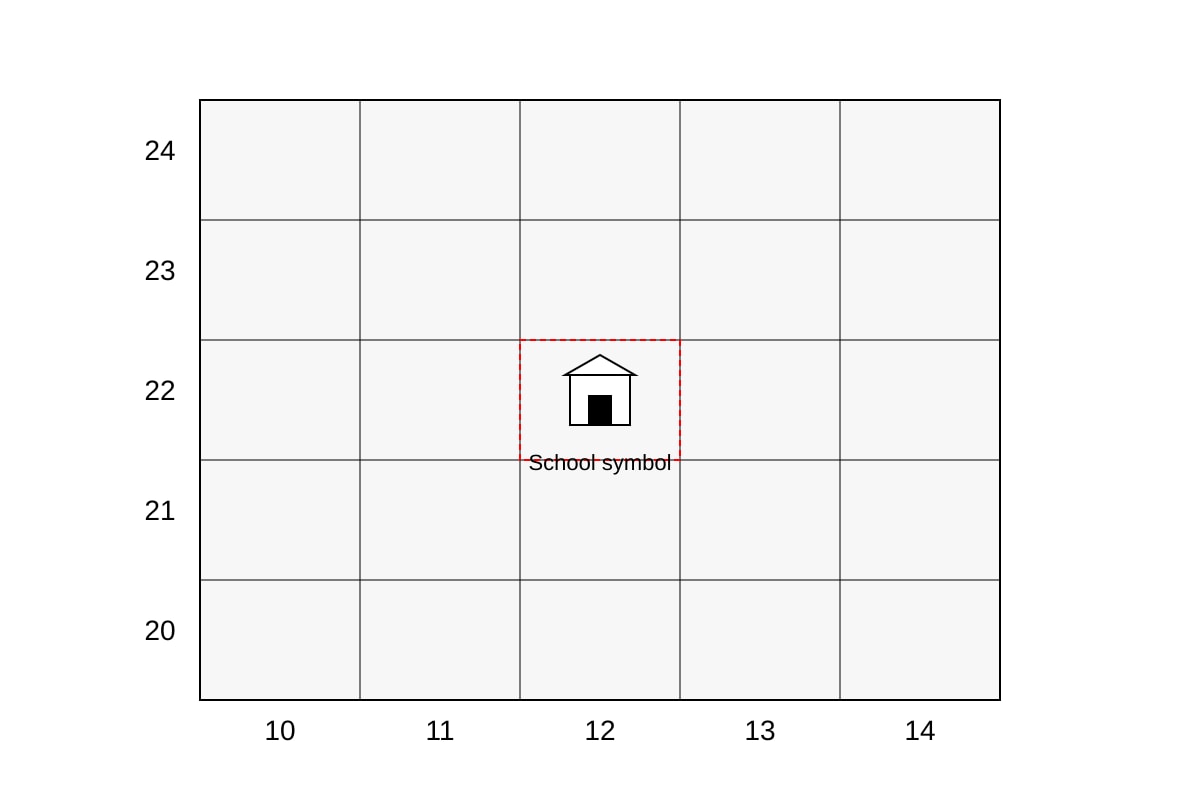
Q1. [1 mark]
Answer: 1222
Teaching note: Four-figure grid reference uses easting first (left-to-right = 12) then northing (bottom-to-top = 22). Common mistake: reversing to 2212.
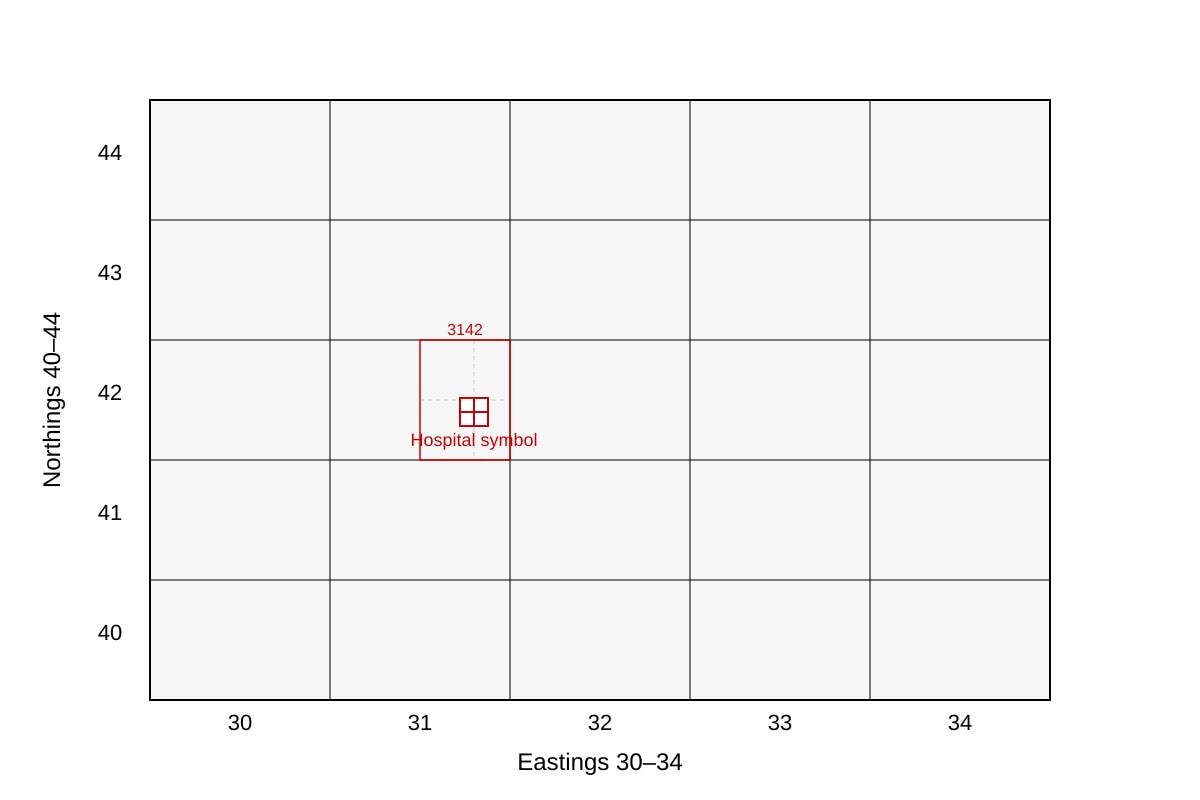
Q2. [2 marks]
Answer: 316424
Mark breakdown: 1 mark for base 3142, 1 mark for tenths (6 east, 4 north).
Teaching: Easting 31 + 6 tenths = 316; northing 42 + 4 tenths = 424.
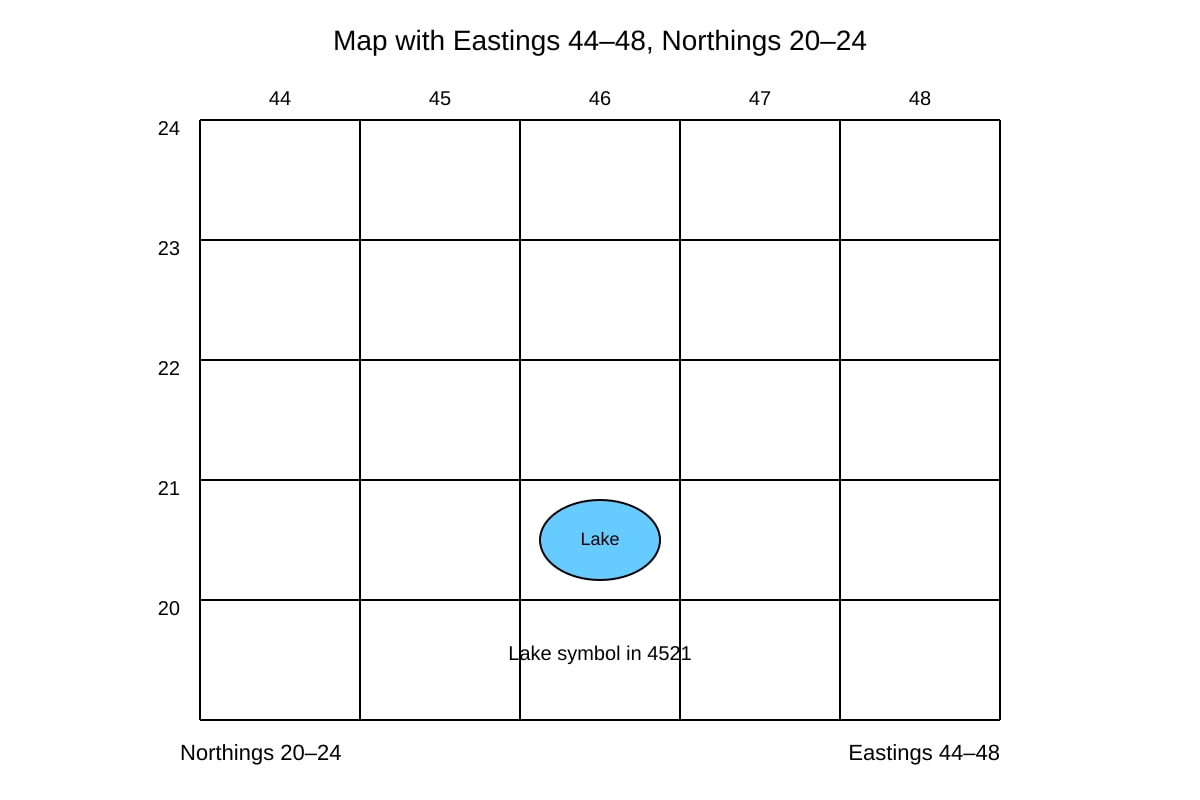
Q3. [1 mark]
Answer: Lake
Teaching: At GR 4521, the symbol is a lake. Read easting 45, northing 21.
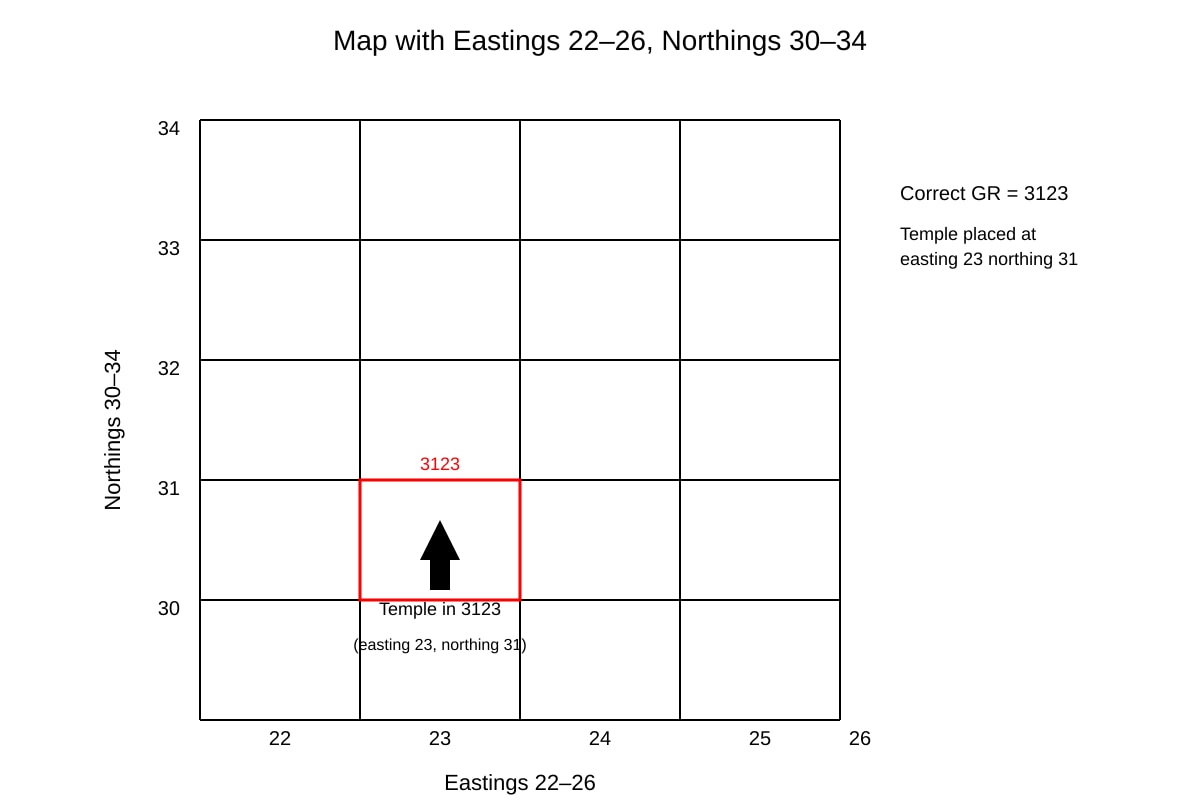
Q4. [1 mark]
Answer: Student reversed easting and northing; correct is 3123 (easting 23, northing 31).
Teaching: Grid ref always Easting-Northing (EN). Mistake was NE.
Q5. [2 marks]
Answer: (1) Exact location of a feature; (2) Relative position for navigation/planning.
Marking: 1 mark each.
Section B: Photograph and Data Interpretation (24 marks)
Q6. [3 marks]
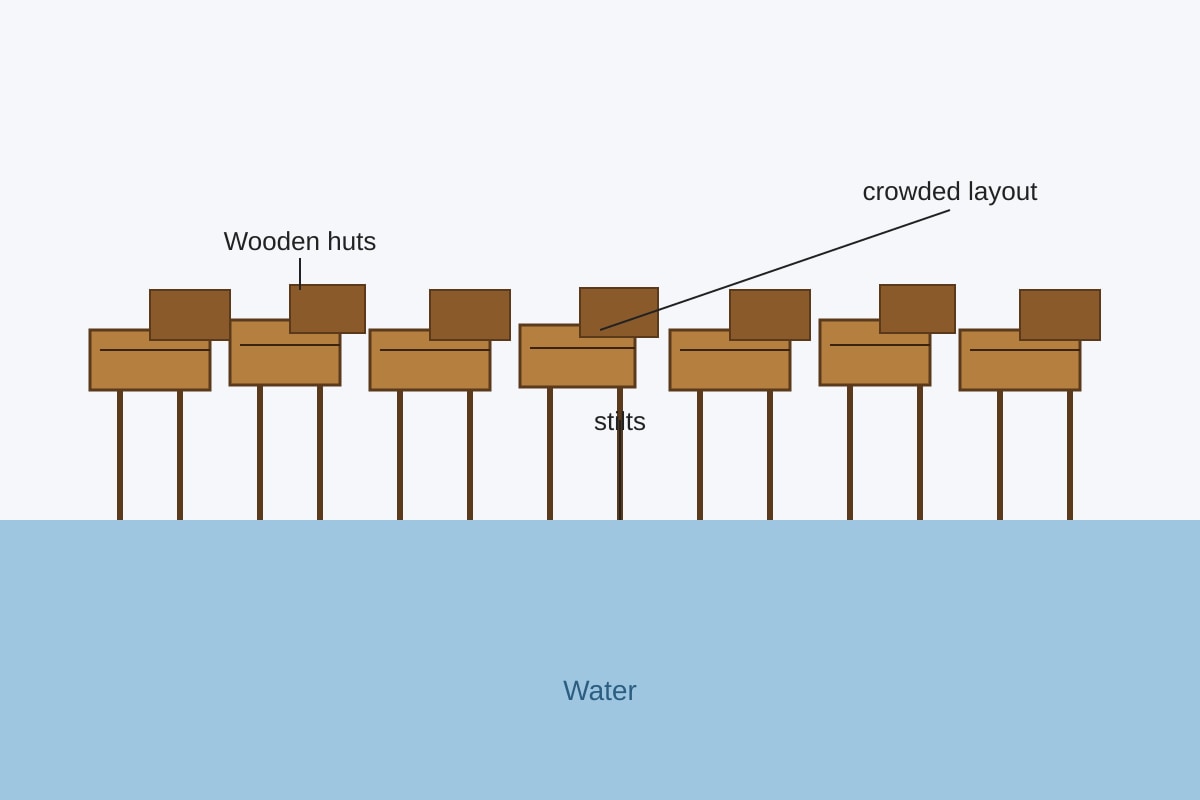
Answer: Characteristic: dense self-built wooden huts on stilts (1). Explanation: built on water due to lack of land / informal housing demand (2).
Teaching: Observation + reason linking to squatter settlement concept.
Q7. [3 marks]
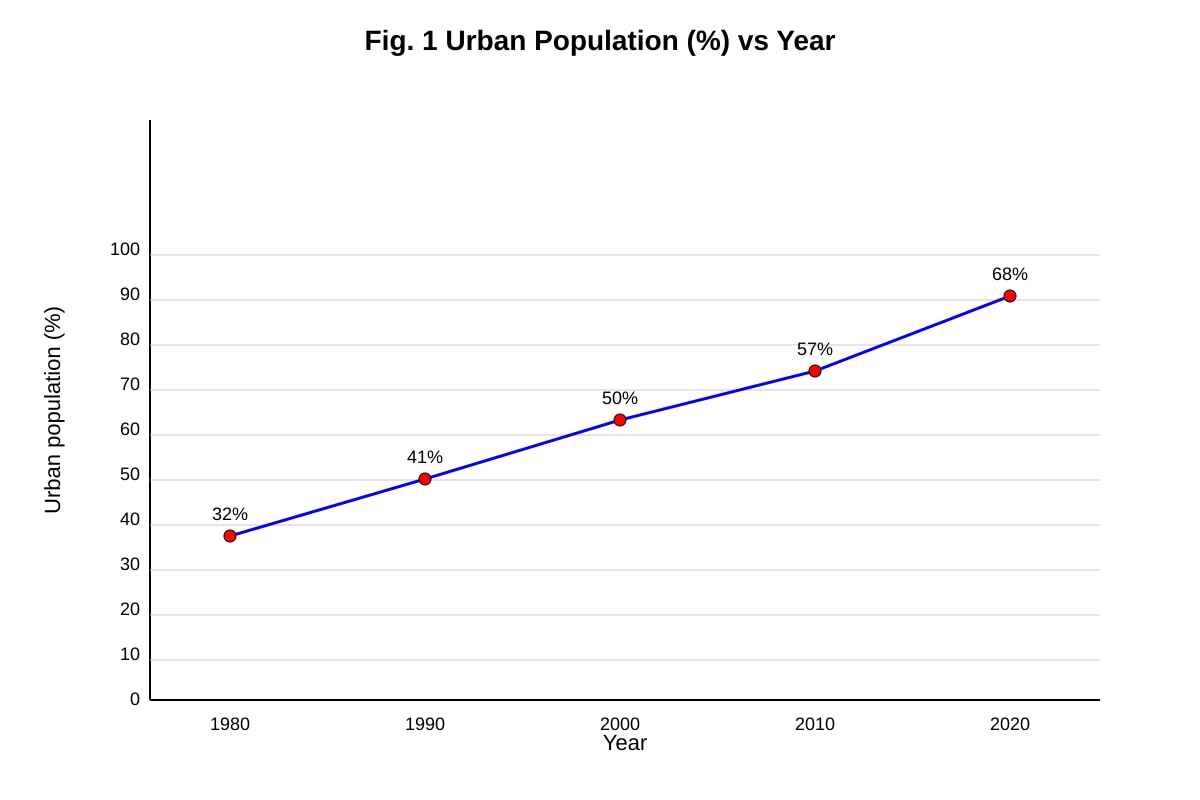
Answer: Urban population rose from 32% (1980) to 68% (2020) (1), gradual but steady increase (1), more than doubled (1).
Marking descriptors: trend + stats + rate.
Q8. [2 marks]
Working: Increase = 68 − 32 = 36 percentage points. % increase = (36/32)×100 = 112.5%.
Answer: 112.5%
Teaching: % change = (final−initial)/initial ×100.
Q9. [3 marks]
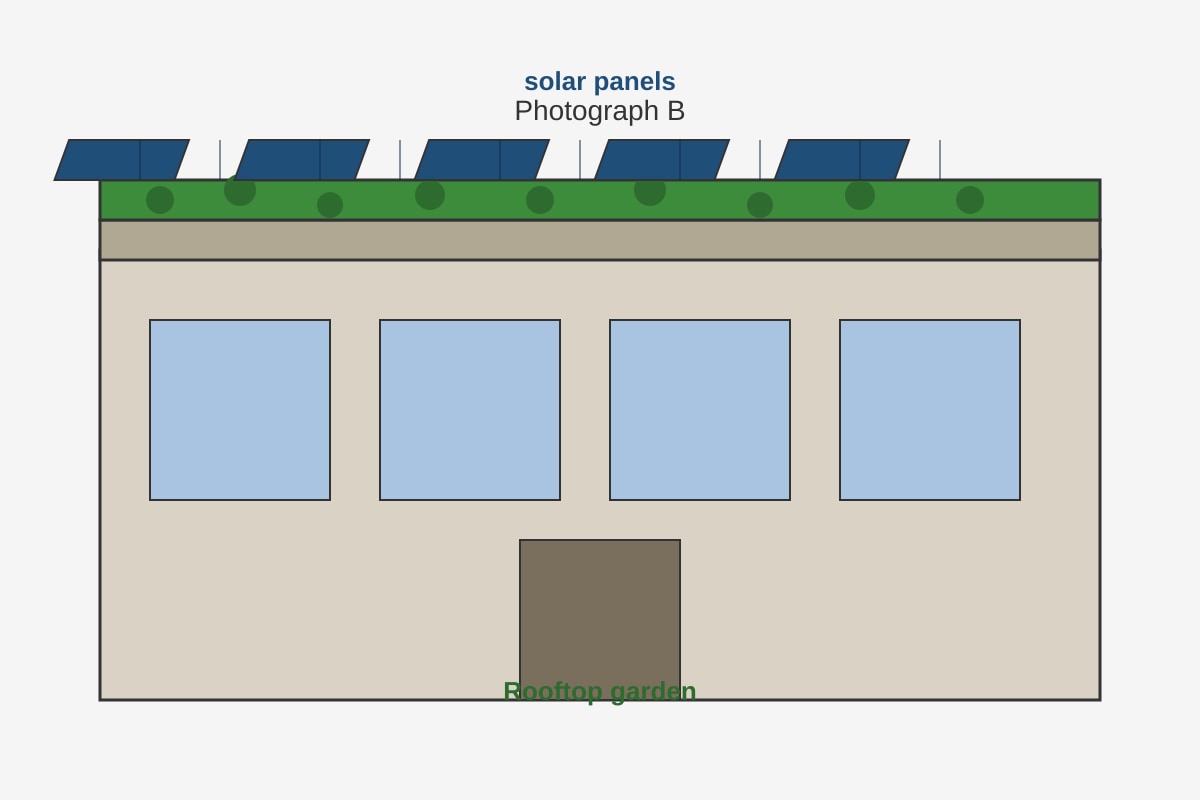
Answer: Rooftop garden + solar panels (1). Helps by cooling building (1) and generating clean energy (1).
Teaching: Green roof reduces heat; solar reduces fossil fuel use.
Q10. [2 marks]
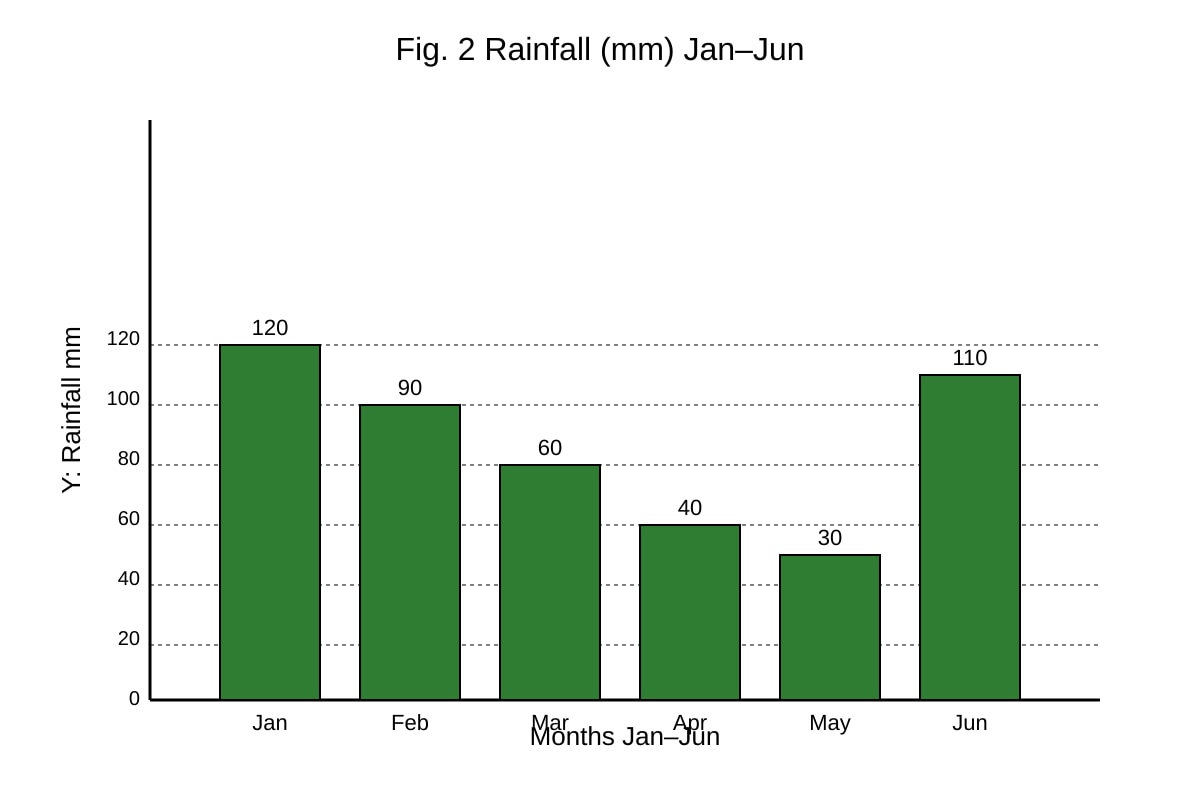
Answer: Wettest = Jan, 120 mm.
Teaching: Read tallest bar.
Q11. [3 marks]
Answer: Charges drivers entering congested zone (1) → fewer cars (1) → less traffic (1).
Teaching: Mechanism + outcome.
Q12. [2 marks]
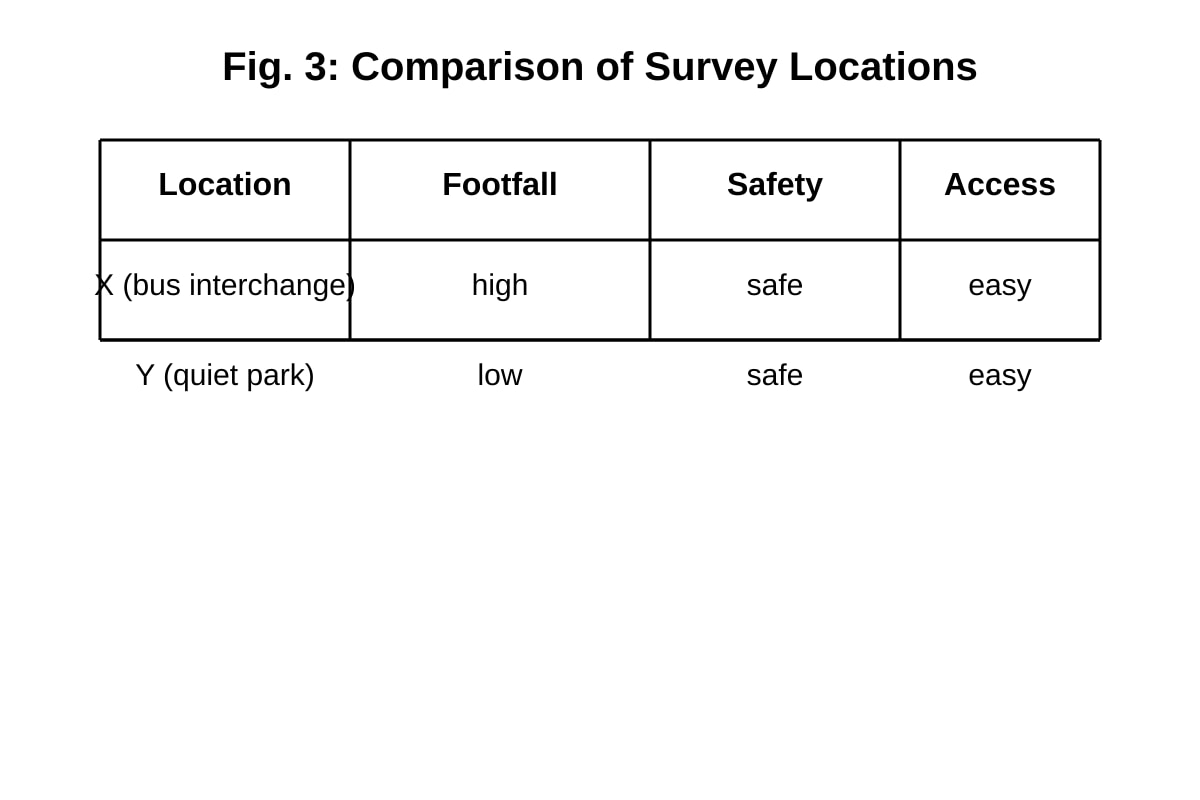
Answer: Location X (1) because high footfall gives more transport data (1).
Teaching: Representativeness for survey.
Q13. [3 marks]
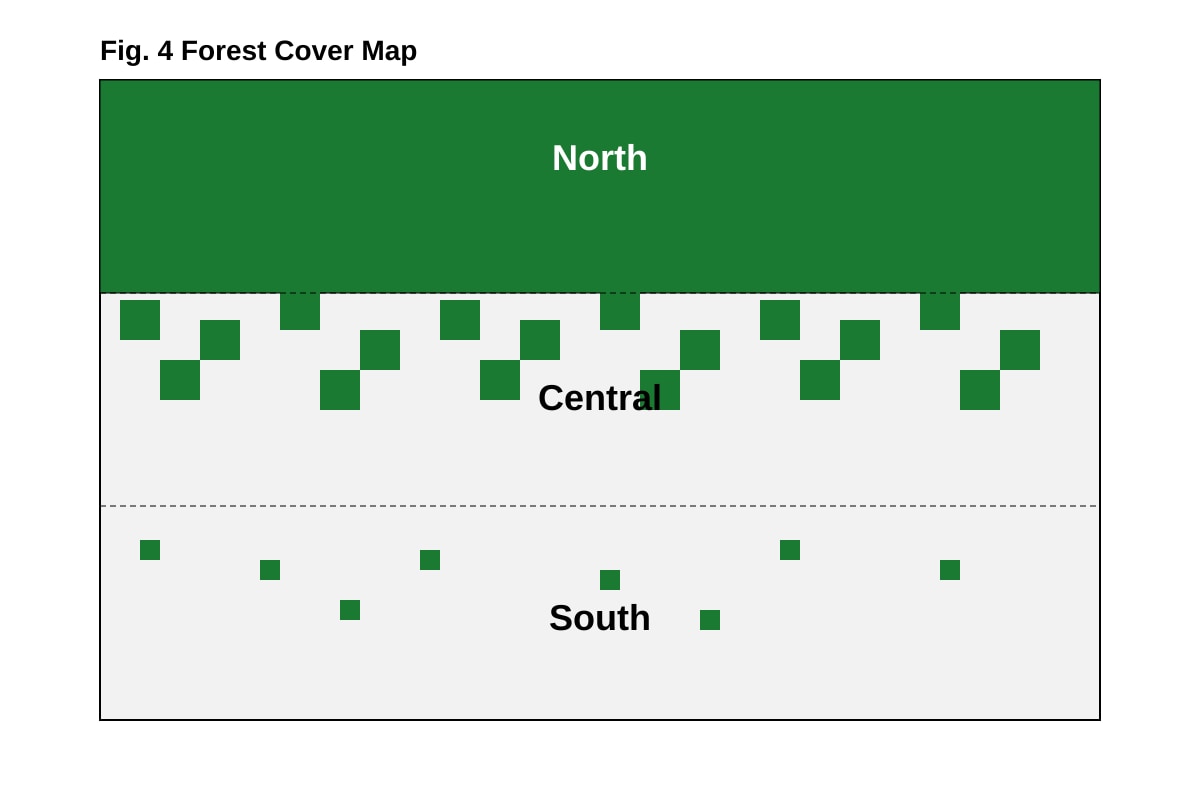
Answer: Dense in north (1), patchy central (1), sparse south (1).
Teaching: Describe spatial pattern by region.
Section C: Applied Graph and Evaluation Skills (24 marks)
Q14. [3 marks]
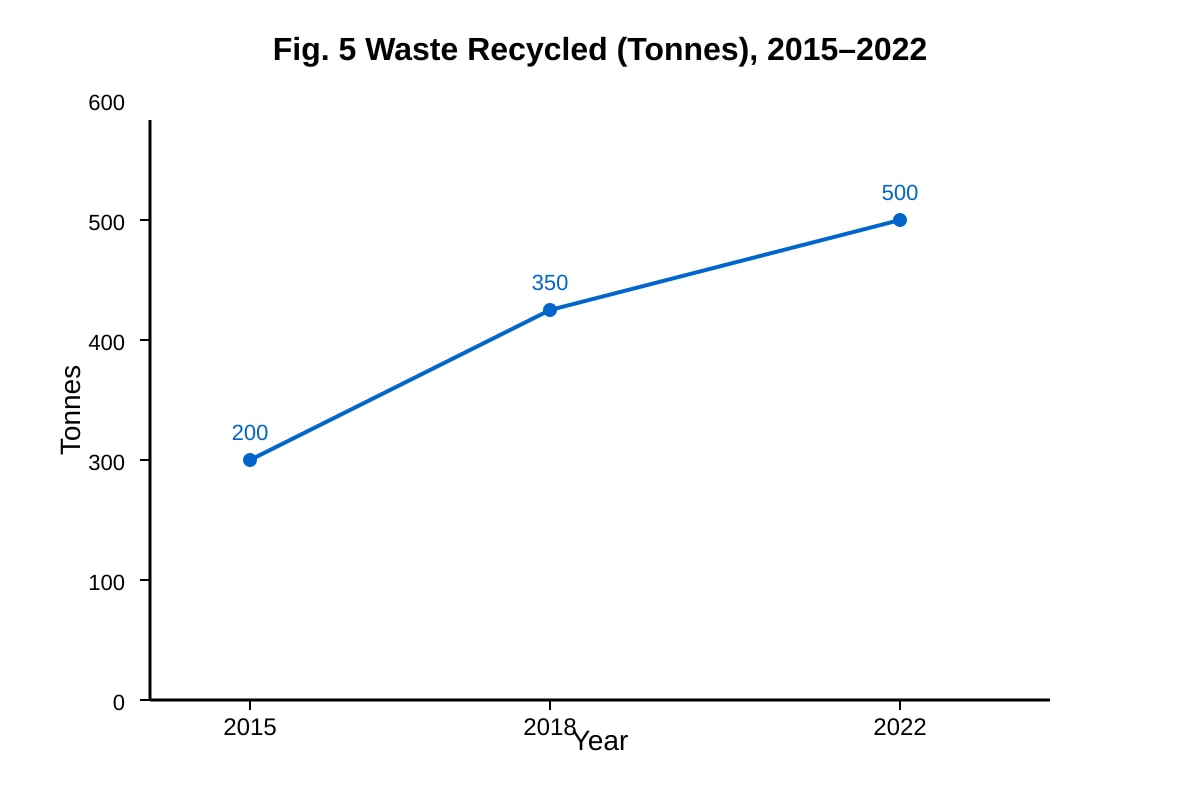
Answer: Increased from 200 to 500 tonnes (1), rise of 300 (1), steady growth (1).
Q15. [2 marks]
Working: (120+90+60)/3 = 270/3 = 90 mm.
Answer: 90 mm.
Q16. [3 marks]
Answer: Rooftop gardens cool and clean air (1); pricing cuts traffic (1); together lower emissions and improve liveability (1).
Q17. [2 marks]
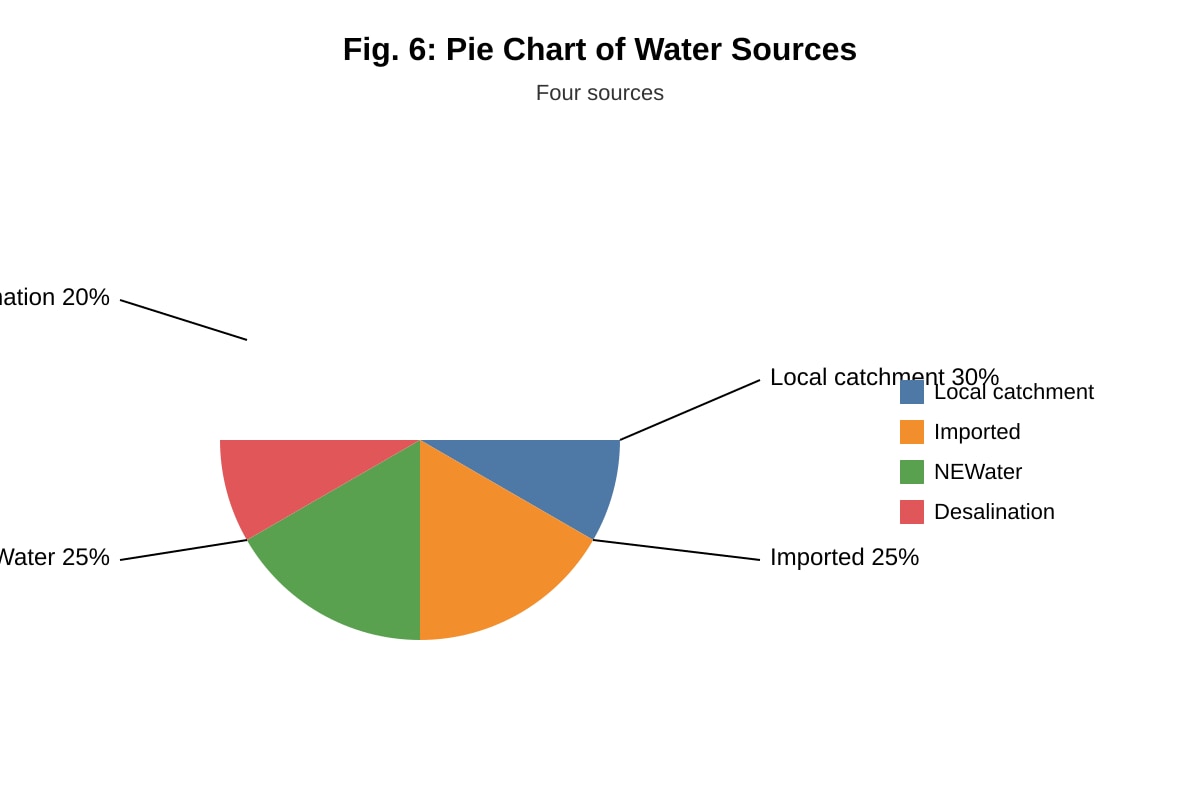
Answer: Local catchment, 30%.
Q18. [1 mark]
Answer: Wrong; 2415 means easting 24, northing 15.
Q19. [4 marks]
Answer: Rapid urban growth (Fig 1: 32→68%) (1) leads to informal housing (Photo A) (1) causing overcrowding (1) and poor services (1).
Marking: data link + challenge explained.
Q20. [4 marks]
Answer: Yes partially: recycling up 200→500t (1), but urban pop rising strains resources (1). Needs combined strategies (1). Conclusion with balance (1).
Marking descriptors: use both figures, evaluate, conclude.
End of Answer Key