From Real Exams Exam Paper
Secondary 2 Geography Semestral Assessment 2 (End of Year) Paper 4
Free Sec 2 Geography SA2 Paper 4, HY3 Exam version, with questions, answers, and syllabus-aligned practice for Singapore students.
These static practice materials are generated from the site's syllabus and paper-generation workflow, with source and model context shown so students and parents can evaluate the material before use.
Questions
TuitionGoWhere Exam Practice (AI) — Secondary 2 Geography SA2 Practice Paper
School: TuitionGoWhere Secondary School (AI)
Subject: Geography
Level: Secondary 2
Paper: SA2 Practice (Version 4 of 5)
Duration: 60 minutes
Total Marks: 60
Name: ___________________________
Class: ________
Date: ____________
Instructions:
- This paper contains 20 questions in three sections.
- Answer all questions in the spaces provided.
- Use the maps, graphs, photographs, and data provided to support your answers.
- Marks for each question are shown in brackets [ ].
Section A: Map and Photograph Interpretation (Questions 1–7) [21 marks]
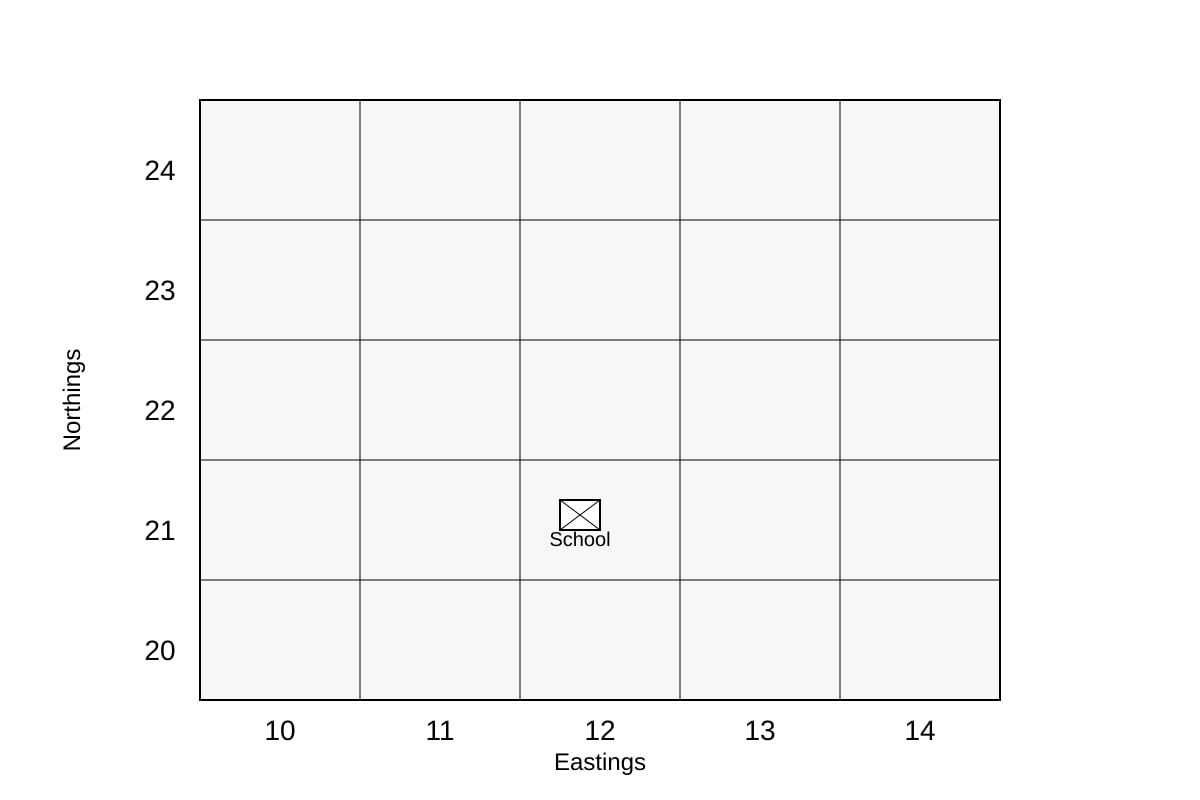
1. Study the map extract below. State the four-figure grid reference of the school. [1]
Image pending generation: map for Q1.
2. Study the map extract in Q1. State the four-figure grid reference of the reservoir shown in the north-east corner of the map. [1]
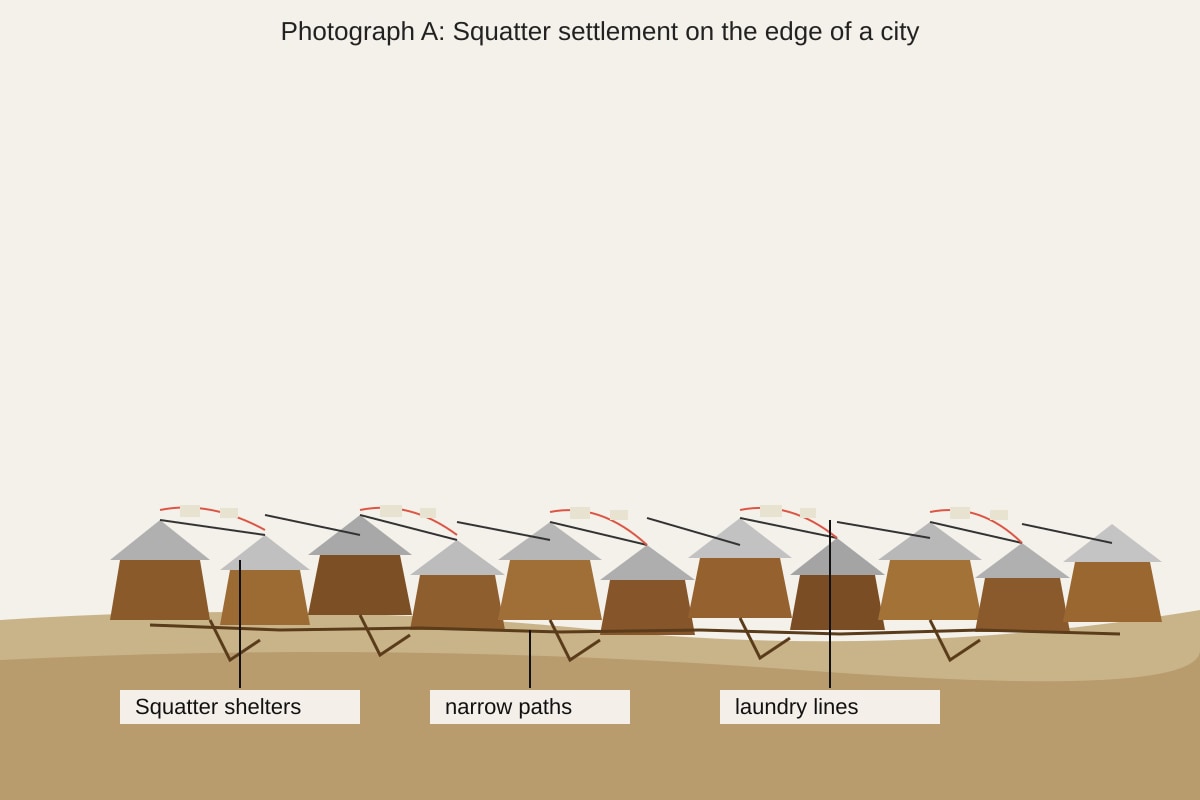
3. Study Photograph A below. It shows a squatter settlement on the edge of a city. Describe TWO visible characteristics of the housing. [2]
Image pending generation: source_image for Q3.
(a) _____________________________________________________
(b) _____________________________________________________
4. With reference to Photograph A in Q3, explain ONE problem that residents might face because of the housing conditions. [2]
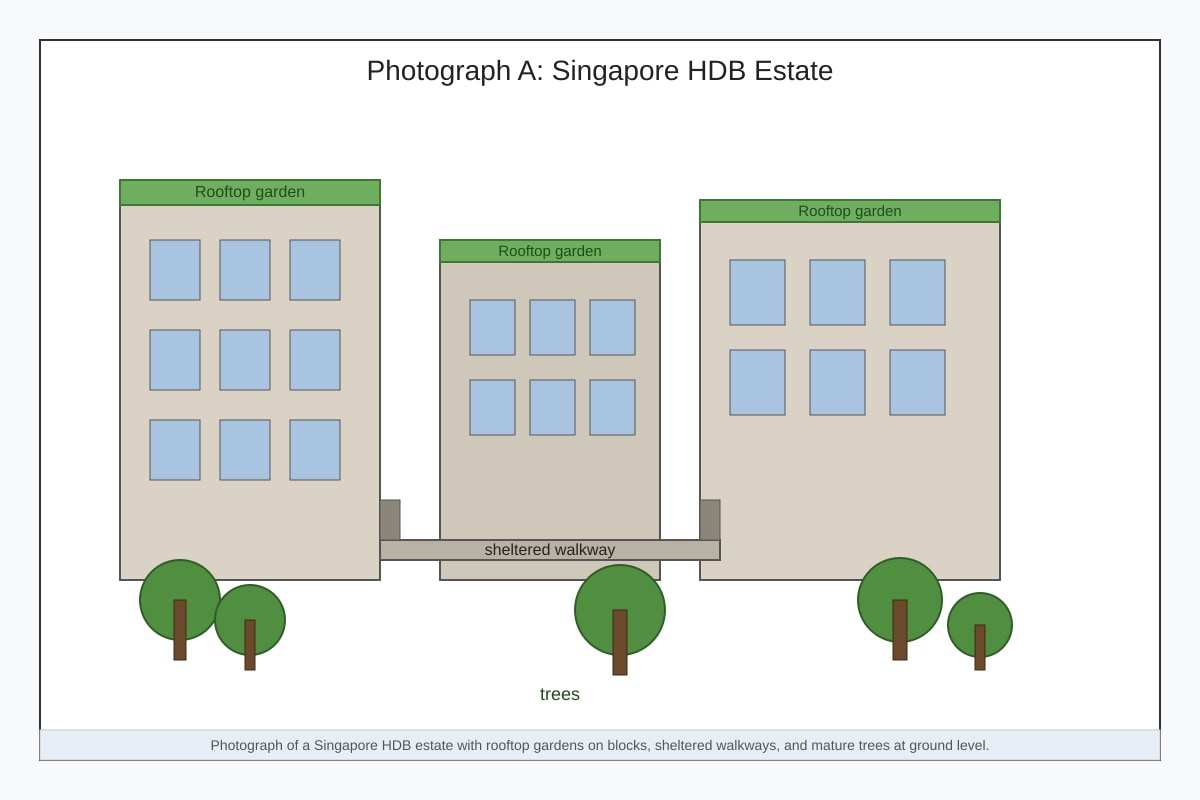
5. Study Photograph B below. It shows a high-rise public housing estate in Singapore. Describe ONE environmental design feature visible and explain how it helps sustainability. [3]
Image pending generation: source_image for Q5.
Description: _____________________________________________
Explanation: ____________________________________________
6. Study the map extract in Q1. Give the six-figure grid reference of the hospital located at the centre of grid square 1322. [2]
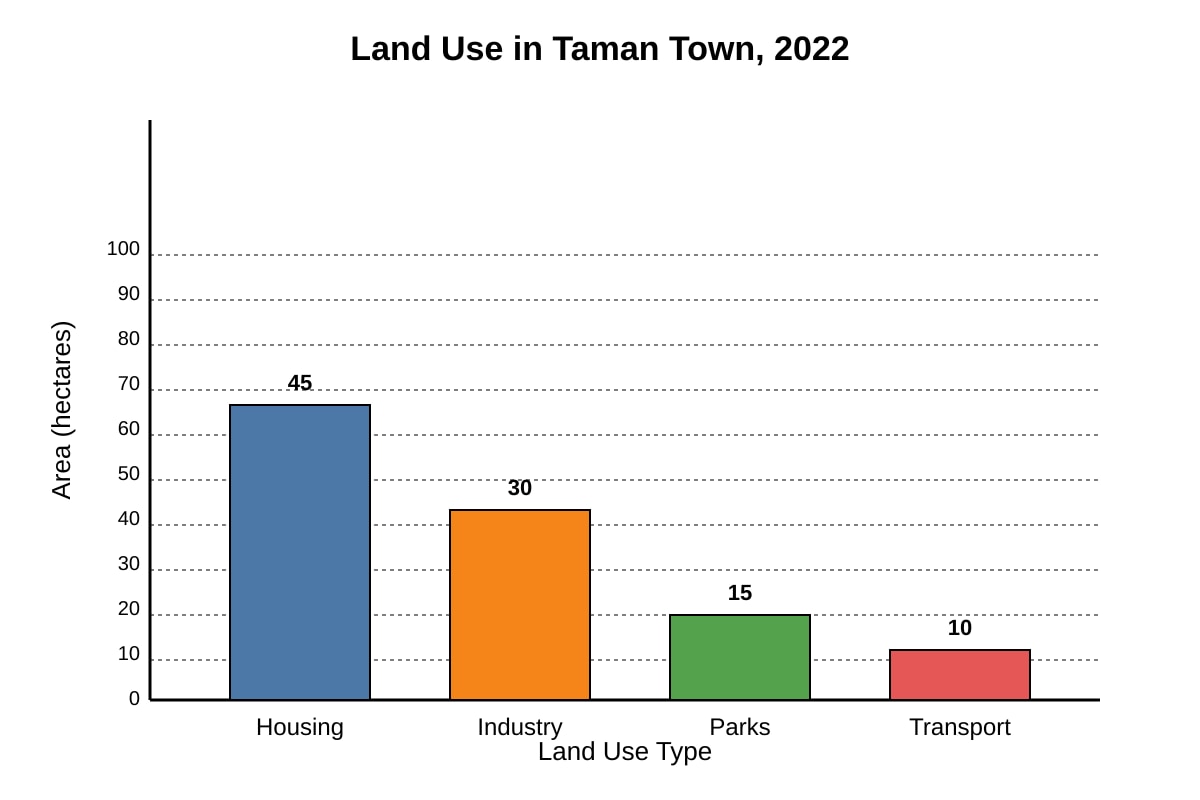
7. Study the bar graph below showing land use in a town. Which land use type occupies the largest area? [1]
Image pending generation: graph for Q7.
Section B: Graph and Data Interpretation (Questions 8–14) [24 marks]
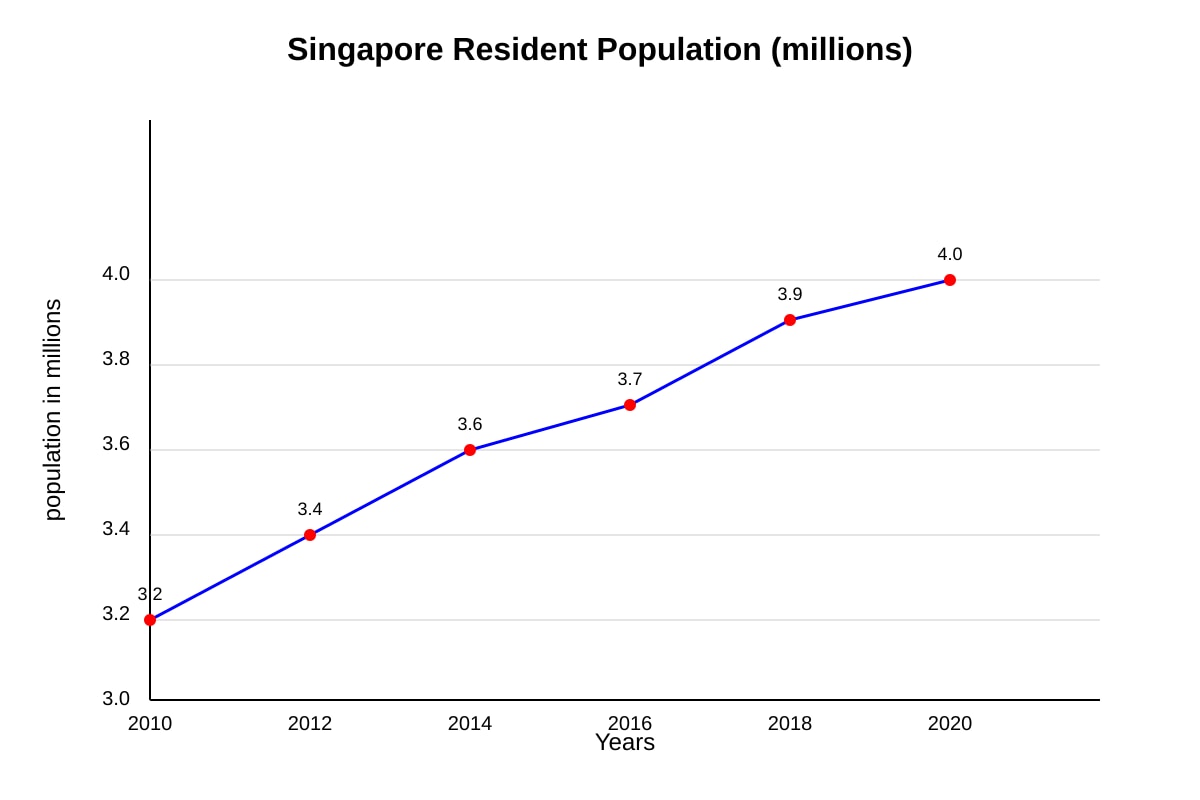
8. Study Fig. 1 below. Describe the trend in Singapore’s resident population from 2010 to 2020. Refer to statistics. [3]
Image pending generation: graph for Q8.
9. Using Fig. 1 in Q8, calculate the percentage increase in resident population from 2010 to 2020. Show your working. [2]
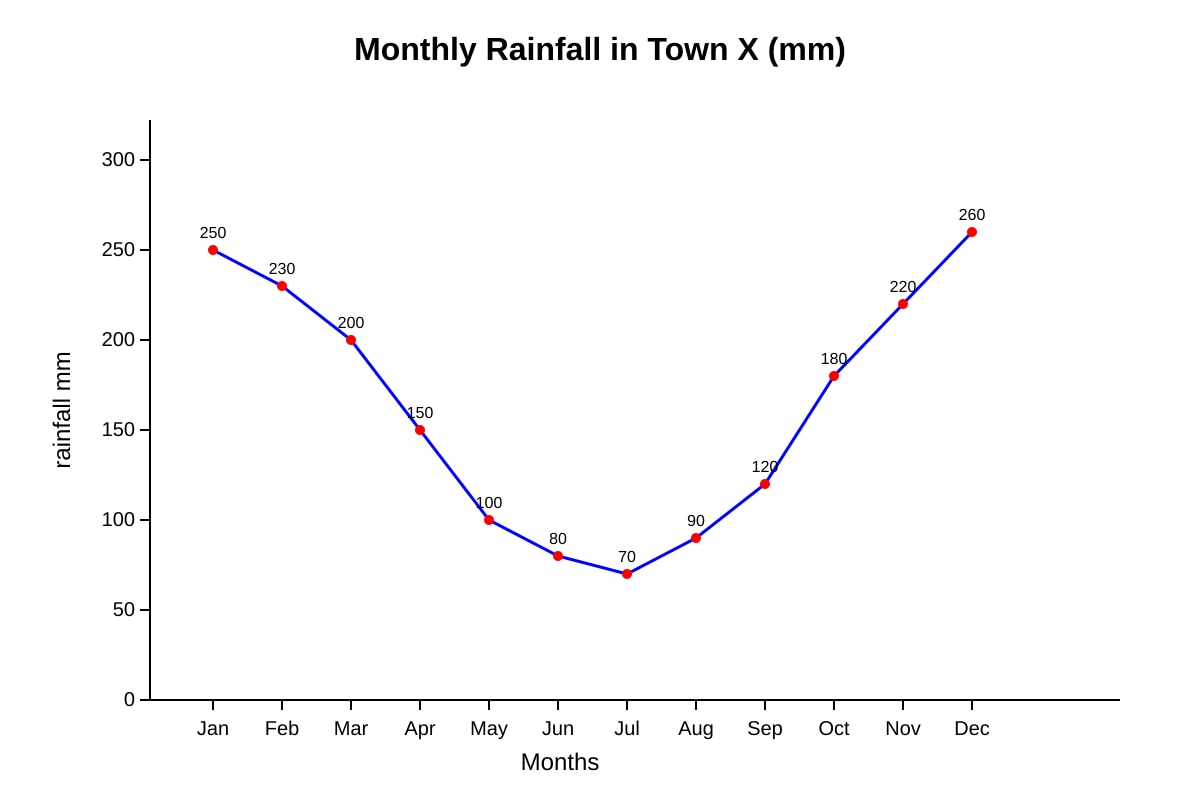
10. Study Fig. 2 below. Describe the distribution of rainfall in Town X over the year. [3]
Image pending generation: graph for Q10.
11. With reference to Fig. 2 in Q10, state the two wettest months and the two driest months. [2]
Wettest: _______________ Driest: _______________
12. Study the table below. Describe the change in forest cover in Country Y from 1990 to 2020. [3]
| Year | Forest cover (%) |
|---|---|
| 1990 | 65 |
| 2000 | 52 |
| 2010 | 40 |
| 2020 | 28 |
13. Using the table in Q12, calculate the total percentage point loss of forest cover between 1990 and 2020. [1]
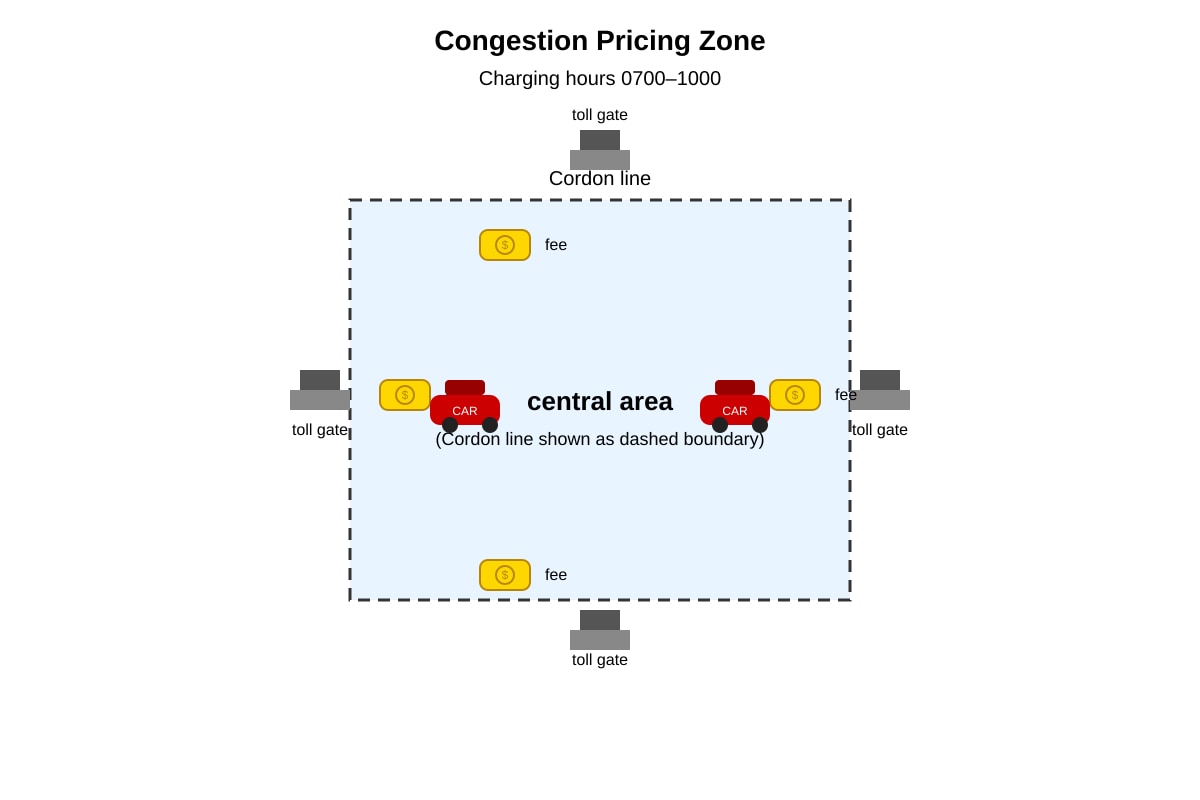
14. Study Fig. 3 below. Explain how the transport policy shown can help reduce congestion. [3]
Image pending generation: diagram for Q14.
Section C: Fieldwork and Integrated Skills (Questions 15–20) [15 marks]
15. A class wants to study pedestrian flow near two locations: a busy MRT station and a quiet park. Which location is more suitable for counting pedestrians at 8 am? Justify your choice. [2]
Location: __________________
Reason: ________________________________________________
16. Study the photograph in Q3 again. Suggest ONE method a geographer could use to collect data about the settlement. [1]
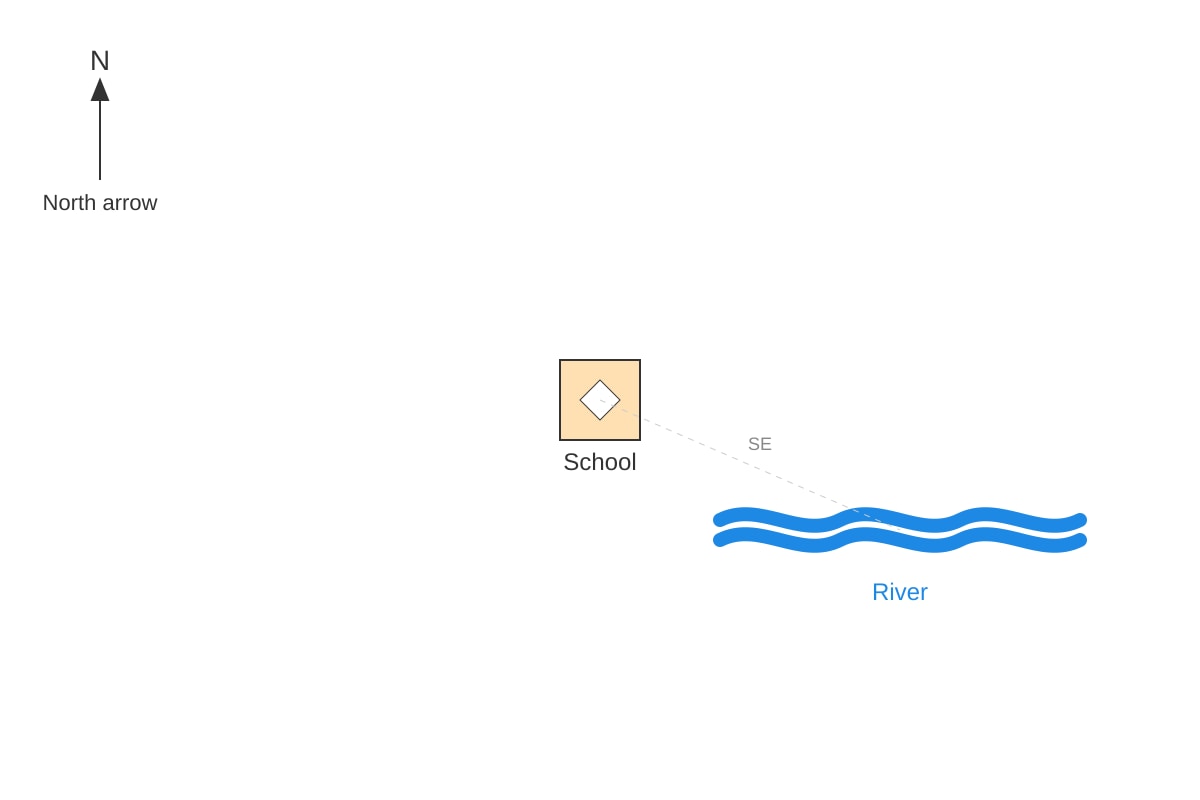
17. Study Fig. 4 below. State the compass direction of the river from the school. [1]
Image pending generation: map for Q17.
18. The students measured temperature at two sites: under trees (28°C) and in open field (34°C). Calculate the difference. [1]
19. Explain why the open field was hotter using the data from Q18. [2]
20. Study the bar graph in Q7. If the town plans to add 10 hectares of park, what will the new park area be? [2]
End of Paper
Answers
TuitionGoWhere Exam Practice (AI) — Secondary 2 Geography SA2 Practice Paper (Version 4) Answer Key
Total Marks: 60
Section A: 21 marks | Section B: 24 marks | Section C: 15 marks
Section A Answers (21 marks)
Q1 [1] Grid reference: 1221
- Teaching note: Four-figure grid reference uses easting (horizontal, read first) then northing (vertical). School is in square bounded by easting 12 and northing 21. Common mistake: writing northing first (2112).
Q2 [1] Grid reference: 1423 (assuming reservoir in NE corner square 14 easting, 23 northing)
- Teaching note: Read map: reservoir inside square easting 14, northing 23. Mark for correct order easting–northing.
Q3 [2] Two characteristics (1 mark each):
- (a) Houses are closely packed / dense cluster
- (b) Made of makeshift materials (wood, corrugated metal) / irregular narrow paths
- Teaching note: Observe photograph; do not infer cause here. Award for clear visible features.
Q4 [2] Example: Poor sanitation because there are no proper drains or roads (1 mark description + 1 mark problem link).
- Marking: 1 for stating condition (e.g., no proper roads), 1 for problem (flooding / disease risk).
Q5 [3] Description (1): Rooftop garden / sheltered walkways / trees. Explanation (2): Reduces heat / absorbs rainwater / provides shade → sustainability.
- Marking descriptor: 1 mark feature, 2 marks for explaining environmental benefit with link.
Q6 [2] Six-figure: 133222 (hospital at centre of 1322 → add 3 and 2 in tenths).
- Teaching note: Six-figure splits square into 10. Centre = +3 east, +2 north. Common error: 1322 only.
Q7 [1] Housing (45 hectares).
- Teaching note: Read tallest bar.
Section B Answers (24 marks)
Q8 [3] Trend: Resident population increased steadily from 3.2 million in 2010 to 4.0 million in 2020 (1). Rise of 0.8 million over 10 years (1). Generally upward with slight acceleration after 2016 (1).
- Marking: 1 trend, 1 stats, 1 rate/shape.
Q9 [2] Working: % increase = (4.0 − 3.2) / 3.2 × 100 = 0.8/3.2 × 100 = 25%.
- Answer: 25%. Show division and ×100.
Q10 [3] Rainfall high at start (Jan 250 mm) and end (Dec 260 mm), low mid-year (Jul 70 mm) (1). Bimodal pattern with two peaks (1). Dry season around May–Aug below 120 mm (1).
- Marking: 1 peaks, 1 trough, 1 pattern name.
Q11 [2] Wettest: January & December (1). Driest: July & August (1).
- From graph values.
Q12 [3] Forest cover fell from 65% (1990) to 28% (2020) (1). Dropped 37 percentage points (1). Steepest loss before 2010 (1).
- Marking: start/end, total drop, rate observation.
Q13 [1] 65 − 28 = 37 percentage points.
Q14 [3] Congestion pricing charges cars entering zone (1). Drivers avoid peak hours or use public transport (1). Fewer cars → less jam (1).
- Marking: mechanism + behaviour change + outcome.
Section C Answers (15 marks)
Q15 [2] Location: Busy MRT station (1). Reason: More pedestrians at 8 am for commute, better data (1).
Q16 [1] Method: Questionnaire / sketch map / photo survey.
Q17 [1] South-east (SE).
Q18 [1] 34 − 28 = 6°C.
Q19 [2] Open field 6°C hotter (1) because no tree shade, sun heats ground directly (1).
Q20 [2] Park original 15 ha + 10 ha = 25 hectares.
- Working shown for 1 mark, final answer 1 mark.
End of Answer Key
Free quiz and exam paper access
Enter your details to view this paper
Your access is remembered on this device.