From Real Exams Exam Paper
Secondary 2 Geography Semestral Assessment 2 (End of Year) Paper 3
Free Sec 2 Geography SA2 Paper 3, HY3 Exam version, with questions, answers, and syllabus-aligned practice for Singapore students.
These static practice materials are generated from the site's syllabus and paper-generation workflow, with source and model context shown so students and parents can evaluate the material before use.
Questions
TuitionGoWhere Practice Paper - Geography Secondary 2
TuitionGoWhere Secondary School (AI)
Subject: Geography
Level: Secondary 2
Paper: SA2 Practice Paper (Version 3 of 5)
Duration: 60 minutes
Total Marks: 60
Name: ___________________________
Class: _______
Date: ___________
Instructions:
- This paper contains 20 questions across three sections.
- Answer all questions in the spaces provided.
- Use the maps, graphs, and photographs provided to support your answers.
- Marks for each question are shown in brackets [ ].
- Section totals and question marks add up to 60.
Section A: Map and Grid Reference Skills (Questions 1–5) [15 marks]
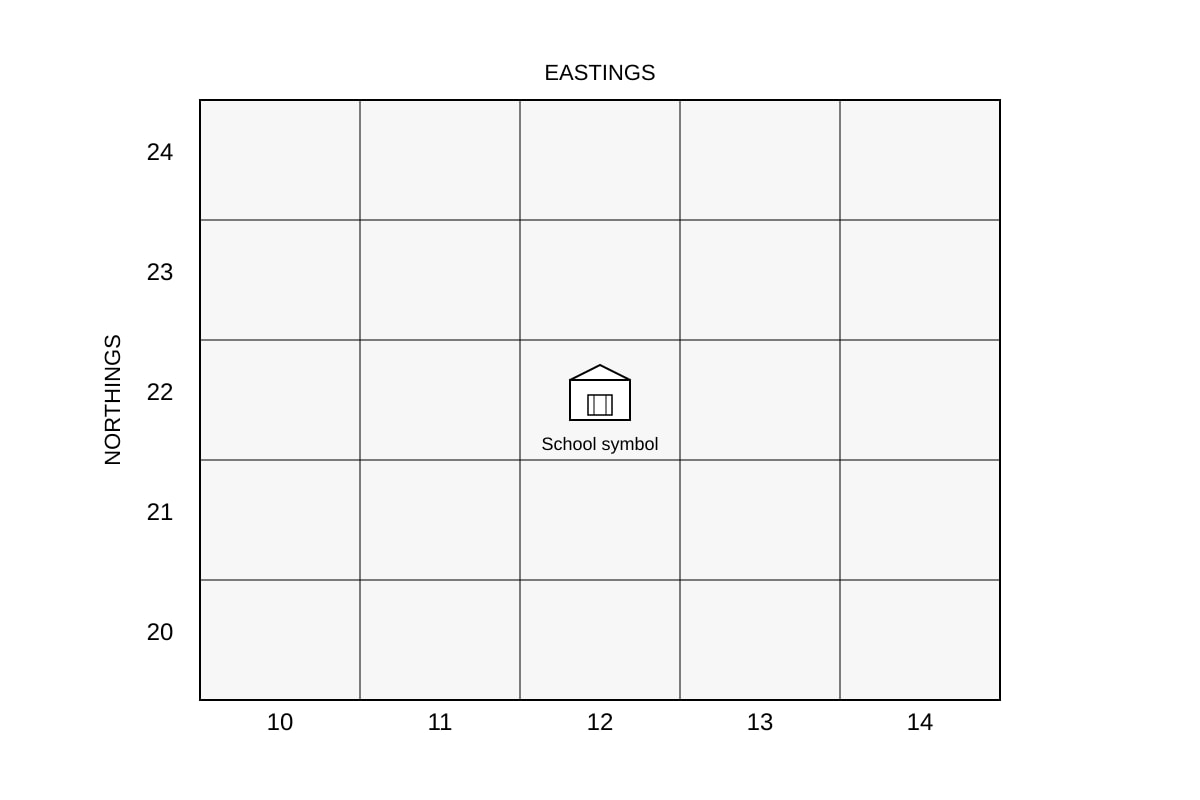
1. Study the map extract below. State the four-figure grid reference of the school. [1]
Image pending generation: map for Q1.
2. Give the four-figure grid reference of the reservoir shown on the map above. [1]
3. A student writes the grid reference of the hospital as 2314. Explain the mistake. [1]
4. State the six-figure grid reference of the market, which is located two-tenths across from the left of grid square 13/21 and three-tenths up from the bottom. [2]
5. Name two features you can identify using grid references on a map. [1 + 1]
(a) ___________________________________________________
(b) ___________________________________________________
Section B: Photograph and Data Interpretation (Questions 6–13) [24 marks]
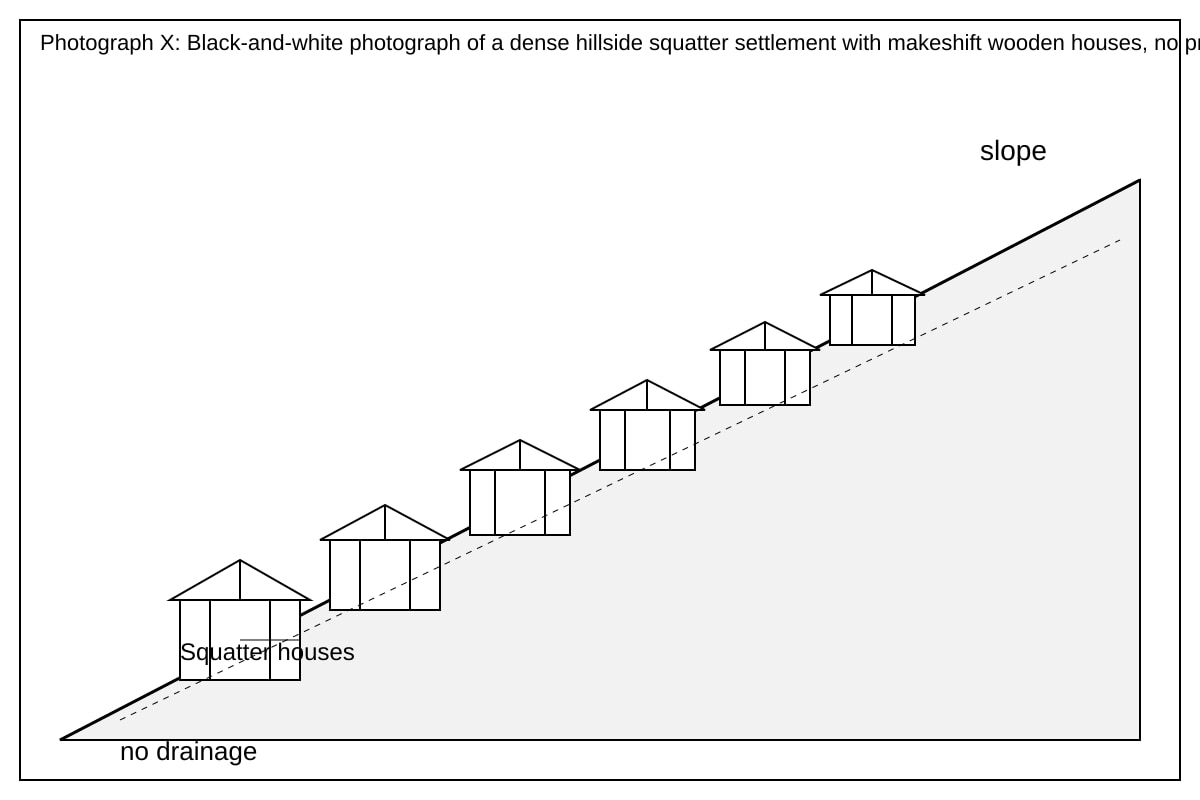
6. Study Photograph X below. It shows a squatter settlement on a hillside.
Image pending generation: source_image for Q6.
Describe one characteristic of the settlement and explain why it is unsustainable. [2 + 1]
Characteristic: __________________________________________
Explanation: _____________________________________________
7. Study Photograph Y showing a green rooftop garden on a city building.
Image pending generation: source_image for Q7.
Describe how this feature helps the environment. [2]
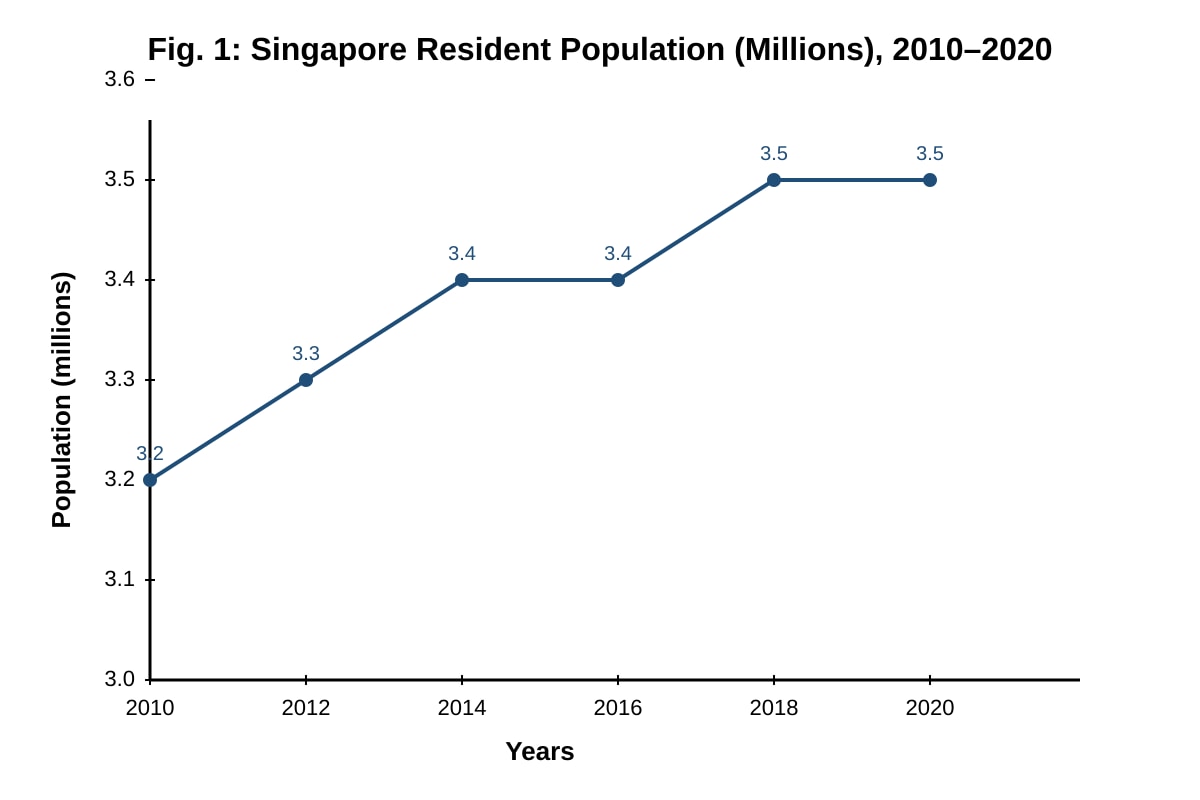
8. With reference to Fig. 1, describe the trend in Singapore's resident population from 2010 to 2020. Refer to statistics. [3]
Image pending generation: graph for Q8.
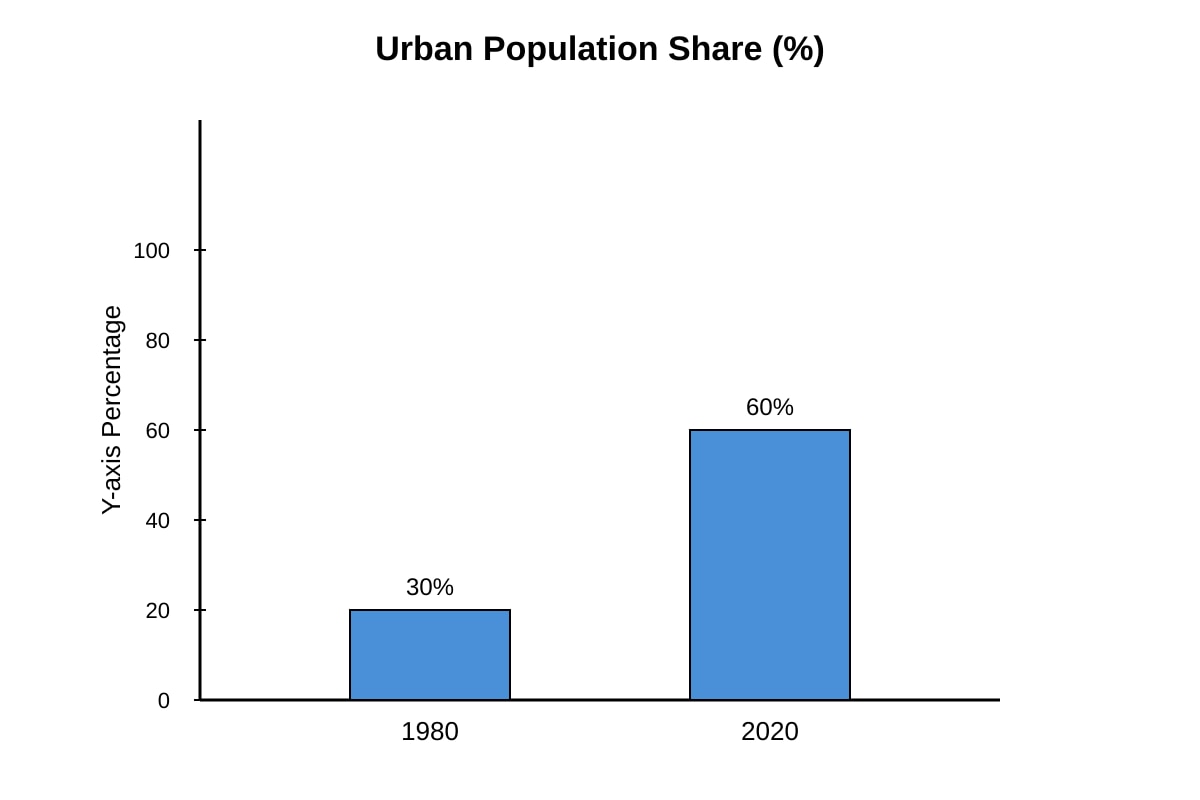
9. Using Fig. 2, calculate the percentage increase in urban population share from 1980 (30%) to 2020 (60%). Show your working. [2]
Image pending generation: chart for Q9.
Working: _______________________________________________
Answer: ________________________________________________
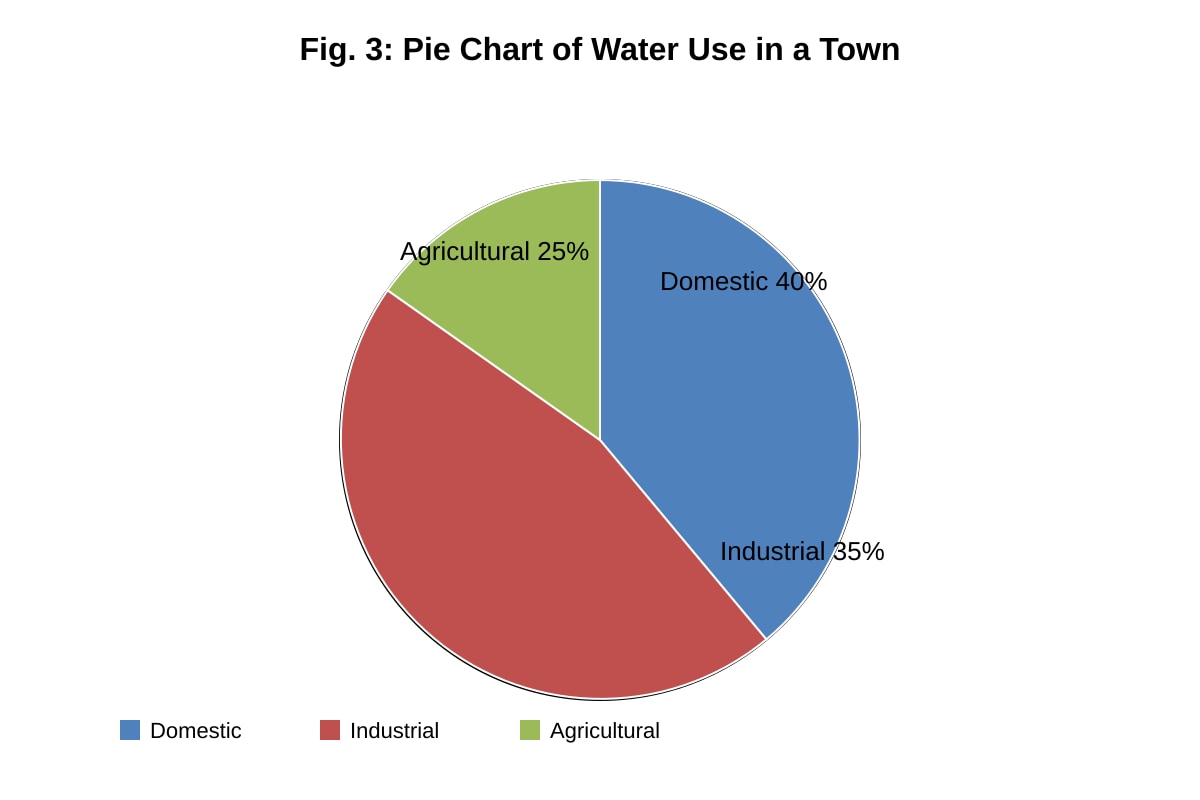
10. Study Fig. 3, a pie chart of water use in a town. Describe the distribution of water use. [2]
Image pending generation: chart for Q10.
11. Explain how congestion pricing can help reduce traffic congestion in a city. [3]
12. A fieldwork group wants to survey pedestrians. Location A is a busy mall; Location B is a quiet storeroom. Which is more suitable? Justify. [1 + 1]
Choice: _________________________________________________
Justification: ____________________________________________
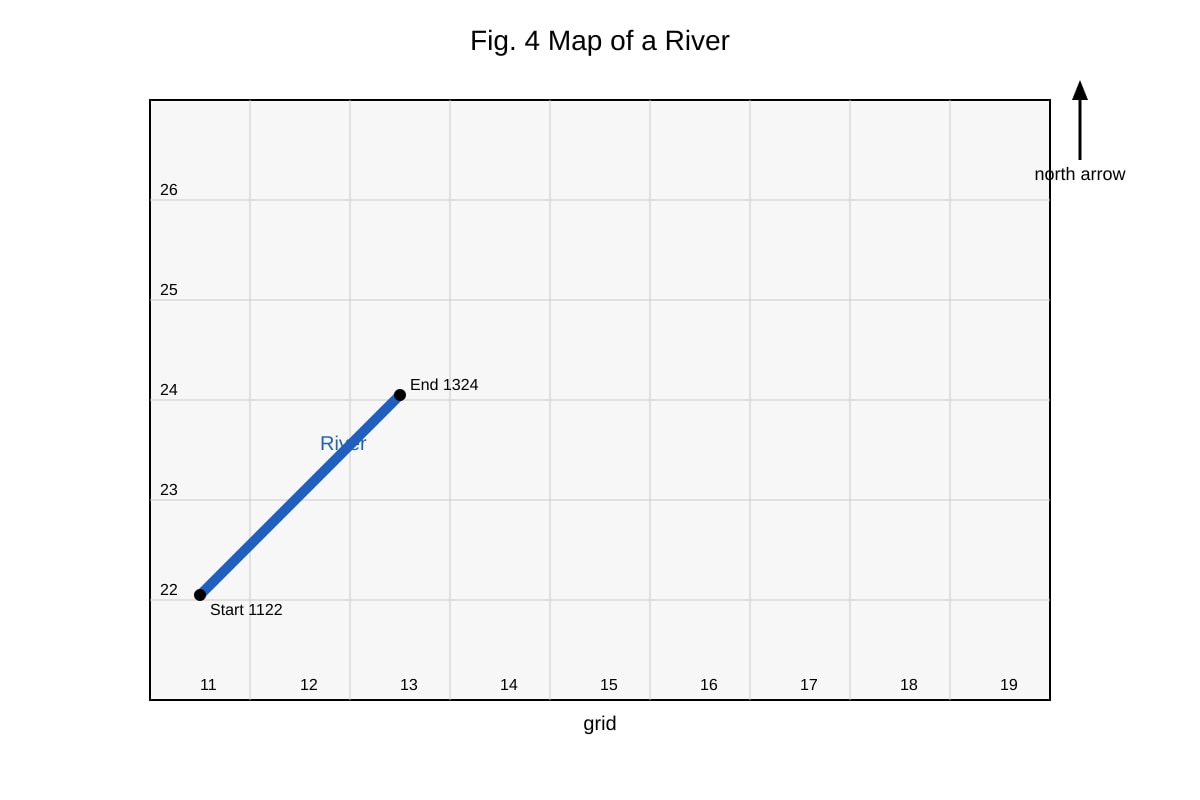
13. Study Fig. 4 map of a river. State the direction the river flows from grid 11/22 to 13/24. [1]
Image pending generation: map for Q13.
Section C: Integrated Skills (Questions 14–20) [21 marks]
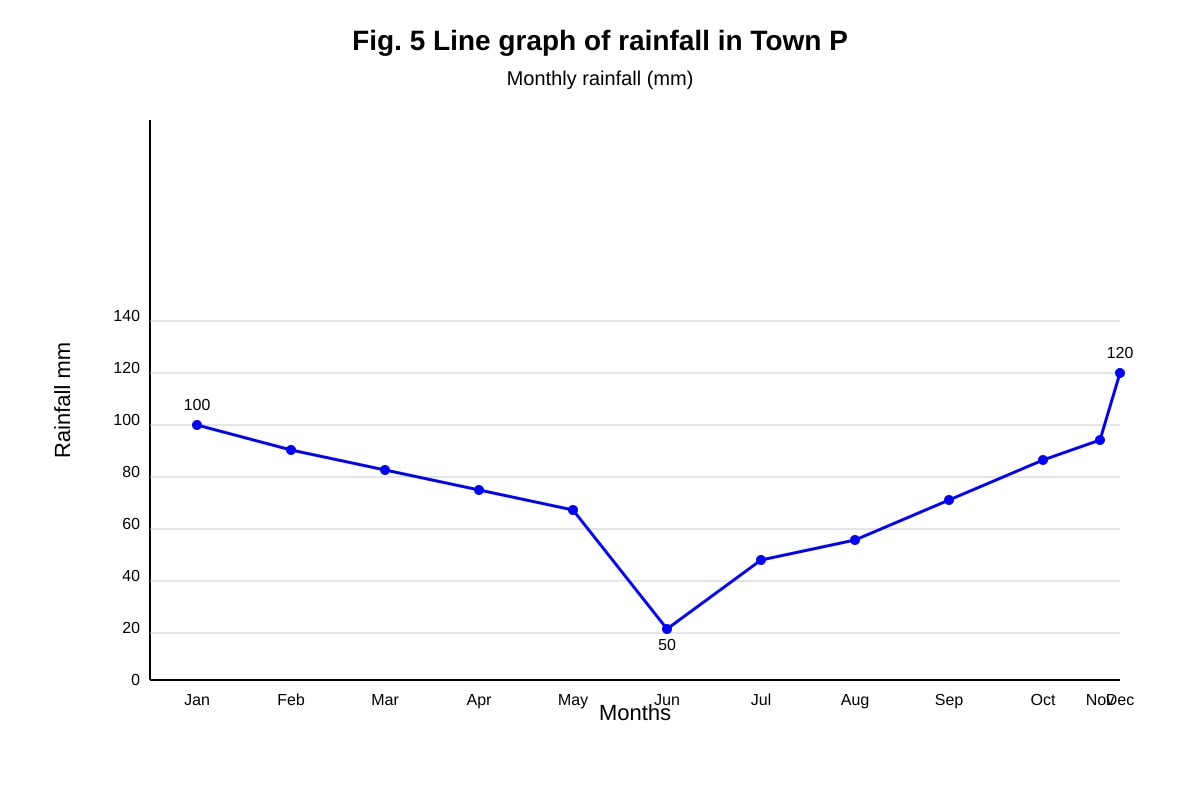
14. Study Fig. 5 line graph of rainfall (mm) in Town P: Jan 100, Jun 50, Dec 120.
Image pending generation: graph for Q14.
Describe the rainfall pattern. [2]
15. Using the graph, calculate the difference between highest and lowest monthly rainfall. [1]
16. Explain why a city might use rooftop gardens based on Photograph Y and your knowledge. [3]
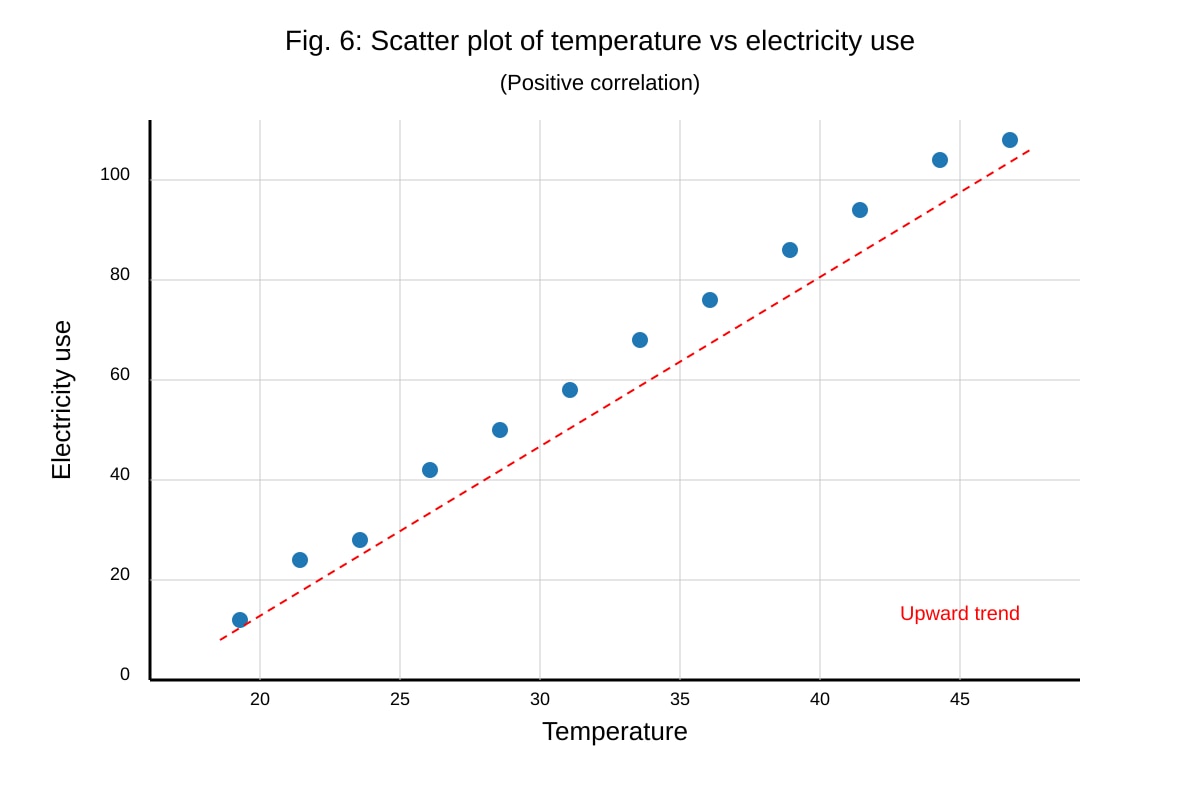
17. Study Fig. 6, scatter plot of temperature vs electricity use (positive trend).
Image pending generation: graph for Q17.
Describe the relationship. [2]
18. A student says grid reference 1422 means northing 14, easting 22. Correct him. [1]
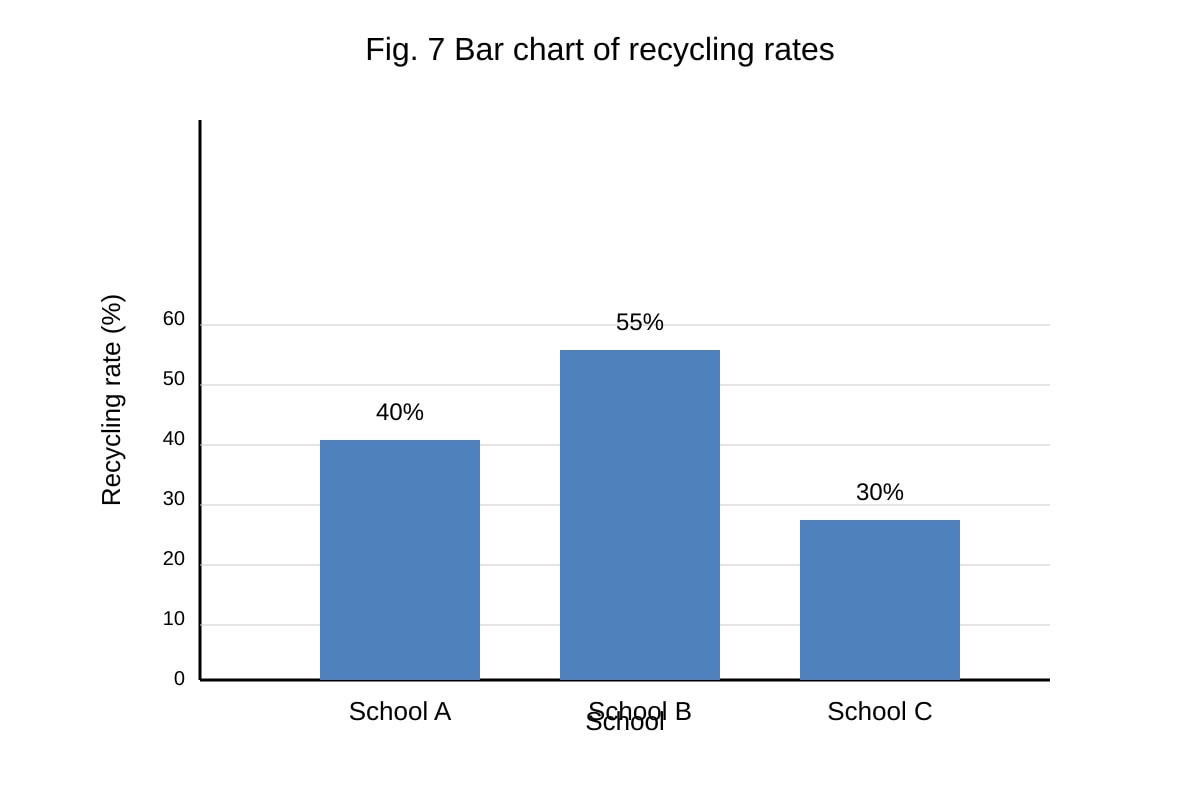
19. With reference to Fig. 7 bar chart of recycling rates (School A 40%, B 55%, C 30%), describe differences. [2]
Image pending generation: chart for Q19.
20. Explain how slum upgrading can improve living conditions. [3]
Answers
TuitionGoWhere Practice Paper - Geography Secondary 2 (Version 3) Answer Key
Total Marks: 60
Section A (15 marks)
Q1 [1] Grid reference of school: 1222
Teaching note: Read easting (left-right) first = 12, then northing (bottom-top) = 22. Four-figure uses grid lines below/left of feature.
Q2 [1] Reservoir: 1323 (based on placeholder showing it in that square)
Teaching note: Apply same easting-then-northing rule.
Q3 [1] Mistake: Student reversed order — wrote northing 23 then easting 14. Correct is easting first (14) then northing (23) = 1423 if that was the feature.
Teaching note: Common trap is northing-first; always E then N.
Q4 [2] Six-figure: 132 213
Working: Grid 13/21. Two-tenths east = 13 + 0.2 = 13.2 → 132. Three-tenths north = 21 + 0.3 = 21.3 → 213.
Teaching note: Six-figure splits square into 10; write 3 digits each.
Q5 [1+1] Two features: (a) school (b) reservoir / hospital / market (any 2 from map)
Teaching note: Grid refs locate any mapped symbol.
Section B (24 marks)
Q6 [2+1] Characteristic: Dense self-built wooden houses on steep slope. [2] Explanation: Unsustainable because steep slopes risk landslides and no proper drainage causes pollution. [1]
Marking: 2 for description, 1 for link to unsustainability.
Q7 [2] Rooftop garden reduces heat (insulation), absorbs rainwater, provides greenery. [2]
Marking: 2 marks for two clear environmental helps (e.g. cooling, water absorption).
Q8 [3] Trend: Resident population increased steadily from 3.2 million in 2010 to 3.5 million in 2020. [1] Rise of 0.3 million over 10 years. [1] Gradual and stable growth. [1]
Marking: 3 marks for overall trend + stats + rate.
Q9 [2] Working: % increase = (60−30)/30 × 100 = 100%. [1] Answer: 100%. [1]
Teaching note: Formula (new−old)/old ×100.
Q10 [2] Distribution: Domestic largest (40%), Industrial 35%, Agricultural smallest 25%. [2]
Marking: 2 for describing all three shares.
Q11 [3] Congestion pricing charges drivers entering busy areas. [1] This discourages unnecessary trips. [1] Reduces number of cars, thus less jam. [1]
Marking: 3 for mechanism + result links.
Q12 [1+1] Choice: A. [1] Justify: More pedestrians to survey, representative. [1]
Q13 [1] Direction: North-east (from 11/22 to 13/24, up-right). [1]
Section C (21 marks)
Q14 [2] Pattern: Higher in Dec (120mm), lower in Jun (50mm); uneven across year. [2]
Q15 [1] Difference: 120 − 50 = 70mm. [1]
Q16 [3] Rooftop gardens cool buildings (less AC), absorb rain (less flood), improve air. [3] Link to photo Y.
Q17 [2] Relationship: Positive correlation — as temperature rises, electricity use increases. [2]
Q18 [1] Correction: 14 is easting, 22 is northing; order is E then N. [1]
Q19 [2] Differences: B highest (55%), A 40%, C lowest 30%; B recycles most. [2]
Q20 [3] Slum upgrading provides proper housing, water, sanitation. [1] Improves health. [1] Reduces fire/pollution risk. [1]
Free quiz and exam paper access
Enter your details to view this paper
Your access is remembered on this device.