From Real Exams Exam Paper
Secondary 2 Geography Semestral Assessment 2 (End of Year) Paper 2
Free Sec 2 Geography SA2 Paper 2, HY3 Exam version, with questions, answers, and syllabus-aligned practice for Singapore students.
These static practice materials are generated from the site's syllabus and paper-generation workflow, with source and model context shown so students and parents can evaluate the material before use.
Questions
Free quiz and exam paper access
Enter your details to view this paper
Your access is remembered on this device.
Answers
TuitionGoWhere Exam Practice (AI) — SA2 Geography Secondary 2 (Version 2) Answer Key
Total Marks: 60
Section A: Map and Grid Skills (10 marks)
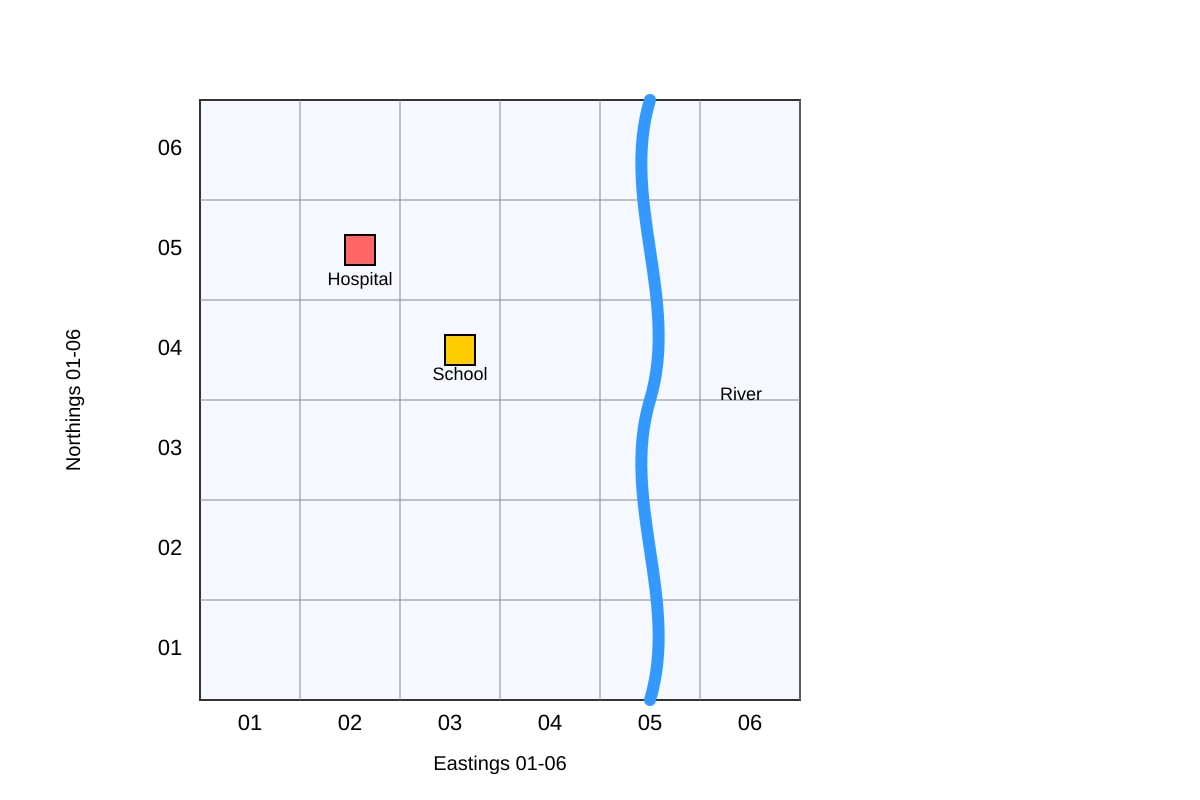
Q1 [1 mark]
- Answer: 03 04 (easting 03, northing 04 — the square containing the school).
- Teaching note: Four-figure grid reference uses the bottom-left corner of the square. Easting (horizontal) is given first, then northing (vertical). Common mistake: writing northing first (04 03).
Q2 [2 marks]
- Answer: 02 05 becomes six-figure as 025 055 (hospital at easting 02–03, northing 05–06; centre estimated at 5/10 within square).
- Mark breakdown: 1 mark for correct easting 025, 1 mark for correct northing 055.
- Teaching note: Divide the grid square into 10 parts. Hospital sits halfway → 5. Always easting then northing.
Q3 [2 marks]
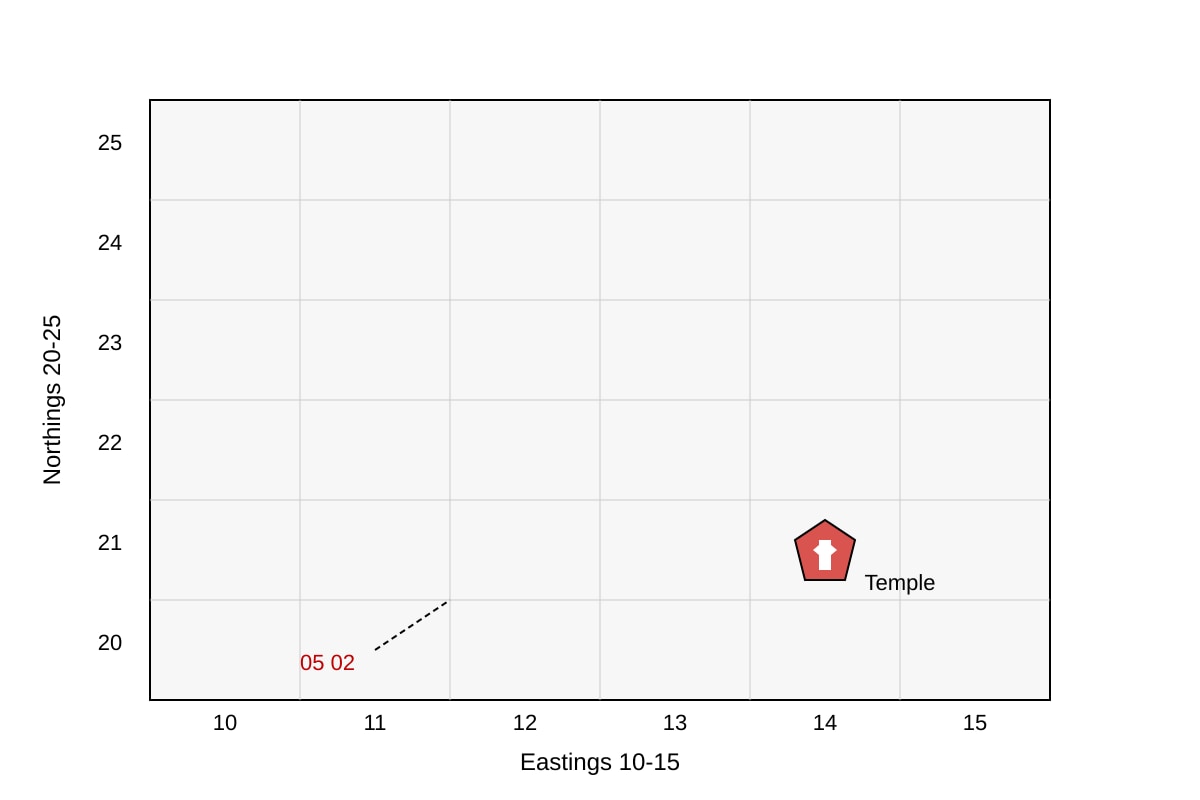
- Answer: Incorrect. Correct four-figure reference is 14 20.
- Mark breakdown: 1 mark for stating wrong, 1 mark for correct reference.
- Teaching note: Temple is in square easting 14–15, northing 20–21 → 14 20. Student confused with unrelated 05 02 note.
Q4 [2 marks]
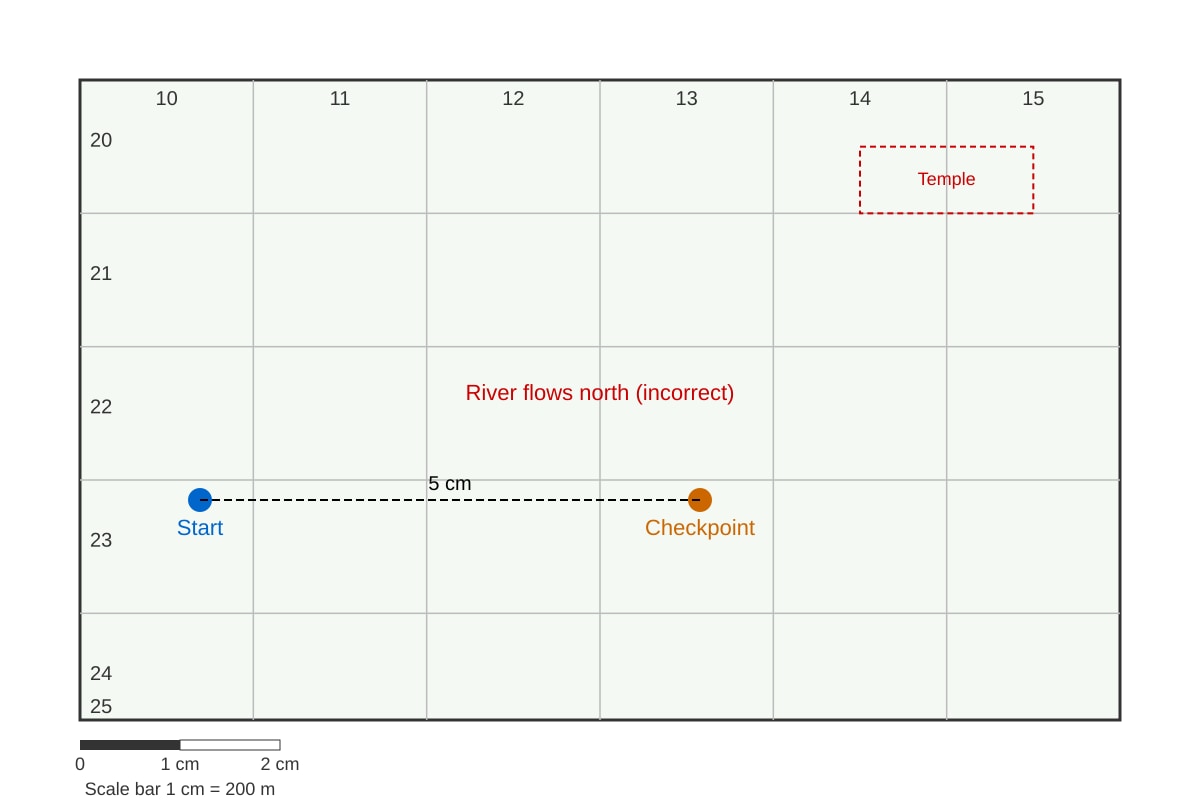
- Working: Map distance = 5 cm. Scale: 1 cm = 200 m.
Real distance = 5 × 200 = 1000 m (1 km). - Mark breakdown: 1 mark for 5 cm measured, 1 mark for correct calculation.
- Teaching note: Multiply map distance by scale bar ratio.
Q5 [3 marks]
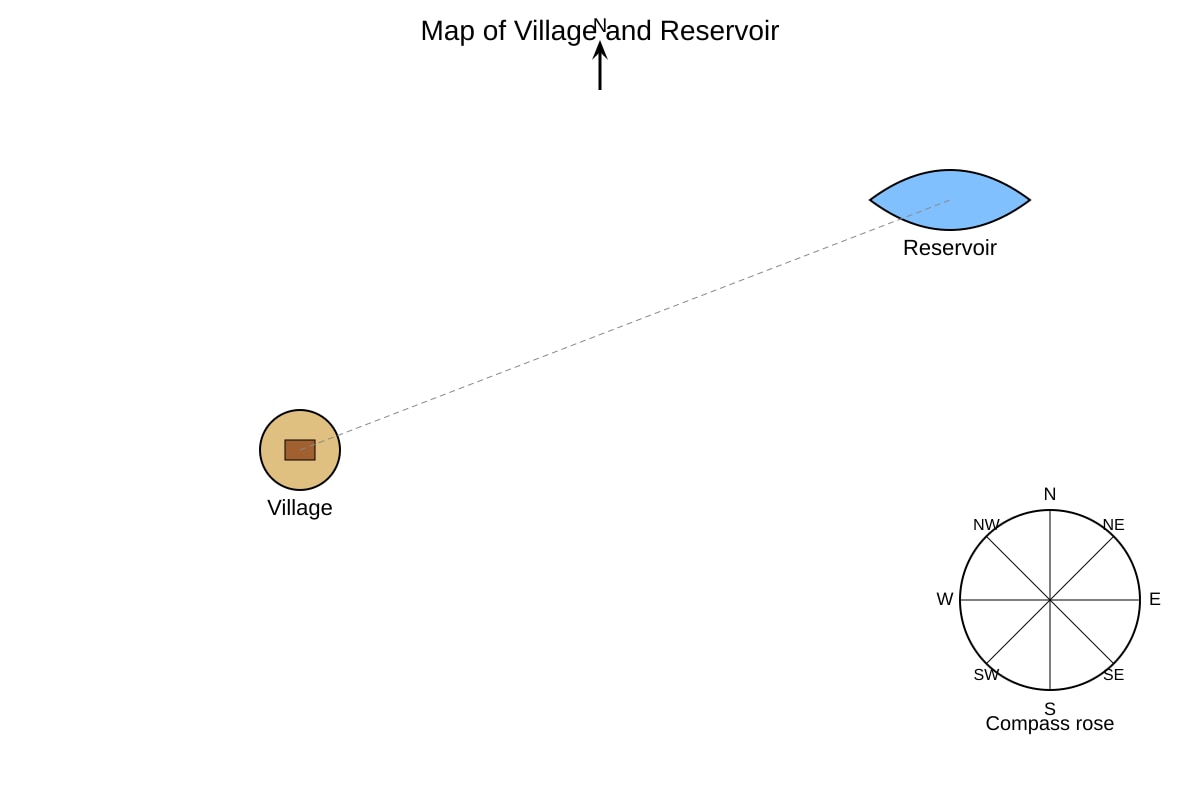
- Answer: North-East (NE).
- Mark breakdown: 1 mark direction stated, 2 marks for using compass rose correctly with reasoning (reservoir top-right of village).
- Teaching note: From village, reservoir is up and right → NE.
Section B: Graph and Data Interpretation (26 marks)
Q6 [3 marks]
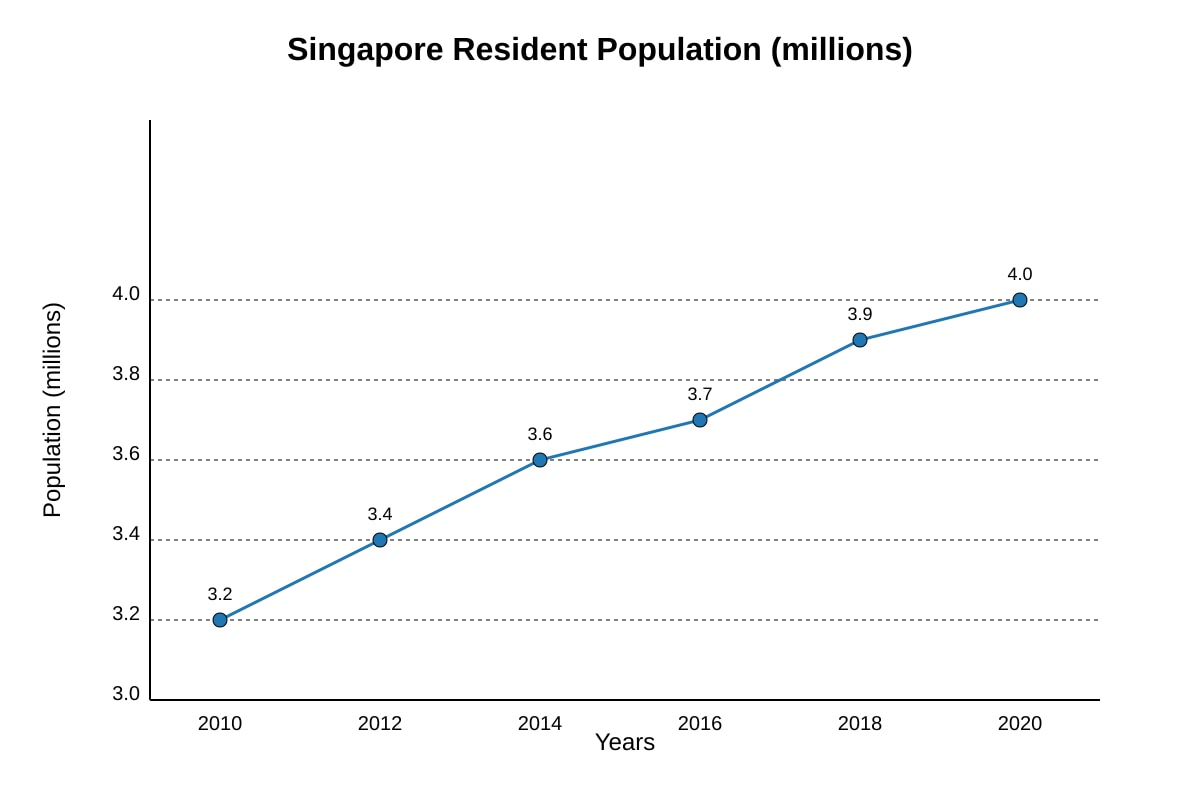
- Answer: The resident population increased steadily from 3.2 million in 2010 to 4.0 million in 2020. It rose by 0.8 million over the period, with the fastest growth between 2016 and 2020.
- Mark breakdown: 1 mark overall increase, 1 mark start/end stats, 1 mark rate/pattern.
- Teaching note: Cite numbers from graph; describe journey not just ends.
Q7 [2 marks]
- Working: % increase = ((4.0 − 3.2) / 3.2) × 100 = (0.8 / 3.2) × 100 = 25%.
- Mark breakdown: 1 mark formula, 1 mark correct answer.
- Teaching note: Percentage increase = change ÷ original × 100.
Q8 [2 marks]
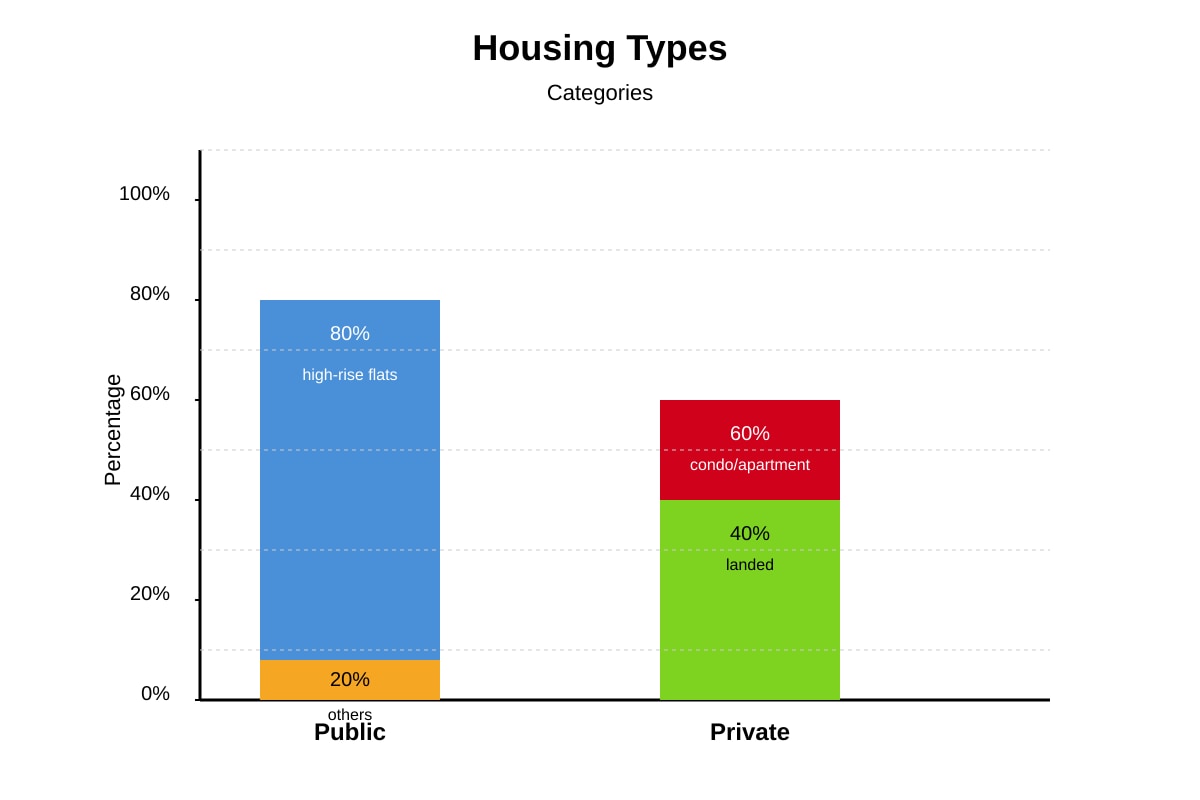
- Answer: (1) Public housing is mostly high-rise (80%) while private has more landed (40%). (2) Private has 60% condo vs public 20% others.
- Mark breakdown: 1 mark per valid difference.
- Teaching note: Read bars; compare categories.
Q9 [3 marks]
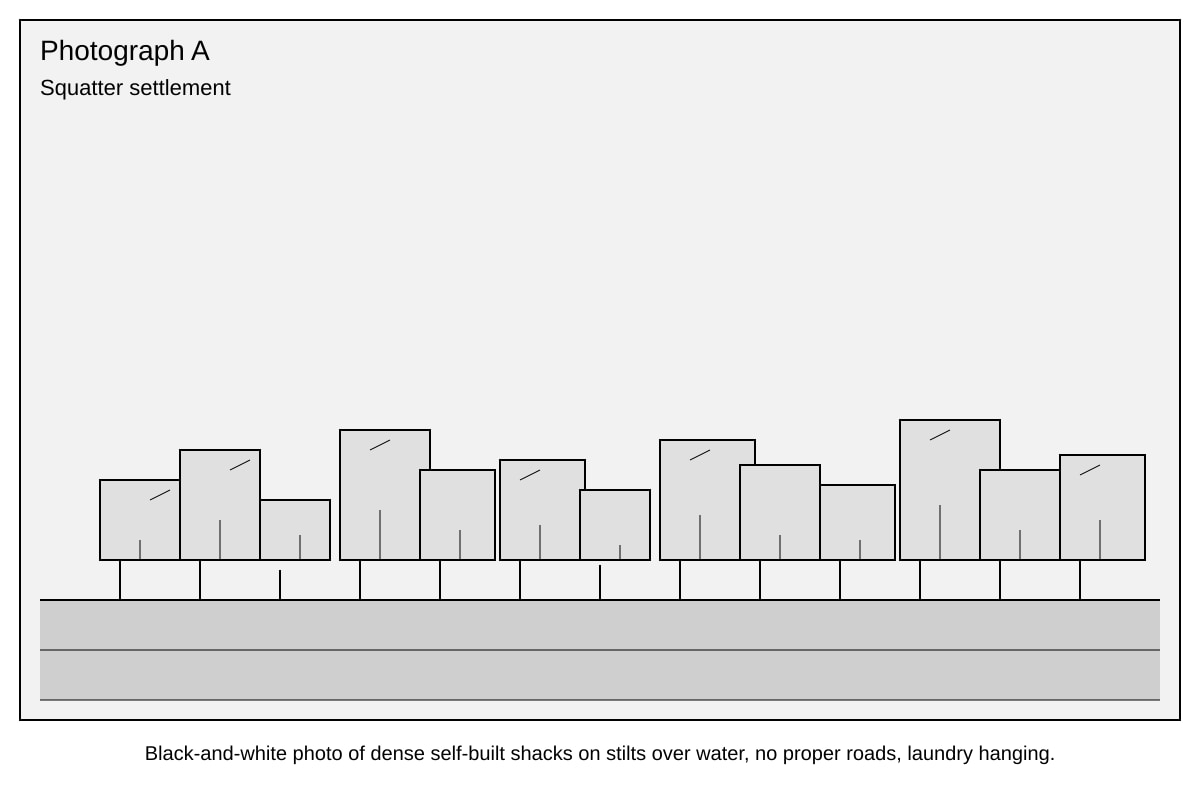
- Answer: Characteristics: dense self-built shacks; built on stilts over water. Problem: poor sanitation as waste falls into water.
- Mark breakdown: 2 marks characteristics, 1 mark problem explained.
- Teaching note: Observation vs inference — explain link to environment.
Q10 [4 marks]
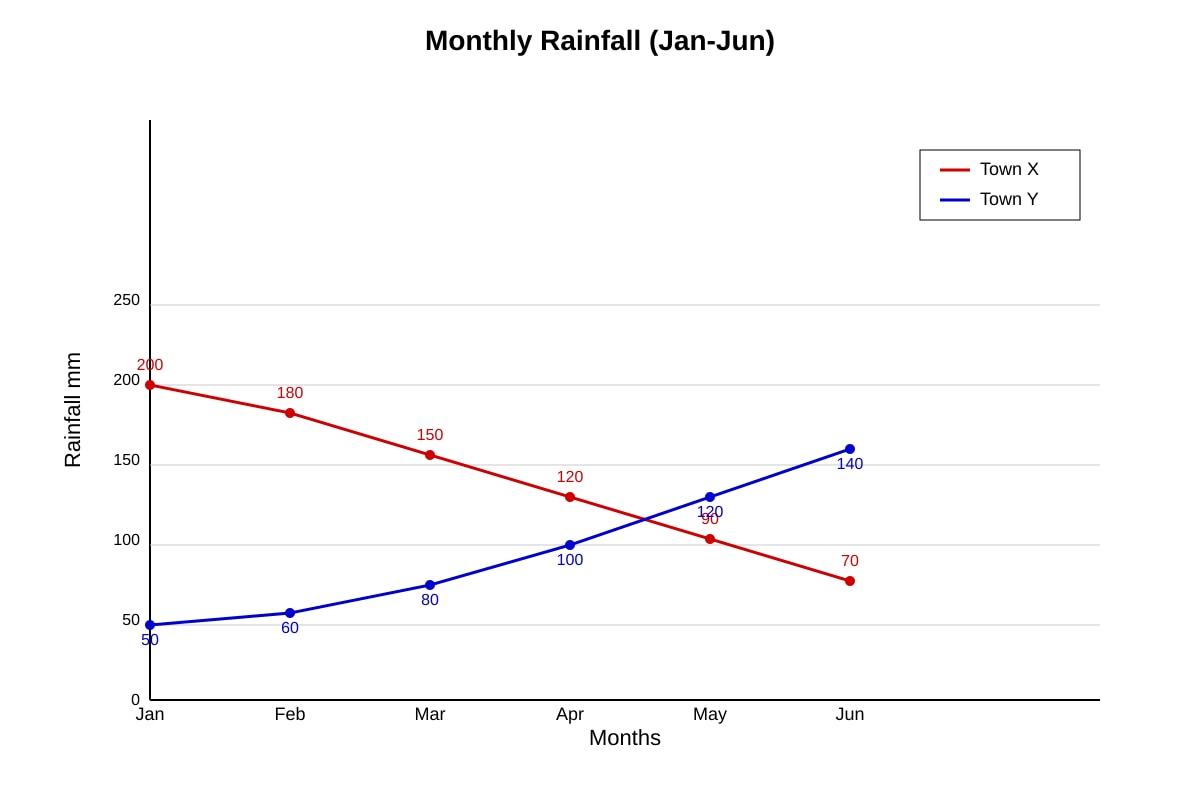
- Answer: Town X rainfall decreases from 200 mm (Jan) to 70 mm (Jun). Town Y increases from 50 mm to 140 mm. They show opposite trends; X is wetter early, Y wetter later.
- Mark breakdown: 2 marks Town X trend with stats, 2 marks Town Y trend with stats.
- Teaching note: Use data points; compare not just state.
Q11 [1 mark]
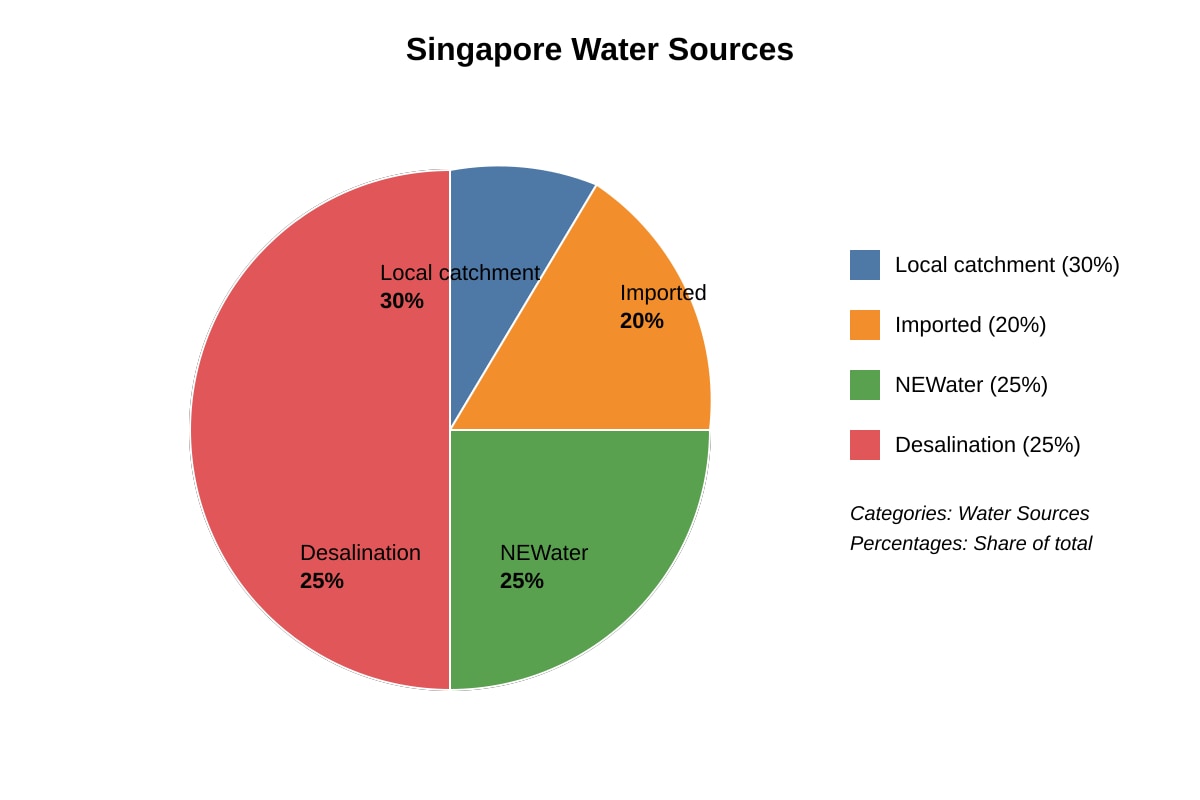
- Answer: 25%
- Teaching note: Read pie label directly.
Q12 [3 marks]
- Answer: The graph shows 4 sources, not just one. This helps geographer see diversification (25% desalination + 25% NEWater) reducing reliance on imported water → sustainability.
- Mark breakdown: 1 mark source variety, 2 marks link to sustainability.
- Teaching note: Sustainability = meeting needs without depleting; multiple sources = resilient.
Q13 [3 marks]
- Working: Mean = (26+27+28+29+29+28) / 6 = 167 / 6 = 27.83 °C (or 27.8 °C).
- Mark breakdown: 1 mark sum, 1 mark divide, 1 mark answer.
- Teaching note: Mean = total ÷ count.
Section C: Applied Data and Fieldwork (24 marks)
Q14 [2 marks]
- Answer: Location P (MRT) more suitable. Justification: high human flow gives more samples, representative of commuters.
- Mark breakdown: 1 mark choice, 1 mark reason.
- Teaching note: Fieldwork site must suit aim.
Q15 [3 marks]
- Answer: Bar graph shows weekly mass; council can spot low weeks and improve recycling drives. Visual trend aids planning → less waste, sustainability.
- Mark breakdown: 1 mark graph use, 2 marks sustainability link.
- Teaching note: Data → action.
Q16 [3 marks]
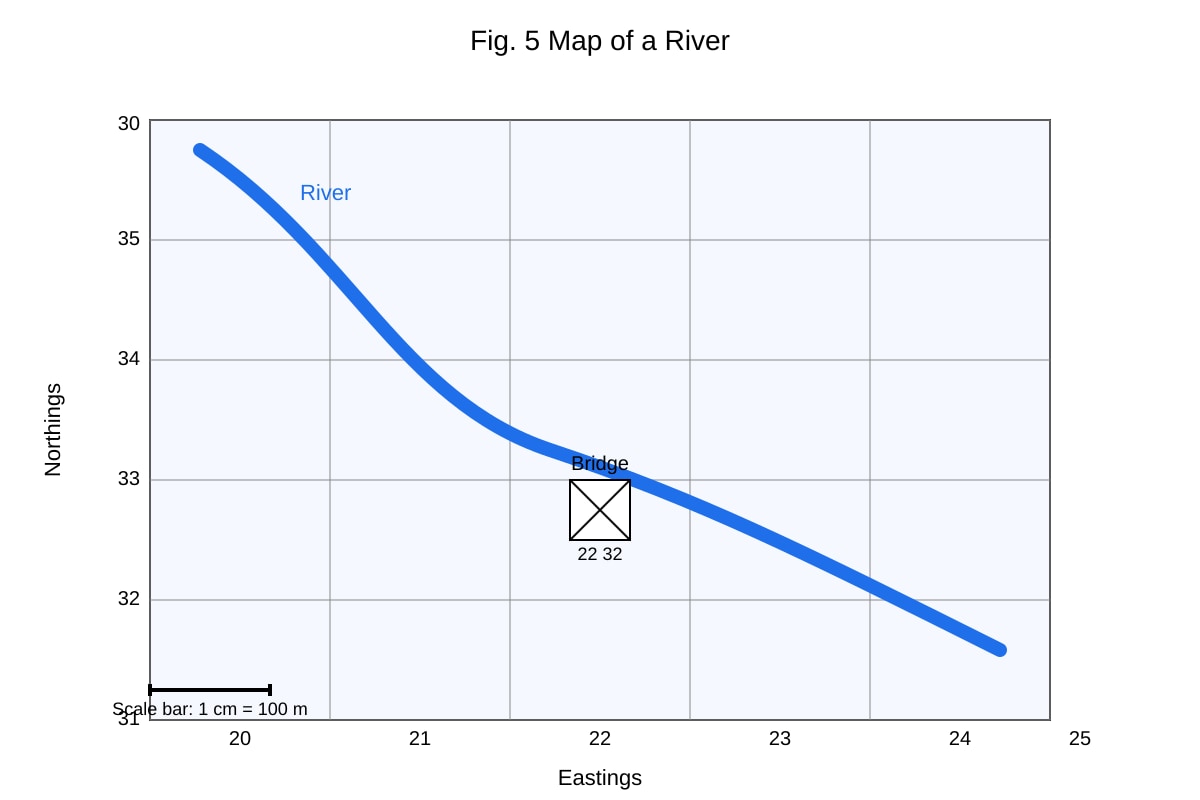
- Answer: Grid ref 22 32. Scale use: measure real distance between features (e.g., 1 cm = 100 m).
- Mark breakdown: 1 mark ref, 2 marks scale explanation.
- Teaching note: Bottom-left of bridge square.
Q17 [3 marks]
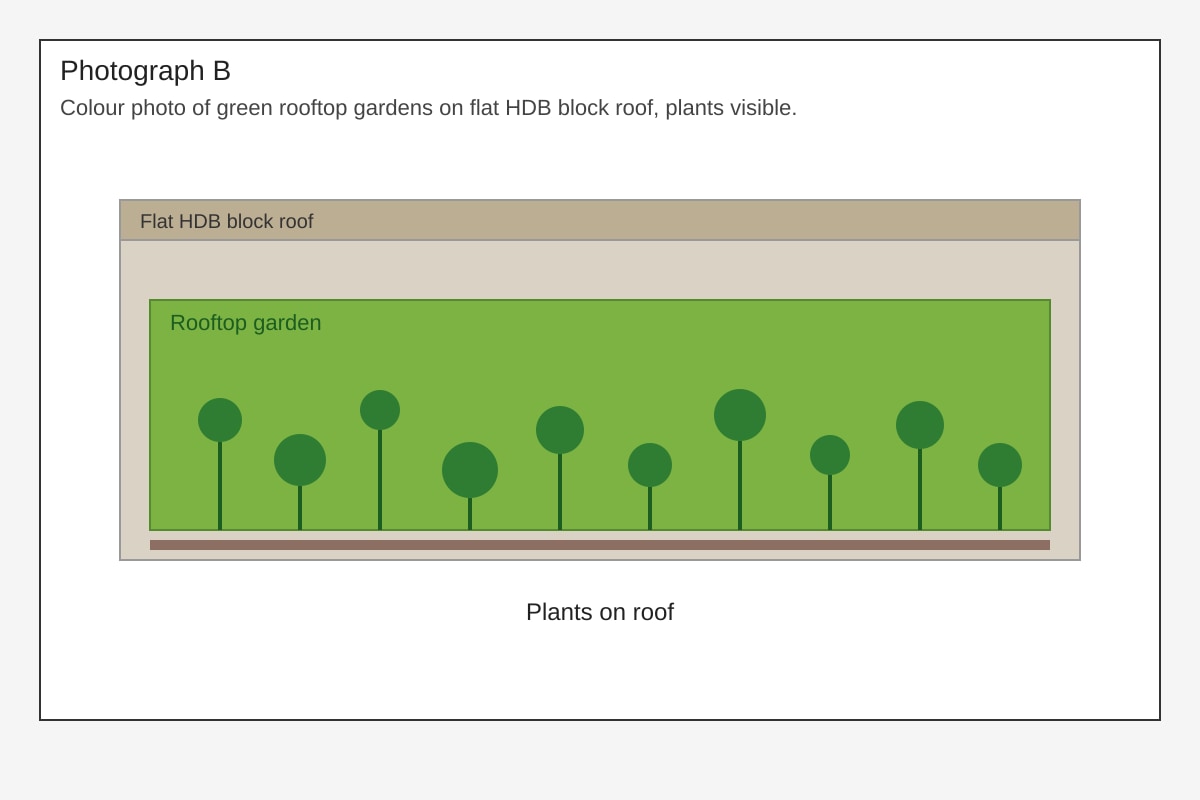
- Answer: Feature: plants on block roof. Helps: absorbs heat (less urban heat), absorbs rainwater, gives greenery.
- Mark breakdown: 1 mark describe, 2 marks explain environment.
- Teaching note: Rooftop = cooling, biodiversity.
Q18 [3 marks]
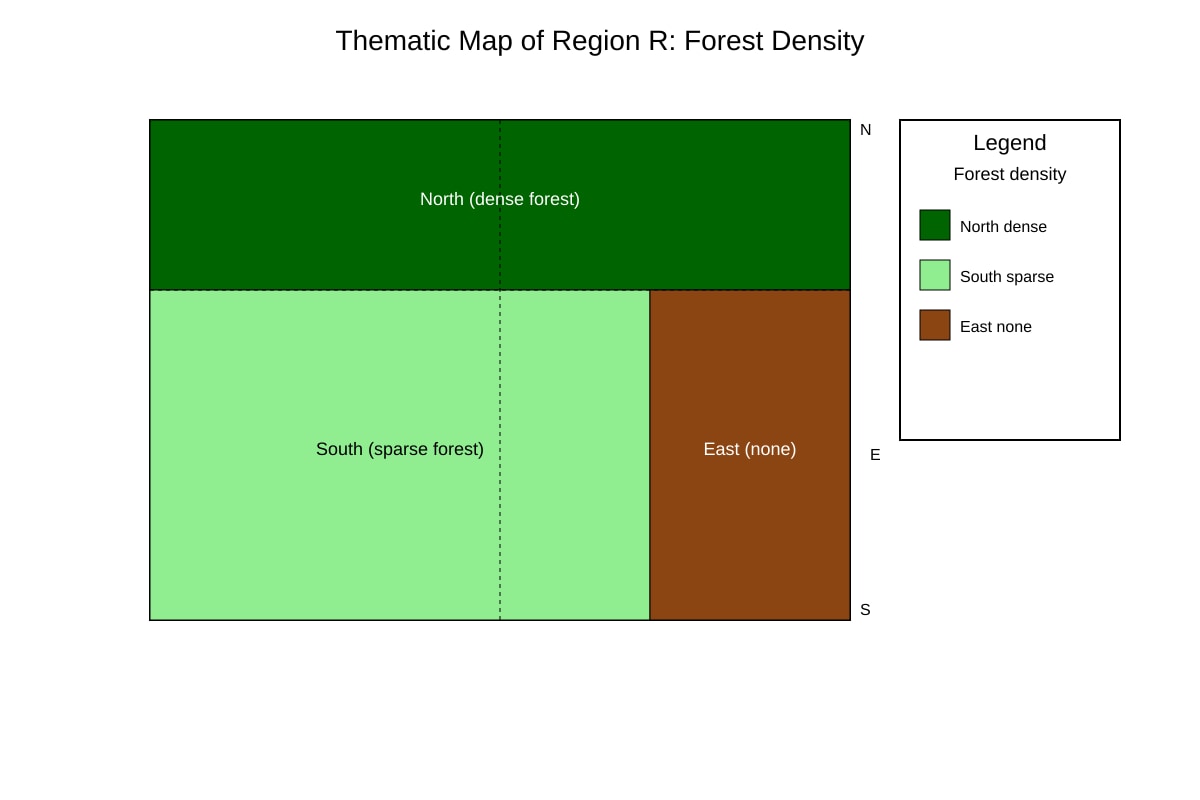
- Answer: Dense forest in north, sparse in south, none in east. Uneven distribution.
- Mark breakdown: 1 mark per zone described.
- Teaching note: Read legend colours.
Q19 [4 marks]
- Answer: Pie chart or bar chart. Reason: shows proportion of each mode (Bus 40% largest). Pie best for parts of whole.
- Mark breakdown: 2 marks chart type, 2 marks justification with data.
- Teaching note: Percentages → pie/bar.
Q20 [6 marks]
- Answer: ERP charges cars entering congested zone (e.g., $2 at peak). Data from gantries show traffic drop after charge. This discourages trips, shifts to public transport, reduces jams.
- Mark breakdown: 2 marks mechanism, 2 marks data monitoring, 2 marks outcome.
- Teaching note: Policy + data = evaluate success.