From Real Exams Exam Paper
Secondary 2 Geography Semestral Assessment 2 (End of Year) Paper 1
Free Sec 2 Geography SA2 Paper 1, HY3 Exam version, with questions, answers, and syllabus-aligned practice for Singapore students.
These static practice materials are generated from the site's syllabus and paper-generation workflow, with source and model context shown so students and parents can evaluate the material before use.
Questions

Free quiz and exam paper access
Enter your details to view this paper
Your access is remembered on this device.
Answers
TuitionGoWhere Exam Practice (AI) — Geography Secondary 2
SA2 Practice Paper Answers — Map Graph Data Skills (Version 1)
Total Marks: 60
Section A: Map Reading (21 marks)
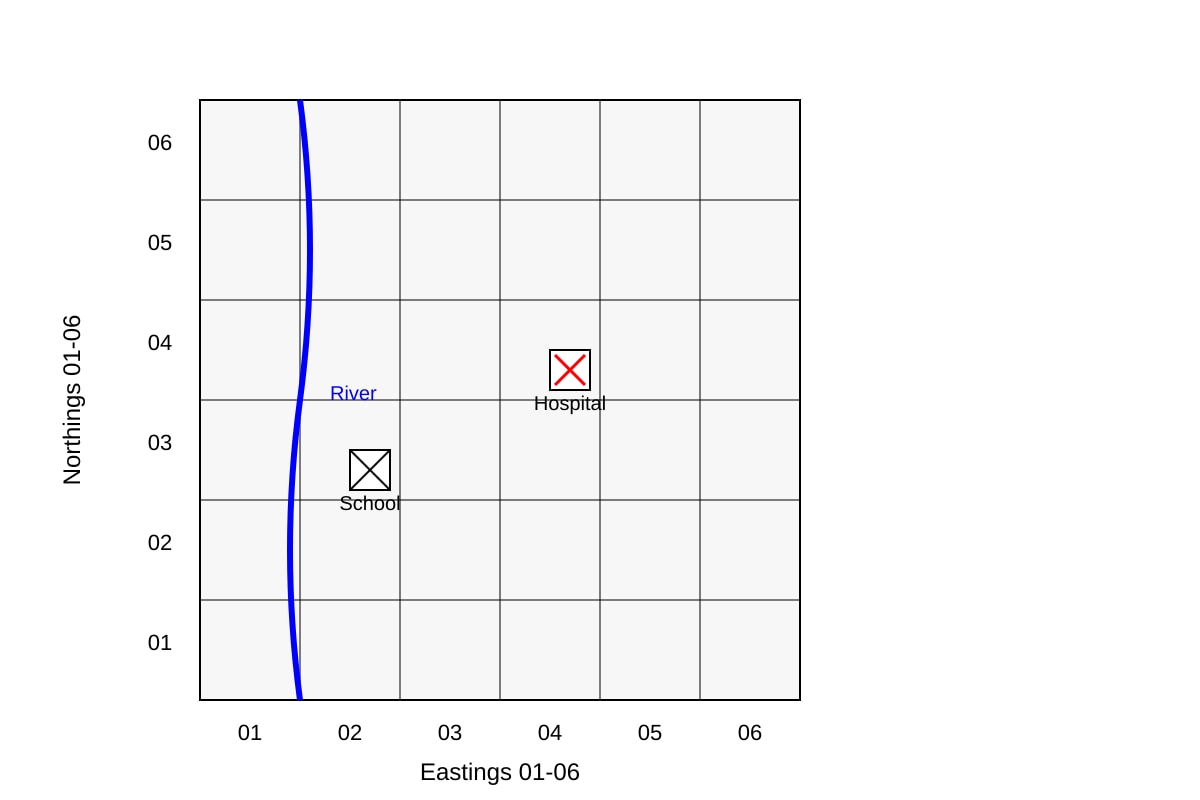
1. [1] 0302
Teaching note: Read easting (horizontal, left-to-right) first: school is between 03 and 04 → 03. Then northing (vertical, bottom-to-top): between 02 and 03 → 02. Four-figure grid reference = 0302.
Common mistake: Writing northing first (0203).
2. [1] 0504
Teaching note: Hospital is in square easting 05–06, northing 04–05 → 0504.
3. [2]
- Mark 1: The easting is given as 02 but should be 03 (school is in easting 03–04).
- Mark 2: The northing is given as 03 but should be 02 (school is in northing 02–03).
Teaching note: Grid reference always Easting-Northing. Student reversed or misread both.
4. [2] 032022 (or 031021 approx.)
Teaching note: Six-figure: take four-figure 0302, then estimate tenths within square. If school is central, easting +0.5→03 5? Actually six-figure splits each square into 10. Example: 0302 with school at half → 035025? For Sec 2, simple estimate: 032022 means 03 + 2/10 east, 02 + 2/10 north. Accept any reasonable tenth estimate.
Marking: 1 for correct four-figure base, 1 for plausible tenth.
5. [2] Human: school/hospital; Physical: river. [1+1]
Teaching note: Human features are built by people; physical are natural.
6. [3]
Working: School at (3,2), Hospital at (5,4).
Distance = √[(5−3)² + (4−2)²] = √[4+4] = √8 ≈ 2.83 km.
Or grid squares: 2 E, 2 N → diagonal ≈ 2.83 km.
Marks: 1 for correct coordinates used, 1 for method, 1 for answer with unit.
7. [2] River is to the west (or west-northwest) of school.
Teaching note: River along easting 02, school at 03 → river is west. 1 mark direction, 1 mark reference to map.
Section B: Graph & Data Interpretation (21 marks)
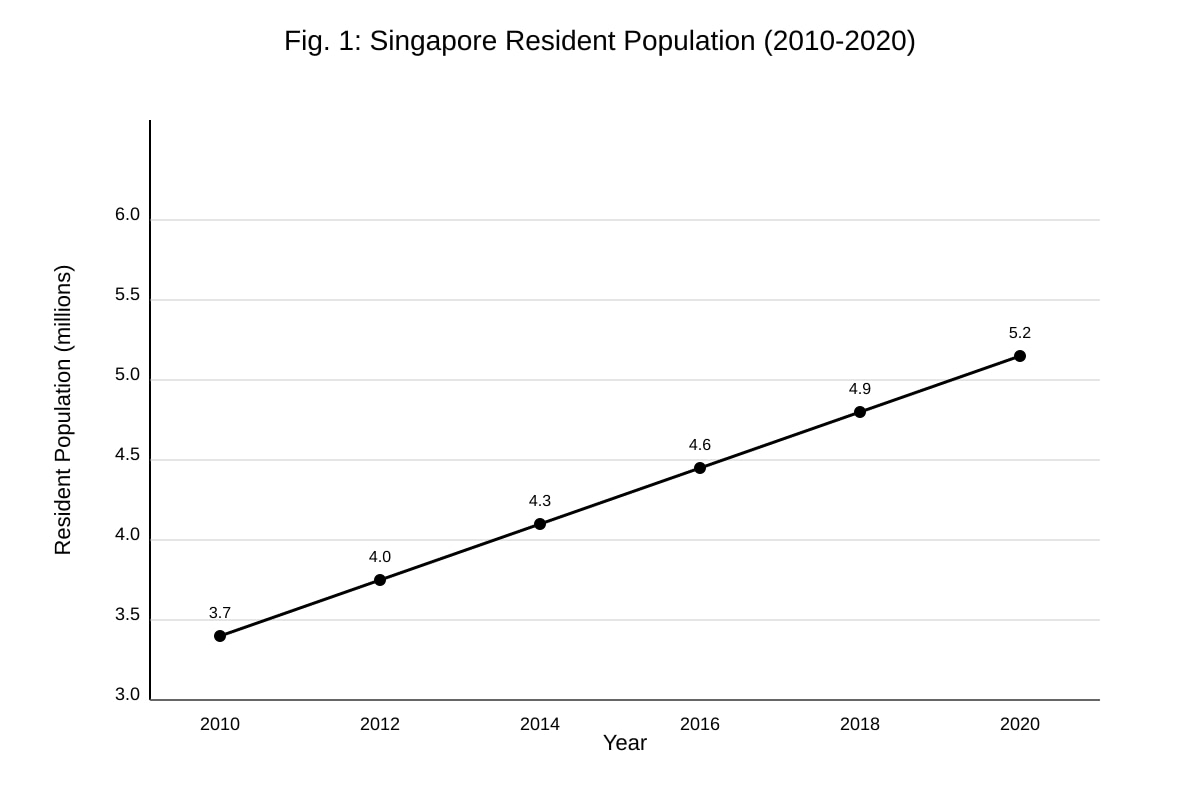
8. [3]
- Overall increase from 3.7m (2010) to 5.2m (2020). [1]
- Steady rise every 2 years by ~0.3m. [1]
- More than 40% growth (refer to figures). [1]
Teaching note: Trend description must cite stats.
9. [3]
% increase = (5.2 − 3.7)/3.7 × 100 = 1.5/3.7 × 100 ≈ 40.5%
Marks: 1 formula, 1 subtraction, 1 final %.
Answer: 40.5%
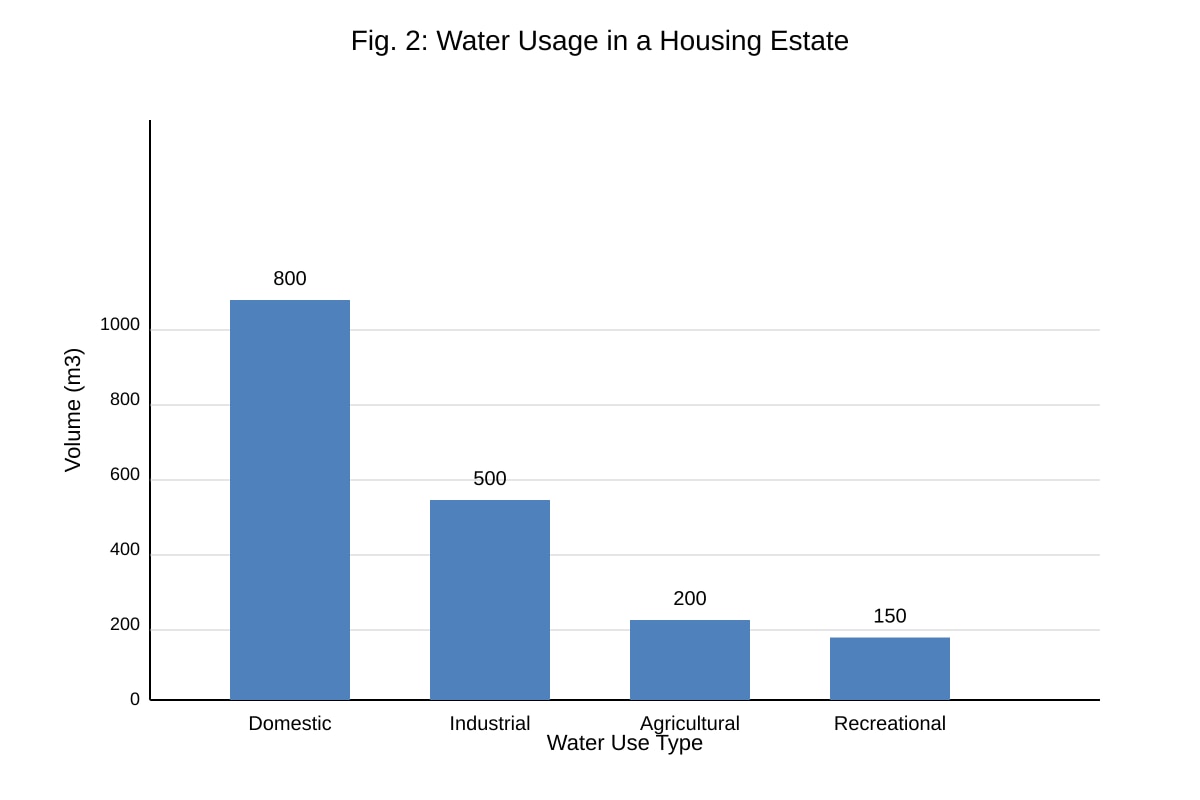
10. [1] Domestic (800 m³)
11. [3]
- Domestic highest at 800 m³ (40% of total). [1]
- Industrial next at 500 m³. [1]
- Agricultural and Recreational low (<250 each). [1]
Teaching note: Describe distribution = compare categories with values.
12. [2]
- Dense self-built wooden structures. [1]
- Stilt supports over ground/narrow paths. [1]
13. [3]
- No proper sanitation → disease spread. [1]
- Stagnant water under stilts → mosquitoes. [1]
- Overcrowding → poor air, fire risk. [1]
Teaching note: Link physical feature to health outcome.
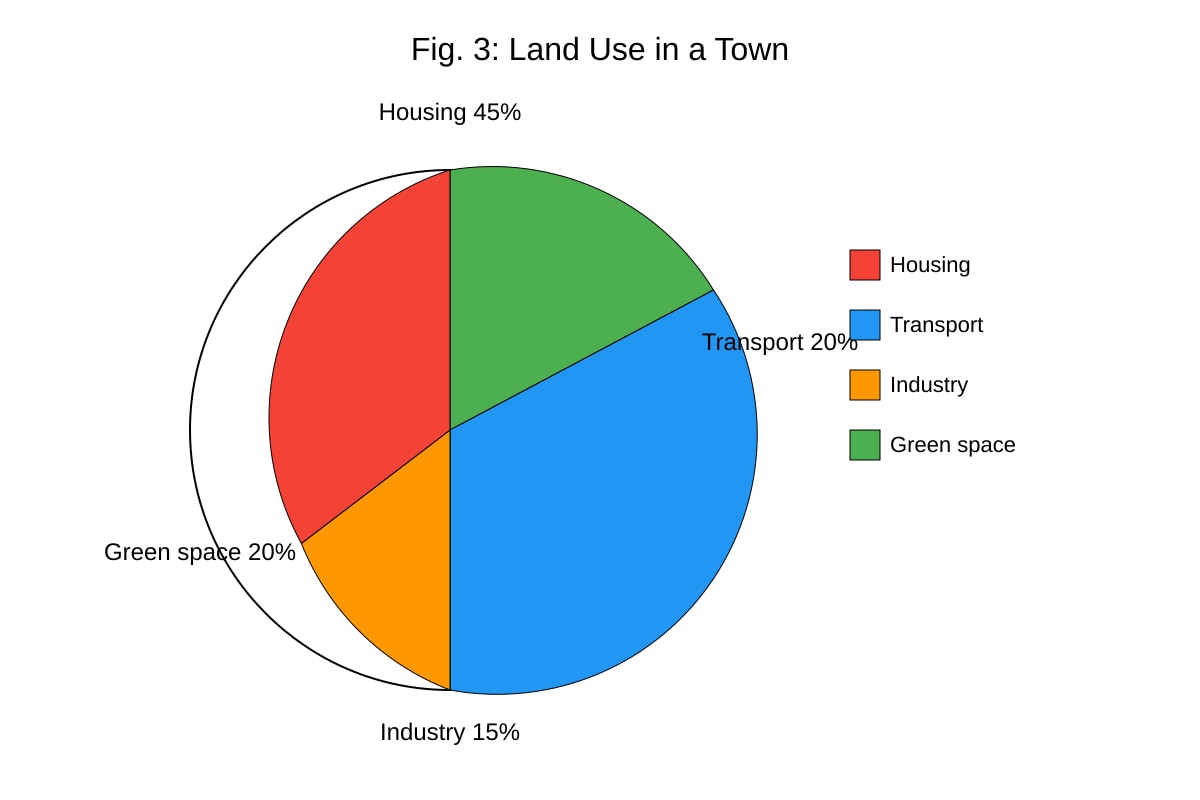
14. [2] 45%
Section C: Applied Data Skills (18 marks)
15. [2] Location X (MRT) more suitable [1] because higher pedestrian flow gives representative data [1].
16. [3]
- Charge vehicles entering congested zone. [1]
- Drivers reduce trips or shift time. [1]
- Less traffic, smoother flow. [1]
17. [3]
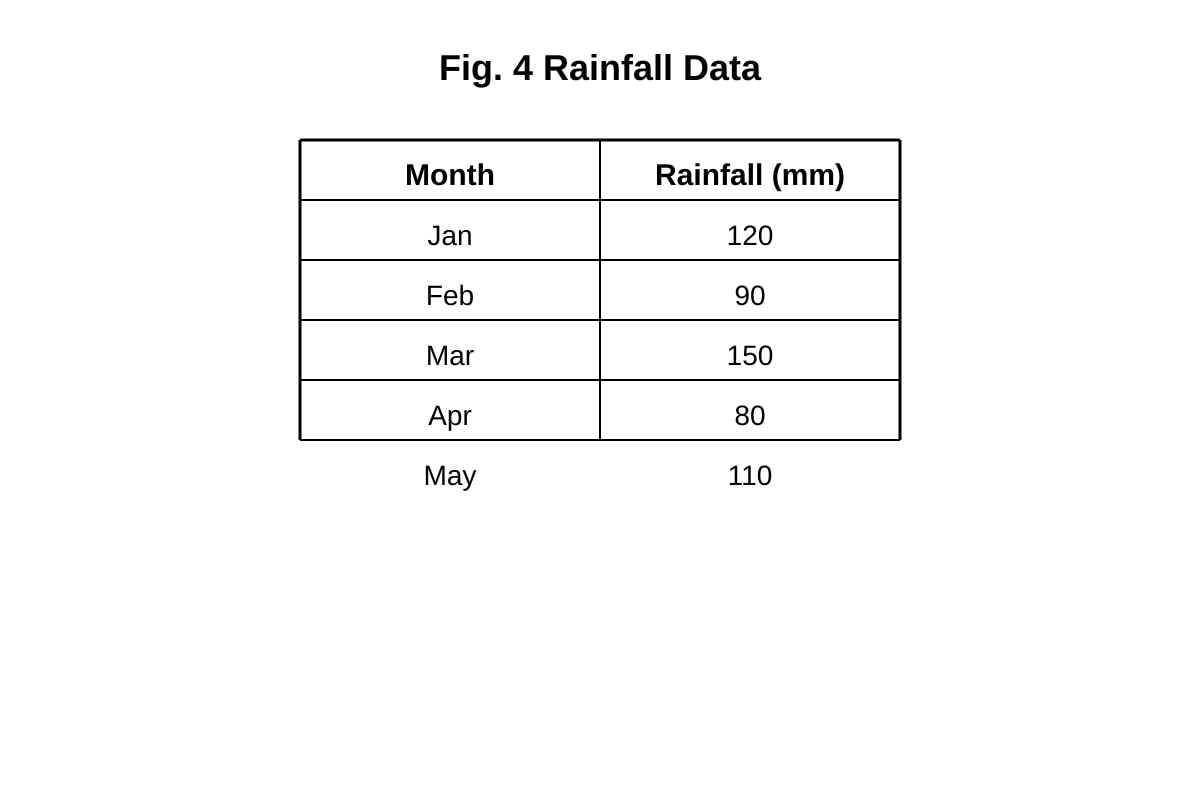
Mean = (120+90+150+80+110)/5 = 550/5 = 110 mm.
Marks: 1 sum, 1 divide, 1 answer.
18. [2] April (80 mm) [1]; likely drier season [1].
19. [3]
- Use bar chart [1]
- Months on x, rainfall on y [1]
- Easy comparison of values [1].
20. [5]
- Population is one factor but not only. [1]
- Water management (e.g., Singapore taps) offsets demand. [1]
- Climate/rainfall variability matters. [1]
- Data from Q8–Q17 shows usage type & infrastructure key. [1]
- Conclusion too simplistic without considering technology & distribution. [1]