AI Generated Quiz
Secondary 1 Science Scientific Inquiry Quiz
Free Sec 1 Science Scientific Inquiry quiz, Nemo3 AI version, with questions, answers, and syllabus-aligned practice for Singapore students.
These static practice materials are generated from the site's syllabus and paper-generation workflow, with source and model context shown so students and parents can evaluate the material before use.
Questions
Secondary 1 Science Quiz - Scientific Inquiry
Name: ___________________________
Class: ___________________________
Date: ___________________________
Score: ________ / 40
Duration: 45 minutes
Total Marks: 40
Instructions:
- Answer all questions in the spaces provided.
- Show all working for calculation questions.
- For multiple-choice questions, circle the correct option (A, B, C, or D).
- The number of marks is given in brackets [ ] at the end of each question or part question.
Section A: Multiple Choice Questions (10 marks)
Questions 1 to 10 carry 1 mark each. Circle the correct answer.
1. A student measures the length of a metal rod three times using a ruler and obtains the following readings: 12.3 cm, 12.5 cm, and 12.4 cm. The true length of the rod is 12.0 cm. Which statement best describes the student's measurements? [1]
A. Accurate and precise
B. Accurate but not precise
C. Precise but not accurate
D. Neither accurate nor precise
2. In an experiment to investigate the effect of temperature on the rate of dissolving sugar in water, which variable should be the independent variable? [1]
A. Volume of water used
B. Temperature of water
C. Mass of sugar dissolved
D. Time taken for sugar to dissolve
3. A student uses a measuring cylinder to measure 25 cm³ of water. The bottom of the meniscus is at the 25 cm³ mark, but the student reads the top of the meniscus. What type of error is this? [1]
A. Zero error
B. Parallax error
C. Random error
D. Systematic error
4. Which of the following is a controlled variable in an experiment to test how the height of a ramp affects the speed of a toy car rolling down? [1]
A. Height of the ramp
B. Speed of the toy car
C. Mass of the toy car
D. Length of the ramp
5. A digital balance shows a reading of 0.5 g when nothing is placed on it. When a beaker is placed on the balance, the reading is 52.3 g. What is the actual mass of the beaker? [1]
A. 51.8 g
B. 52.3 g
C. 52.8 g
D. 53.3 g
6. A student records the time for a pendulum to complete 20 oscillations as 38.4 s. What is the period of the pendulum? [1]
A. 1.92 s
B. 3.84 s
D. 19.2 s
D. 38.4 s
7. Which of the following sets of measurements shows high precision but low accuracy? [1]
A. 9.8, 9.9, 9.8, 9.9 (true value: 10.0)
B. 10.1, 10.0, 9.9, 10.0 (true value: 10.0)
C. 8.5, 11.2, 9.8, 10.5 (true value: 10.0)
D. 10.0, 10.0, 10.0, 10.0 (true value: 10.0)
8. In a fair test, only one variable is changed at a time. What is the main reason for this? [1]
A. To make the experiment faster to complete
B. To ensure that any change in the dependent variable is due to the independent variable
C. To reduce the number of measurements needed
D. To make the results easier to plot on a graph
9. A student measures the diameter of a wire using a micrometer screw gauge. The main scale reads 4.5 mm and the thimble scale reads 0.28 mm. The micrometer has a zero error of +0.02 mm. What is the correct diameter of the wire? [1]
A. 4.76 mm
B. 4.78 mm
C. 4.80 mm
D. 4.82 mm
10. Which of the following is NOT a step in the scientific method? [1]
A. Making a hypothesis
B. Designing an experiment
C. Publishing results in a newspaper
D. Analysing data and drawing conclusions
Section B: Structured Questions (18 marks)
11. A group of students wants to investigate how the concentration of salt solution affects the mass of a potato strip after soaking for 30 minutes.
(a) State the independent variable in this investigation. [1]
(b) State the dependent variable in this investigation. [1]
(c) State two variables that must be kept constant to ensure a fair test. [2]
(d) The students prepare salt solutions of concentrations 0%, 5%, 10%, 15%, and 20%. They measure the initial and final mass of each potato strip. Suggest a suitable way to present their results. [1]
(e) The students notice that the potato strip in the 0% solution (distilled water) increases in mass. Explain why this happens. [2]
12. A student uses a stopwatch to measure the time taken for a ball to fall from a height of 2.0 m. The student repeats the measurement five times and obtains the following times: 0.62 s, 0.65 s, 0.63 s, 0.64 s, 0.66 s.
(a) Calculate the average time for the ball to fall. [1]
(b) The student's reaction time introduces a systematic error. Explain what is meant by a systematic error. [1]
(c) Suggest one way the student could reduce the effect of reaction time error in this experiment. [1]
(d) The theoretical time for the fall is 0.64 s. Comment on the accuracy and precision of the student's measurements. [2]
13. In an experiment to investigate the effect of light intensity on the rate of photosynthesis, a student places a lamp at different distances from a water plant and counts the number of bubbles produced per minute.
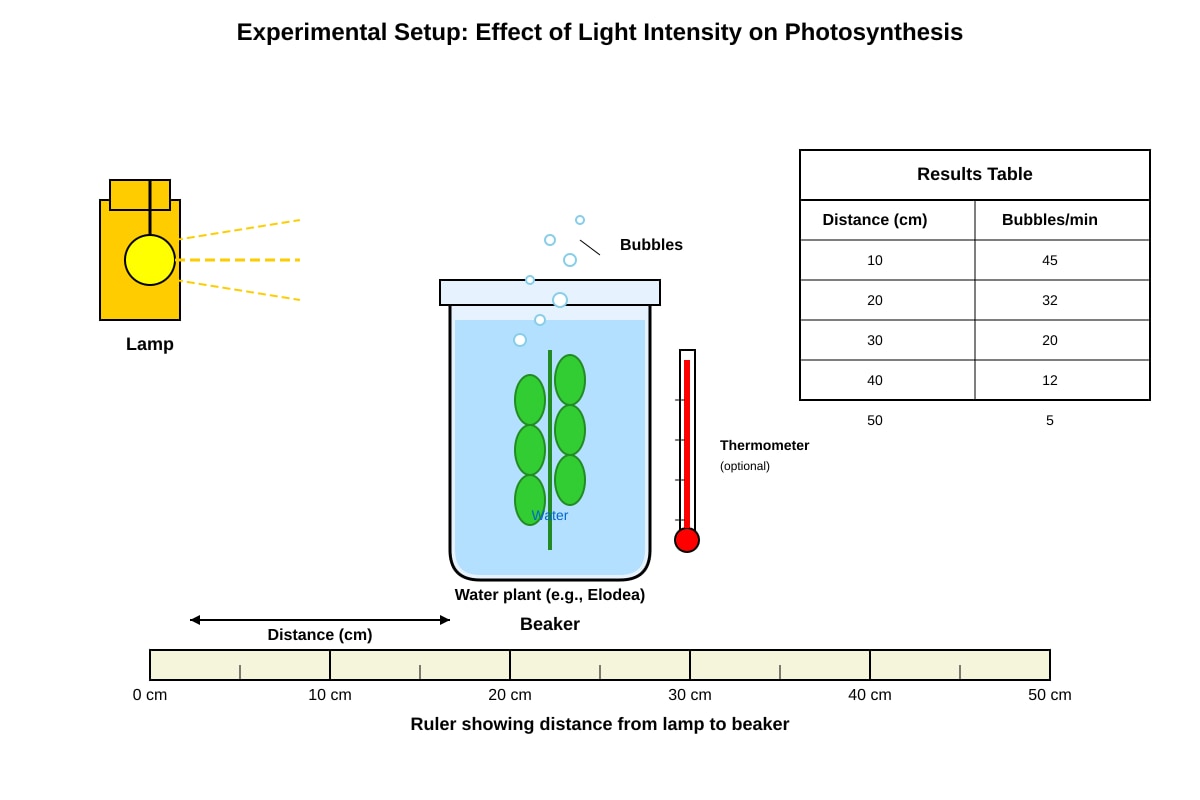
Generated diagram for Q13.
(a) State the hypothesis for this investigation. [1]
(b) Identify the independent and dependent variables. [2]
(c) State two controlled variables. [2]
(d) The student obtains the following results:
| Distance of lamp from plant (cm) | Number of bubbles per minute |
|---|---|
| 10 | 48 |
| 20 | 32 |
| 30 | 20 |
| 40 | 12 |
| 50 | 6 |
Describe the relationship between the distance of the lamp and the rate of photosynthesis. [1]
(e) Explain why the rate of photosynthesis changes with light intensity. [2]
14. A student measures the volume of a small irregular stone using the displacement method. The initial water level in a measuring cylinder is 50 cm³. After lowering the stone into the cylinder, the water level rises to 68 cm³.
(a) What is the volume of the stone? [1]
(b) The student then measures the mass of the stone as 54 g. Calculate the density of the stone. [2]
(c) The student repeats the volume measurement three times and gets 18 cm³, 19 cm³, and 17 cm³. Explain why there might be variation in the readings. [1]
Section C: Data Analysis and Experimental Design (12 marks)
15. A student investigates how the length of a pendulum affects its period. The student varies the length and measures the time for 20 oscillations. The results are shown below.
| Length of pendulum (cm) | Time for 20 oscillations (s) | Period T (s) |
|---|---|---|
| 20 | 18.0 | 0.90 |
| 30 | 22.0 | 1.10 |
| 40 | 25.4 | 1.27 |
| 50 | 28.4 | 1.42 |
| 60 | 31.0 | 1.55 |
| 70 | 33.4 | 1.67 |
(a) Complete the table by calculating the period for each length. The first two have been done for you. [1]
(b) Plot a graph of period T (y-axis) against length L (x-axis) on the grid below. [3]
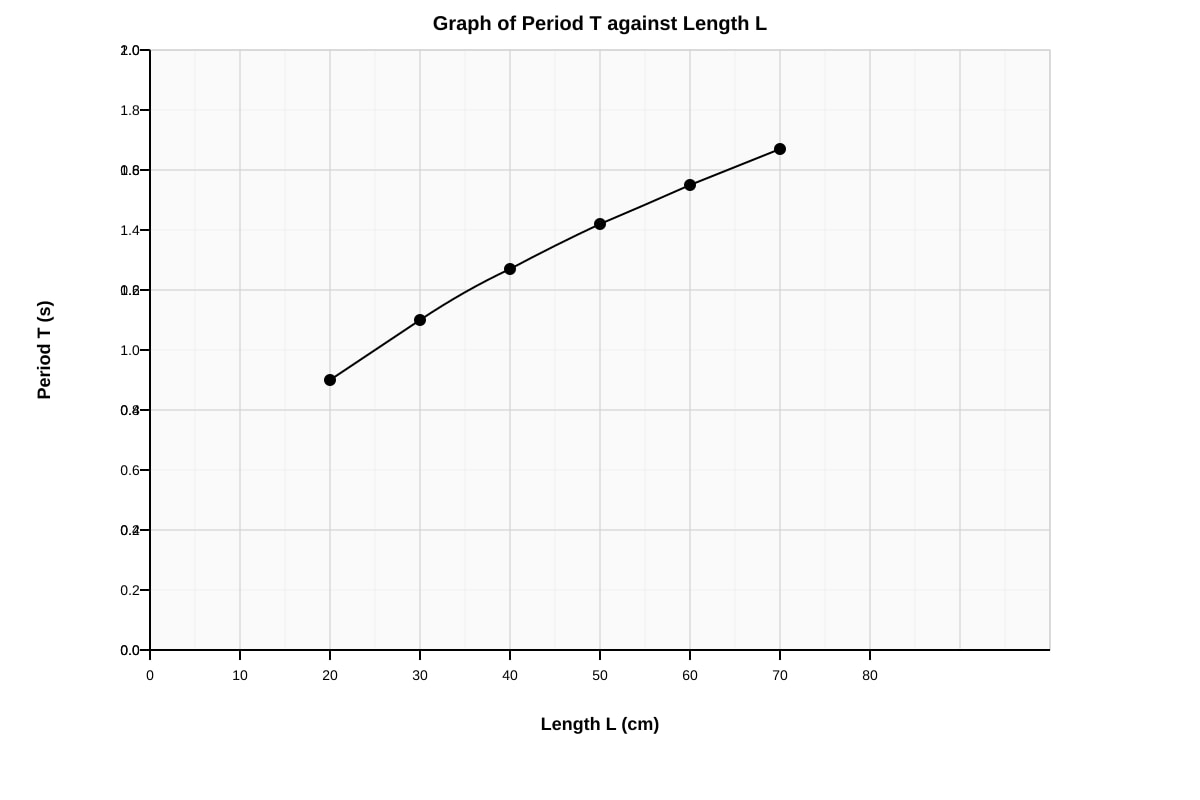
Generated graph for Q15.
(c) Describe the relationship between the period of a pendulum and its length. [1]
(d) Use your graph to estimate the period of a pendulum of length 45 cm. [1]
(e) The student wants to investigate whether the mass of the pendulum bob affects the period. State the independent, dependent, and controlled variables for this new investigation. [3]
16. A student carries out an experiment to determine the density of three different liquids (A, B, and C). The student measures the mass of an empty measuring cylinder, then adds 50 cm³ of each liquid and measures the total mass. The results are shown below.
| Liquid | Mass of empty cylinder (g) | Mass of cylinder + 50 cm³ liquid (g) |
|---|---|---|
| A | 45.0 | 95.0 |
| B | 45.0 | 115.0 |
| C | 45.0 | 80.0 |
(a) Calculate the density of each liquid. [3]
(b) The student pours all three liquids into a tall container. They do not mix. Predict the order of the liquids from top to bottom. [1]
(c) The student notices that liquid B has a zero error of +2.0 g on the balance used. Recalculate the density of liquid B with this correction. [2]
17. Design an experiment to investigate how the surface area of a parachute affects the time taken for it to fall a fixed distance.
Your answer should include:
- A clear hypothesis [1]
- The independent and dependent variables [2]
- Three controlled variables [3]
- A brief procedure (4-5 steps) [3]
- How you would ensure the results are reliable [1]
- A suitable way to present the results [1]
18. The diagram below shows a vernier caliper reading.
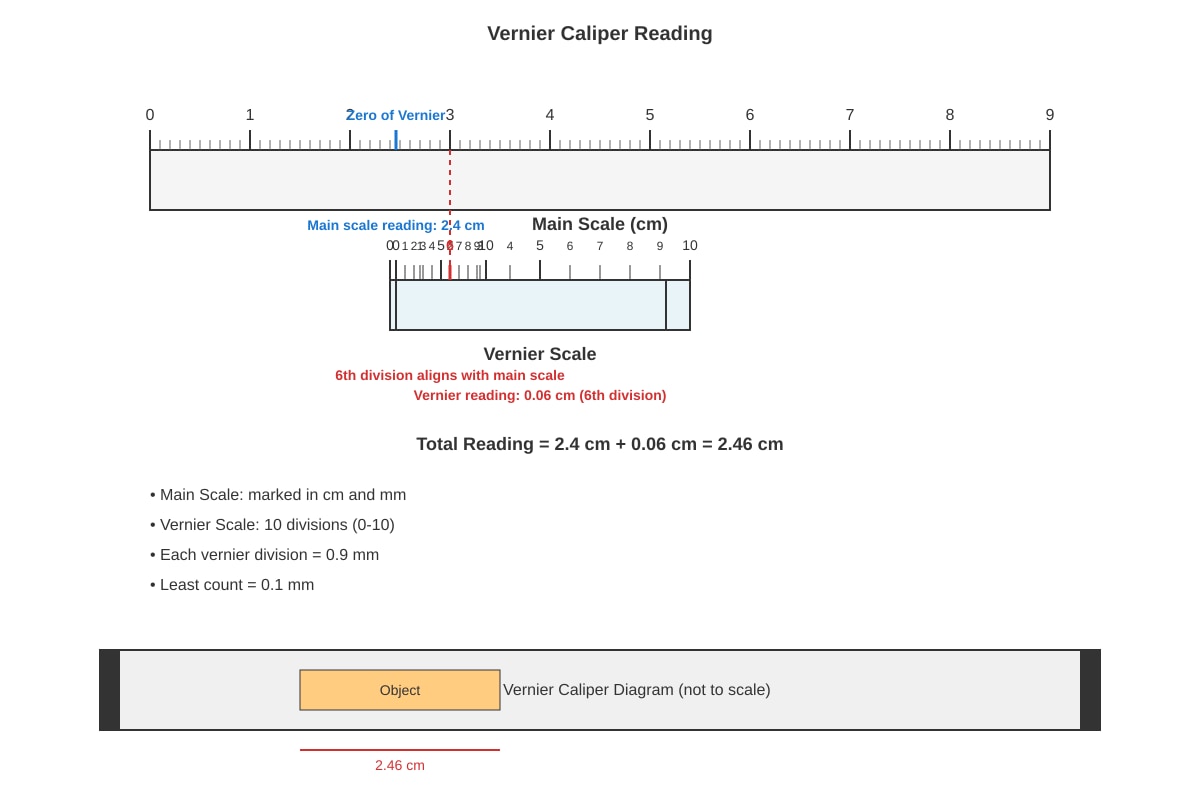
Generated diagram for Q18.
(a) What is the reading shown on the vernier caliper? [1]
(b) The vernier caliper has a zero error of -0.03 cm. What is the corrected reading? [1]
(c) Explain the difference between a positive zero error and a negative zero error. [2]
19. A student investigates the cooling curve of hot water. The student heats 100 cm³ of water to 80°C and then records the temperature every minute for 15 minutes as it cools in a beaker.
(a) State two controlled variables in this experiment. [2]
(b) The student plots a graph of temperature against time. Describe the shape of the graph you would expect. [1]
(c) The student repeats the experiment with 100 cm³ of water in a polystyrene cup instead of a beaker. Predict how the cooling curve would differ and explain why. [2]
(d) Suggest one source of random error in this experiment and how to minimise its effect. [2]
20. In an experiment to test the effectiveness of different insulating materials, a student wraps identical beakers containing 100 cm³ of hot water at 80°C with different materials (cotton wool, aluminium foil, bubble wrap, and newspaper). The student measures the temperature after 10 minutes.
(a) State the independent and dependent variables. [2]
(b) State three controlled variables. [3]
(c) The student obtains the following results:
| Insulating material | Temperature after 10 minutes (°C) |
|---|---|
| Cotton wool | 62 |
| Aluminium foil | 58 |
| Bubble wrap | 65 |
| Newspaper | 60 |
| No insulation (control) | 52 |
Which material is the best insulator? Explain your answer using the data. [2]
(d) Why is it important to include a control (no insulation) in this experiment? [1]
End of Quiz
Answers
Secondary 1 Science Quiz - Scientific Inquiry (Answer Key)
Total Marks: 40
Section A: Multiple Choice Questions (10 marks)
1. Answer: C [1]
Explanation: The readings (12.3, 12.5, 12.4 cm) are close to each other (precise) but far from the true value of 12.0 cm (not accurate). Precision refers to how close repeated measurements are to each other; accuracy refers to how close measurements are to the true value.
2. Answer: B [1]
Explanation: The independent variable is the one deliberately changed by the experimenter. In this investigation, the temperature of water is being changed to see its effect on the rate of dissolving. The dependent variable would be the time taken or rate of dissolving.
3. Answer: B [1]
Explanation: Parallax error occurs when the eye is not positioned perpendicular to the scale reading. Reading the top of the meniscus instead of the bottom is a classic parallax error. For water and most liquids, the correct reading is at the bottom of the meniscus.
4. Answer: C [1]
Explanation: Controlled variables are kept constant to ensure a fair test. The mass of the toy car must stay the same so that any change in speed is due only to the ramp height (independent variable). The height of the ramp is the independent variable, and the speed is the dependent variable.
5. Answer: A [1]
Working: Actual mass = Reading with beaker – Zero error reading = 52.3 g – 0.5 g = 51.8 g Explanation: A zero error means the instrument does not read zero when nothing is on it. This zero error must be subtracted from all subsequent readings.
6. Answer: A [1]
Working: Period = Total time / Number of oscillations = 38.4 s / 20 = 1.92 s Explanation: The period is the time for one complete oscillation. When measuring multiple oscillations, divide the total time by the number of oscillations to reduce reaction time error.
7. Answer: A [1]
Explanation: Set A (9.8, 9.9, 9.8, 9.9) shows values very close to each other (high precision) but consistently below the true value of 10.0 (low accuracy). Set B is both accurate and precise. Set C is neither. Set D is both accurate and precise.
8. Answer: B [1]
Explanation: A fair test requires changing only one variable (independent) at a time while keeping all others constant. This ensures that any observed change in the dependent variable can be attributed to the independent variable alone, establishing cause and effect.
9. Answer: A [1]
Working: Reading = Main scale + Thimble scale – Zero error = 4.5 mm + 0.28 mm – (+0.02 mm) = 4.76 mm Explanation: For a positive zero error, the zero error is subtracted from the observed reading. The micrometer reads 0.02 mm too high, so we subtract 0.02 mm.
10. Answer: C [1]
Explanation: The scientific method involves: observation, question, hypothesis, experiment design, data collection, analysis, conclusion, and communication (typically through scientific journals/reports, not newspapers). Publishing in a newspaper is not a formal step in the scientific method.
Section B: Structured Questions (18 marks)
11. (a) Independent variable: Concentration of salt solution [1]
Explanation: The variable deliberately changed by the experimenter.
(b) Dependent variable: Mass of potato strip (or change in mass) [1] Explanation: The variable measured in response to changes in the independent variable.
(c) Any two of: [2]
- Volume of salt solution
- Temperature of solution
- Time of soaking (30 minutes)
- Size/surface area of potato strips
- Type of potato used
- Initial mass of potato strips (should be similar) Explanation: Controlled variables must be kept constant to ensure a fair test. 1 mark each for any two valid variables.
(d) Suitable presentation: Table with columns for concentration, initial mass, final mass, and change in mass; or a line graph of change in mass against concentration [1] Explanation: Since the independent variable (concentration) is continuous numerical data, a line graph is most appropriate to show the trend. A table is also acceptable for recording raw data.
(e) Explanation: [2]
- Water moves into the potato cells by osmosis [1]
- The potato cells have a higher solute concentration (lower water potential) than the distilled water (0% salt solution) [1] Explanation: Osmosis is the movement of water molecules from a region of higher water potential (dilute solution) to lower water potential (concentrated solution) through a partially permeable membrane. The potato cells gain water and increase in mass.
12. (a) Average time = (0.62 + 0.65 + 0.63 + 0.64 + 0.66) / 5 = 3.20 / 5 = 0.64 s [1]
Explanation: Sum all readings and divide by the number of readings.
(b) Systematic error: An error that causes readings to be consistently shifted in one direction (all too high or all too low) due to a fault in the instrument or method. [1] Explanation: Unlike random errors which scatter readings randomly, systematic errors affect all measurements in the same way. Reaction time consistently makes the measured time longer than the actual time.
(c) Any one of: [1]
- Use a light gate and data logger instead of a stopwatch
- Measure time for more oscillations (e.g., 50 instead of 20) to reduce percentage error
- Use video recording with frame-by-frame analysis
- Have the same person start and stop the stopwatch to keep reaction time consistent Explanation: These methods reduce or eliminate human reaction time error.
(d) Accuracy: The average (0.64 s) matches the theoretical value (0.64 s), so the results are accurate. [1] Precision: The readings range from 0.62 to 0.66 s (range = 0.04 s), showing reasonable consistency, so the results are fairly precise. [1] Explanation: Accuracy refers to closeness to the true value. Precision refers to closeness of repeated measurements to each other. The small spread indicates good precision; the match with theoretical value indicates good accuracy.
13. (a) Hypothesis: As light intensity increases (lamp distance decreases), the rate of photosynthesis increases. [1]
Explanation: A hypothesis is a testable prediction stating the expected relationship between variables.
(b) Independent variable: Distance of lamp from plant (or light intensity) [1] Dependent variable: Number of bubbles per minute (rate of photosynthesis) [1] Explanation: The independent variable is changed; the dependent variable is measured.
(c) Any two of: [2]
- Type/species of water plant
- Mass/length of plant
- Volume of water
- Temperature of water
- Concentration of CO₂ (e.g., add sodium hydrogen carbonate)
- Time of counting bubbles (1 minute) Explanation: These must be kept constant to ensure only light intensity affects the rate.
(d) As the distance of the lamp from the plant increases, the number of bubbles per minute decreases (rate of photosynthesis decreases). [1] Explanation: The data shows a clear decreasing trend: 48 → 32 → 20 → 12 → 6 bubbles/min as distance increases from 10 to 50 cm.
(e) Explanation: [2]
- Light provides energy for photosynthesis; higher light intensity provides more energy [1]
- More energy allows more water molecules to be split (photolysis), producing more oxygen bubbles [1] Explanation: Light intensity is a limiting factor for photosynthesis. At low light intensity, the rate is limited by the amount of light energy available for the light-dependent reactions.
14. (a) Volume of stone = Final reading – Initial reading = 68 cm³ – 50 cm³ = 18 cm³ [1]
Explanation: The displacement method measures volume by the amount of water displaced.
(b) Density = Mass / Volume = 54 g / 18 cm³ = 3.0 g/cm³ [2] Working: 1 mark for correct formula/substitution, 1 mark for correct answer with units. Explanation: Density is mass per unit volume. Units must be consistent (g and cm³ gives g/cm³).
(c) Variation may be due to: [1]
- Parallax error when reading the meniscus
- Water splashing or droplets on the stone affecting the reading
- Stone not fully submerged or touching the sides
- Random fluctuations in reading the measuring cylinder Explanation: Random errors cause scatter in repeated measurements. The displacement method is sensitive to reading technique and water surface effects.
Section C: Data Analysis and Experimental Design (12 marks)
15. (a) Period calculations: [1]
- 40 cm: 25.4 / 20 = 1.27 s ✓
- 50 cm: 28.4 / 20 = 1.42 s ✓
- 60 cm: 31.0 / 20 = 1.55 s ✓
- 70 cm: 33.4 / 20 = 1.67 s ✓ Marking: 1 mark for all four correct (allow 1 error for 0 marks).
(b) Graph requirements: [3]
- Axes labeled with units: x-axis "Length L (cm)", y-axis "Period T (s)" [1]
- Appropriate scales using >50% of grid, points plotted correctly [1]
- Smooth curve of best fit (not straight line) [1] Explanation: The relationship is T ∝ √L, so the graph should be a curve increasing with decreasing gradient.
(c) As the length of the pendulum increases, the period increases. The relationship is not linear; period increases with the square root of length (T ∝ √L). [1] Explanation: The period of a simple pendulum is given by T = 2π√(L/g). The graph curves upward but with decreasing slope.
(d) From graph: At L = 45 cm, T ≈ 1.34 – 1.36 s [1] Explanation: Read from the candidate's graph at 45 cm. Accept values consistent with their plotted curve.
(e) New investigation variables: [3]
- Independent variable: Mass of pendulum bob
- Dependent variable: Period of pendulum (time for one oscillation)
- Controlled variables (any three): Length of pendulum, angle of release (amplitude), number of oscillations timed, gravitational field strength (same location), same string/rod Explanation: To test the effect of mass, only mass should change. Length must be constant because it affects period. Angle should be small and constant.
16. (a) Density calculations: [3]
Liquid A: Mass of liquid = 95.0 – 45.0 = 50.0 g; Density = 50.0 g / 50 cm³ = 1.00 g/cm³ [1] Liquid B: Mass of liquid = 115.0 – 45.0 = 70.0 g; Density = 70.0 g / 50 cm³ = 1.40 g/cm³ [1] Liquid C: Mass of liquid = 80.0 – 45.0 = 35.0 g; Density = 35.0 g / 50 cm³ = 0.70 g/cm³ [1] Marking: 1 mark each for correct mass and density with units.
(b) Order from top to bottom: C (0.70 g/cm³), A (1.00 g/cm³), B (1.40 g/cm³) [1] Explanation: Less dense liquids float on denser liquids. The liquid with the lowest density (C) will be at the top, highest density (B) at the bottom.
(c) Corrected mass of cylinder + liquid B = 115.0 – 2.0 = 113.0 g [1] Corrected mass of liquid B = 113.0 – 45.0 = 68.0 g [1] Corrected density = 68.0 g / 50 cm³ = 1.36 g/cm³ [1] Wait - recheck marks allocation: The question asks for 2 marks. Let's adjust:
- Corrected mass of liquid: 115.0 – 2.0 – 45.0 = 68.0 g [1]
- Corrected density: 68.0 / 50 = 1.36 g/cm³ [1] Total 2 marks. The zero error of +2.0 g means all readings are 2.0 g too high, so subtract 2.0 g.
17. Experimental Design for Parachute Investigation [11 marks total]
Hypothesis: [1]
- As the surface area of the parachute increases, the time taken to fall a fixed distance increases (or: larger surface area → longer fall time / slower descent).
Variables: [2]
- Independent: Surface area of parachute (e.g., 100 cm², 200 cm², 300 cm², 400 cm², 500 cm²)
- Dependent: Time taken to fall a fixed distance (e.g., 2 m)
Controlled variables (any three): [3]
- Mass of parachute + load (use same weight attached)
- Height of drop (fixed distance)
- Shape of parachute (all circular or all square)
- Material of parachute (same type of plastic bag/fabric)
- No wind / still air conditions
- Same method of release
Procedure (4-5 steps): [3]
- Cut parachutes of different surface areas from the same material (e.g., plastic bags).
- Attach identical strings and the same mass (load) to each parachute.
- Hold the parachute at a fixed height (e.g., 2 m) and release it.
- Use a stopwatch to measure the time taken to reach the ground.
- Repeat each surface area 3 times and calculate the average time.
Reliability: [1]
- Repeat each measurement at least 3 times and calculate the average.
- Or: Use a light gate / video analysis for more precise timing.
Presentation of results: [1]
- Table with columns: Surface area (cm²), Time 1 (s), Time 2 (s), Time 3 (s), Average time (s)
- Graph: Line graph of average time (y-axis) against surface area (x-axis)
18. (a) Reading = Main scale reading + Vernier scale reading = 2.4 cm + 0.06 cm = 2.46 cm [1]
Explanation: Main scale: zero of vernier is past 2.4 cm but before 2.5 cm → 2.4 cm. Vernier: 6th division aligns → 6 × 0.01 cm = 0.06 cm (assuming 0.01 cm least count).
(b) Corrected reading = Observed reading – Zero error = 2.46 cm – (–0.03 cm) = 2.46 cm + 0.03 cm = 2.49 cm [1] Explanation: Negative zero error means the instrument reads lower than actual. Subtracting a negative error adds the correction.
(c) Positive zero error: When the jaws are closed, the zero of the vernier scale is to the right of the main scale zero. Readings are larger than actual; correction is subtracted. [1] Negative zero error: When the jaws are closed, the zero of the vernier scale is to the left of the main scale zero. Readings are smaller than actual; correction is added. [1] Explanation: Zero error occurs when the instrument does not read zero when the jaws are closed. Positive = reads positive when closed; negative = reads negative when closed.
19. (a) Any two of: [2]
- Volume of water (100 cm³)
- Initial temperature (80°C)
- Room temperature / ambient conditions
- Type/size/shape of beaker (for first experiment)
- No stirring / consistent stirring method
- Same thermometer
(b) The graph shows a steep temperature drop initially, which gradually becomes less steep, approaching room temperature asymptotically (curved line decreasing with decreasing gradient). [1] Explanation: Cooling follows Newton's Law of Cooling: rate of cooling is proportional to temperature difference with surroundings. Largest difference at start → fastest cooling.
(c) Prediction: The cooling curve for the polystyrene cup will be less steep (cooling slower) than for the beaker. [1] Explanation: Polystyrene is a better insulator (traps air) than glass/beaker material, reducing heat loss by conduction and convection. [1]
(d) Source of random error: [1]
- Parallax error reading thermometer
- Slight variations in room temperature / draughts
- Inconsistent stirring
- Reaction time in reading at exact minute intervals
How to minimise: [1]
- Use a digital temperature probe / data logger for continuous recording
- Conduct in a draught-free environment
- Stir gently and consistently / use magnetic stirrer
- Read thermometer at eye level
20. (a) Independent variable: Type of insulating material [1]
Dependent variable: Temperature after 10 minutes (or temperature drop) [1]
(b) Any three of: [3]
- Volume of water (100 cm³)
- Initial temperature (80°C)
- Size/shape/material of beakers
- Thickness/layers of insulation (should be same for all)
- Time of cooling (10 minutes)
- Room temperature / environment
- Same thermometer
(c) Best insulator: Bubble wrap [1] Explanation: Bubble wrap shows the highest temperature after 10 minutes (65°C), meaning it lost the least heat (smallest temperature drop of 15°C). The control (no insulation) dropped to 52°C (drop of 28°C). [1] Marking: 1 mark for correct identification, 1 mark for explanation using data comparison.
(d) The control (no insulation) provides a baseline to compare the effectiveness of each insulating material. It shows how much the temperature would drop without any insulation, allowing the student to determine if a material actually reduces heat loss. [1] Explanation: A control experiment isolates the effect of the independent variable by showing the result when the variable is absent (no insulation).
Free quiz and exam paper access
Enter your details to view this paper
Your access is remembered on this device.