AI Generated Quiz
Secondary 1 Science Scientific Inquiry Quiz
Free Sec 1 Science Scientific Inquiry quiz, Kimi2.6 AI version, with questions, answers, and syllabus-aligned practice for Singapore students.
These static practice materials are generated from the site's syllabus and paper-generation workflow, with source and model context shown so students and parents can evaluate the material before use.
Questions
Secondary 1 Science Quiz - Scientific Inquiry
Name: _________________________________ Class: _______________ Date: _______________
Duration: 30 minutes
Total Marks: 40
Score: _________ / 40
Instructions:
- Answer all questions.
- Write your answers in the spaces provided.
- For calculation questions, show your working clearly.
- Use appropriate units in all answers.
Section A: Multiple Choice (Questions 1–5)
Choose the correct answer. Each question carries 2 marks.
[5 × 2 = 10 marks]
1. A student measures the length of a pencil using a ruler with mm markings. Which reading demonstrates the correct use of significant figures?
A) 12 cm
B) 12.3 cm
C) 12.34 cm
D) 12.345 cm
Your answer: _______________
2. In an experiment to find how the angle of a ramp affects the speed of a toy car, which variable must be kept constant?
A) The angle of the ramp
B) The type of toy car used
C) The speed of the toy car
D) The distance travelled by the car
Your answer: _______________
3. Which of the following describes a systematic error?
A) A reading that is randomly higher or lower than the true value
B) An error caused by a faulty zero adjustment on an instrument
C) A mistake made when recording data in a table
D) Variation in measurements due to human reaction time
Your answer: _______________
4. A student records these measurements of a liquid's temperature: 24.5 °C, 24.7 °C, 24.6 °C, 35.2 °C, 24.5 °C. What is the best way to report the result?
A) 24.6 °C
B) 24.5 °C
C) 26.7 °C (the mean of all five)
D) 24.6 °C (the mean excluding the anomalous value)
Your answer: _______________
5. Which precaution best reduces parallax error when reading a measuring cylinder?
A) Taking multiple readings and averaging them
B) Placing the cylinder on a flat, level surface
C) Viewing the meniscus at eye level, perpendicular to the scale
D) Using a smaller diameter measuring cylinder
Your answer: _______________
Section B: Short Answer (Questions 6–14)
Answer in the spaces provided. Marks are shown for each question.
[18 marks]
6. State the difference between accuracy and precision in measurement. [2 marks]
7. A student wants to investigate the hypothesis: "Plants grow taller when given more water." Identify the independent variable, dependent variable, and one controlled variable for this investigation. [3 marks]
Independent variable: _________________________________________________
Dependent variable: ___________________________________________________
Controlled variable: ___________________________________________________
8. Explain why a measurement of 50 cm³ using a 100 cm³ measuring cylinder is likely to be less precise than 50 cm³ measured using a 50 cm³ measuring cylinder. [2 marks]
9. A thermometer has a zero error of +2 °C. The thermometer reads 38 °C when placed in warm water. What is the actual temperature of the water? Show your working. [2 marks]
Working:
Answer: _____________________________________________________________
10. Suggest why repeating an experiment three times and calculating a mean gives more reliable results than a single measurement. [2 marks]
11. The following data shows the mass of salt dissolved in water at different temperatures:
| Temperature (°C) | 20 | 40 | 60 | 80 | 100 |
|---|---|---|---|---|---|
| Mass dissolved (g) | 36 | 42 | 48 | 55 | 64 |
Describe the pattern shown in this data. [2 marks]
12. A student measures the thickness of a single page of a book by measuring the total thickness of 50 pages and dividing by 50.
(a) Name this measurement technique. [1 mark]
(b) Explain why this method gives a more precise result than measuring one page directly with a ruler. [2 marks]
13. List two ways a student could improve the reliability of an experiment investigating how quickly sugar dissolves in water at different temperatures. [2 marks]
14. Explain the difference between a fair test and a blind trial in scientific investigations. [2 marks]
Section C: Structured Response (Questions 15–20)
Answer in the spaces provided. Marks are shown for each question.
[12 marks]
15. A group of students investigate how the length of a pendulum affects its period of swing. They time 20 complete swings for pendulums of different lengths.
(a) Explain why timing 20 swings and dividing by 20 is better than timing a single swing. [2 marks]
(b) Suggest two sources of random error in this experiment and how to reduce each. [2 marks]
16. Muthu measures the diameter of a circular coin using a ruler and records it as 23 mm. Leela uses vernier calipers and records 23.4 mm. The actual diameter is 23.35 mm.
(a) Whose result is more accurate? Explain your answer. [2 marks]
(b) Whose result is more precise? Explain your answer. [2 marks]
17. The following set of readings was obtained when measuring the mass of a beaker: 47.2 g, 47.3 g, 47.2 g, 48.9 g, 47.2 g.
(a) Identify which reading is anomalous and suggest a possible cause. [2 marks]
(b) Calculate the mean mass of the beaker, showing your working clearly. [2 marks]
Working:
Answer: _____________________________________________________________
18. Design a simple experiment to test whether the type of surface affects the time for an ice cube to melt. Your answer should include: the independent and dependent variables, two controlled variables, and how you would make the results reliable. [3 marks]
19. A digital stopwatch reads 0.00 s before the start button is pressed, but when started and immediately stopped, it shows 0.02 s. Explain what type of error this is and how it affects measurements of very short time intervals. [2 marks]
20. The graph below shows how the extension of a spring changes with the mass hung from it.
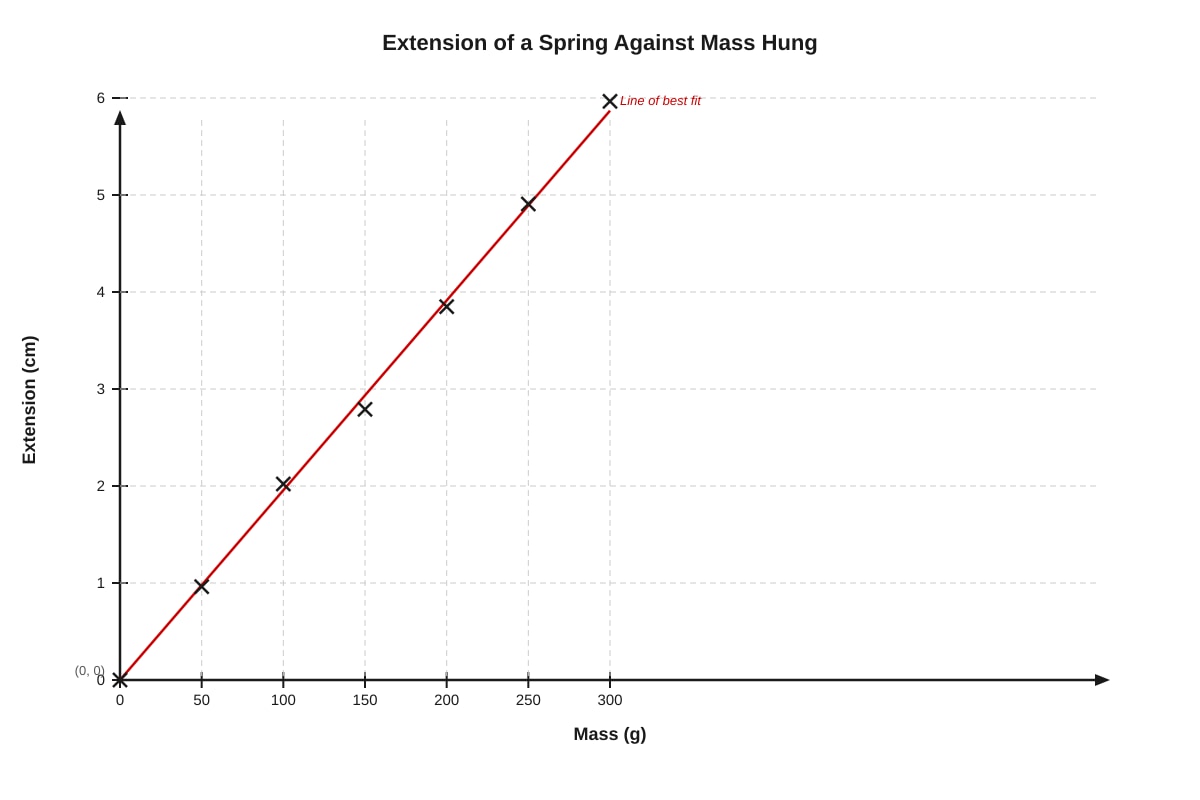
Generated graph for Q20.
(a) Use the graph to predict the extension when a mass of 175 g is hung from the spring. Show your method on the graph and write your answer. [2 marks]
Method shown on graph: [Tick box for examiner] □
Answer: _____________________________________________________________
(b) State why it would be unreliable to use this graph to predict the extension for a mass of 500 g. [1 mark]
END OF QUIZ
Answers
Secondary 1 Science Quiz - Scientific Inquiry: Answer Key
Total Marks: 40
Section A: Multiple Choice (Questions 1–5)
1. Answer: B) 12.3 cm [2 marks]
Teaching note: A ruler with mm markings can be read to the nearest mm, giving one decimal place in cm. Significant figures reflect the precision of the measuring instrument. You cannot claim more precision than your instrument allows. Option A (12 cm) ignores the mm markings; C and D claim precision beyond what the instrument can measure.
2. Answer: B) The type of toy car used [2 marks]
Teaching note: In a fair test, only the independent variable (ramp angle, A) is changed. The dependent variable (speed/distance measurements, C and D) is what you measure as a result. Controlled variables must be kept constant so they don't affect the outcome. The type of car affects speed due to wheel friction and mass, so it must be controlled.
3. Answer: B) An error caused by a faulty zero adjustment on an instrument [2 marks]
Teaching note: Systematic errors are consistent, repeatable biases that affect all measurements in the same direction. They often come from instrument faults (zero error, calibration error) or experimental setup. Random errors (A, D) vary unpredictably; mistakes (C) are human errors, not measurement errors.
4. Answer: D) 24.6 °C (the mean excluding the anomalous value) [2 marks]
Teaching note: The value 35.2 °C is clearly anomalous—much higher than the other four consistent readings (which span only 0.2 °C). Anomalous results are typically caused by mistakes in reading or recording. Including it would distort the mean. Always check for anomalies and exclude them before calculating, but note that you did so.
Working for verification: (24.5+24.7+24.6+24.5)÷4=98.3÷4=24.575≈24.6 °C
5. Answer: C) Viewing the meniscus at eye level, perpendicular to the scale [2 marks]
Teaching note: Parallax error occurs when your eye is not level with the measurement mark, causing the reading to appear different from the true value. This is a systematic viewing error that changes with viewing angle. Option A improves reliability; B ensures stability but not reading accuracy; D improves precision but doesn't address parallax.
Section B: Short Answer (Questions 6–14)
6.
- Accuracy refers to how close a measurement is to the true or accepted value [1 mark]
- Precision refers to how close repeated measurements are to each other, showing consistency and fine scale division [1 mark]
Teaching note: A measurement can be precise (consistent readings) but not accurate (if there's a systematic error like zero error). Conversely, a single accurate reading lacks evidence of precision. Best practice: precise and accurate.
7.
- Independent variable: Amount of water given to the plants [1 mark]
- Dependent variable: Height of plants / growth of plants [1 mark]
- Controlled variable: Any one from: type/age of plant, type of soil, amount of light, temperature, pot size, initial height [1 mark]
Teaching note: The independent variable is what you deliberately change; the dependent variable is what you measure as a result. Controlled variables are kept constant to ensure that only the independent variable affects your results. Without controls, you cannot establish cause and effect.
8.
- A 100 cm³ measuring cylinder has wider graduations/spacing (typically 2 cm³ or 5 cm³ divisions) [1 mark]
- A 50 cm³ measuring cylinder has finer graduations (typically 1 cm³ divisions), allowing readings closer to the true value / smaller percentage uncertainty [1 mark]
Teaching note: Precision depends on scale division. The same absolute error (e.g., ±1 cm³) becomes a larger percentage error for smaller volumes or on instruments with coarse scales. For 50 cm³ in a 100 cm³ cylinder: likely ±2 cm³ uncertainty; in a 50 cm³ cylinder: ±1 cm³ or ±0.5 cm³.
9.
Actual temperature = Measured reading − Zero error [1 mark for correct method]
38−(+2)=36 °C [1 mark]
Teaching note: A positive zero error means the instrument reads higher than the true value when it should read zero. You must subtract the error to correct readings. Common mistake: adding the error instead of subtracting—this would give 40 °C, which is wrong. Always think: "Does my instrument read too high or too low?"
10.
- Random errors affect measurements in unpredictable directions [1 mark]
- Taking the mean of repeated readings reduces the effect of random errors / outliers, giving a value closer to the true result [1 mark]
Teaching note: Repeats don't eliminate systematic errors (same bias every time), but they do reduce random variation. The mean of several measurements is generally more reliable than a single measurement, assuming no systematic error exists.
11.
- As temperature increases, the mass of salt dissolved increases [1 mark]
- The relationship is not linear / the rate of increase rises at higher temperatures (or "the increase is greater at higher temperatures") [1 mark]
Teaching note: From 20→40 °C: increase of 6 g; 40→60 °C: +6 g; 60→80 °C: +7 g; 80→100 °C: +9 g. The pattern shows positive correlation with slightly accelerating increase. Don't just say "it goes up"—describe the nature of the change.
12.
(a) The technique is called the accumulation method (or "measuring multiple items and dividing") [1 mark]
(b)
- A single page is too thin to measure reliably with a standard ruler (minimum precision ~1 mm, and thickness << 1 mm) [1 mark]
- Measuring 50 pages together gives a total thickness large enough to measure accurately; dividing by 50 reduces percentage uncertainty / gives a more precise average thickness per page [1 mark]
Teaching note: This is a practical application of error reduction. If total thickness = 5.0 mm for 50 pages, each page = 0.10 mm. The ruler can measure 5.0 mm ±0.5 mm (10% error); dividing gives 0.10 ± 0.01 mm per page. Direct measurement of one page: ~0.1 mm, error ±0.5 mm = 500% error!
13. Any two from:
- Repeat the experiment multiple times and calculate a mean [1 mark]
- Use the same volume/mass of water each time [1 mark]
- Use the same type and mass of sugar [1 mark]
- Stir at a consistent rate/use a magnetic stirrer [1 mark]
- Use a water bath for accurate temperature control [1 mark]
- Use the same starting temperature [1 mark]
Teaching note: Reliability means getting consistent results when conditions are repeated. Control what you can, and repeat to check consistency.
14.
- A fair test ensures only one variable is changed while all others are kept constant, so any observed effect is caused by that variable [1 mark]
- A blind trial is when participants don't know which treatment they receive, used to eliminate bias from expectations (especially in medicine/psychology) [1 mark]
Teaching note: Fair testing is fundamental experimental design; blinding is specific to research involving human subjects or assessors, preventing placebo effects or observer bias. They serve different purposes—fair test for cause-effect validity, blind trial for eliminating human bias.
Section C: Structured Response (Questions 15–20)
15.
(a)
- Human reaction time in starting/stopping the stopwatch causes random error (~0.2–0.3 s per timing) [1 mark]
- Timing 20 swings and dividing makes this reaction time error a much smaller fraction of the total time (error is spread over 20 swings, so uncertainty per swing is reduced by factor of 20) [1 mark]
Teaching note: If reaction time uncertainty = ±0.3 s, for one swing (period ~0.8 s): ~40% error. For 20 swings (16 s total): ±0.3 s / 16 s ≈ 2% error. Dividing by 20: ±0.015 s per swing. This is a crucial application of accumulating measurements.
(b) Any two from:
| Source of random error | How to reduce |
|---|---|
| Human reaction time in starting/stopping | Use electronic timing with light gate/automatic sensor [1 mark] |
| Small variations in release angle/amplitude | Use a fixed release mechanism / keep amplitude small and consistent [1 mark] |
| Counting swings incorrectly | Use a video recording to review / have two people count [1 mark] |
| Air movement/wind | Conduct in still air / closed room [1 mark] |
[2 marks total: 1 for each valid pair]
16.
(a) Leela's result (23.4 mm) is more accurate [1 mark] because it is closer to the true value of 23.35 mm (difference 0.05 mm) than Muthu's 23 mm (difference 0.35 mm) [1 mark]
(b) Leela's result is more precise [1 mark] because vernier calipers measure to 0.1 mm (one decimal place), showing finer scale division than a ruler measuring to 1 mm (whole mm only) [1 mark]
Teaching note: Leela's 23.4 mm has three significant figures vs. Muthu's two. Even though 23.4 mm is 0.05 mm above true value, it demonstrates both better accuracy and precision. Note that 23.4 could be 23.35 rounded, or there could be slight systematic error in the calipers—but it's still superior data.
17.
(a) The anomalous reading is 48.9 g [1 mark]. Possible cause: reading error / misplacing the decimal point / recording error / using a different balance / not zeroing the balance properly / external interference [1 mark]
(b) Mean = (47.2+47.3+47.2+47.2)÷4 [calculation set-up shown: 1 mark]
=188.9÷4=47.225 g, or 47.2 g (or 47.23 g) to appropriate significant figures [1 mark]
Teaching note: Always show the calculation explicitly. The anomalous 48.9 g must be excluded. To 3 significant figures: 47.2 g; to 2 decimal places: 47.23 g. Since the data has 1 decimal place, 47.2 g is appropriate. Common error: including 48.9 gives mean 47.56 g—which is wrong.
18.
| Element | Student's answer |
|---|---|
| Independent variable | Type of surface (e.g., wood, metal, plastic, cloth) [1 mark] |
| Dependent variable | Time taken for ice cube to melt completely [must relate to time] |
| Controlled variables (any two) | Same mass/size of ice cubes; same starting temperature of ice; same room temperature/airflow; same volume of any liquid on surface; same size/shape of container [1 mark for two valid] |
| Reliability | Repeat the experiment with identical ice cubes on each surface at least 3 times and calculate mean time; use a stopwatch for all timings [1 mark] |
[3 marks total]
Teaching note: Good experimental design always explicitly identifies variables and includes repetition. "Time to melt" is better than "amount melted" because it's a clear quantitative measurement. Avoid saying "amount of heat"—that's harder to control than environmental conditions.
19.
- This is a systematic error (specifically, zero error in timing) [1 mark]
- It causes all short time measurements to be approximately 0.02 s too long; for very short intervals (e.g., 0.1 s), this represents a huge percentage error (~20%), making such measurements unreliable [1 mark]
Teaching note: The consistent +0.02 s offset is systematic. For a 10 s measurement: 0.02 s is 0.2% error—negligible. For 0.1 s: 20% error—unacceptable. This explains why electronic timing with trigger gates is essential for fast events.
20.
(a) From the line of best fit: at 175 g, read across to the line and down to the extension axis [method correct: 1 mark]
Expected extension ≈ 3.5 cm (acceptable range 3.4–3.6 cm depending on exact line drawn) [1 mark]
Teaching note: On the described graph with points (150, 2.9) and (200, 4.0), linear interpolation: gradient = (4.0−2.9)/(200−150)=1.1/50=0.022 cm/g. At 175 g: 2.9+0.022×25=2.9+0.55=3.45 cm. Alternatively, the line of best fit gives approximately constant gradient ~0.02 cm/g, so 175 × 0.02 = 3.5 cm.
(b) 500 g may exceed the elastic limit of the spring / may cause permanent deformation / the graph's linear relationship (Hooke's law region) may not extend that far / the spring may break [1 mark]
Teaching note: Hooke's law (extension ∝ force) applies only within the elastic limit. Extrapolation beyond measured data is risky—you don't know if the behavior continues. Springs can stretch permanently or snap. Real data: 300 g gives 6.2 cm; linear extrapolation predicts ~10.3 cm, but this may not hold.
END OF ANSWER KEY
Free quiz and exam paper access
Enter your details to view this paper
Your access is remembered on this device.