AI Generated Quiz
Secondary 1 Science Scientific Inquiry Quiz
Free Sec 1 Science Scientific Inquiry quiz, HY3 AI version, with questions, answers, and syllabus-aligned practice for Singapore students.
These static practice materials are generated from the site's syllabus and paper-generation workflow, with source and model context shown so students and parents can evaluate the material before use.
Questions
Free quiz and exam paper access
Enter your details to view this paper
Your access is remembered on this device.
Answers
Secondary 1 Science Quiz - Scientific Inquiry (Answer Key)
Total Marks: 40
Topic: Scientific Inquiry
Level: Secondary 1
Section A (1 mark each)
1. A hypothesis is a suggested explanation or testable statement about what you think will happen in an investigation.
Teaching note: It is written before the experiment and can be tested by collecting data. Not the same as a guess — it should be based on observation.
2. The independent variable is the amount of light (or light intensity).
Teaching note: The independent variable is changed by the investigator to see its effect.
3. Measuring cylinder (or graduated cylinder).
Teaching note: Other acceptable: burette (not in syllabus but accepted). Ruler measures length, not liquid volume.
4. Degree Celsius (°C).
Teaching note: Laboratory thermometer reads in °C. Kelvin not used at this level.
5. Controlled variable (or constant variable).
Teaching note: Kept same so only the independent variable affects the result.
Section B (2 marks each)
6.
(a) Hypothesis: "Bean plants given more fertilizer will grow taller." [1]
(b) Constant: same amount of water / same type of soil / same light [1]
Teaching note: Hypothesis must mention both variables. Constant must be a factor not being tested.
7. A control set-up allows comparison [1] to show that the change in results is due to the independent variable and not other factors [1].
Teaching note: E.g., a plant with no fertilizer shows normal growth to compare against fertilized ones.
8. Precautions for flammable symbol: keep away from open flames [1]; use water bath instead of direct heating [1].
Teaching note: Any two sensible: no smoking, store in cool place.
9. Unit: gram (g) [1]. Recording unit is important because the number alone does not tell the quantity clearly and may cause wrong comparison [1].
Teaching note: 24.5 without g is meaningless; 24.5 kg is very different.
10. Instrument: digital stopwatch [1]. Physical quantity: time interval [1].
Teaching note: Not "speed" — stopwatch measures time, not speed.
11. Corrosive: destroys skin or metal [1]. Toxic to environment: harms living things in nature [1].
Teaching note: Must state effect, not just name the symbol.
12. Repeating measurements: improves reliability [1]; helps find average / identifies errors [1].
Teaching note: One repeat is not enough; 3 trials typical.
13. X-axis represents time (minutes). [1] Because time is the variable changed/recorded steadily [1].
Teaching note: In heating graphs, time is independent, plotted on x.
14. Prediction tells what will happen [1]; hypothesis gives a testable explanation why [1].
Teaching note: "It will grow" = prediction; "because light helps photosynthesis" = hypothesis part.
15. Dependent variable: height of bounce (or bounce height). [1] (second mark if clearly stated)
Marking: Full 2 if explained: "the bounce height measured after drop" [1+1].
Teaching note: Depends on independent (drop height).
Section C
16. [Total 4]
(a) Independent: whether stirring is done or not (stirred vs not stirred) [1]
(b) Dependent: time taken for sugar to dissolve [1]
(c) Constant: same amount of water, same temperature, same mass of sugar, same type of sugar [2 for any two]
Teaching note: Fair test needs only one changed variable.
17. [Total 4]
(a) Trend: height increases with more water up to 30 mL, then levels off [1].
(b) Conclusion: More water helps plant grow taller, but after 30 mL extra water does not increase height much [2].
(c) Reason: plant may have enough water at 30 mL; extra water not used / pot limits growth [1].
Teaching note: Conclusion must link to aim and data.
18. [Total 4]
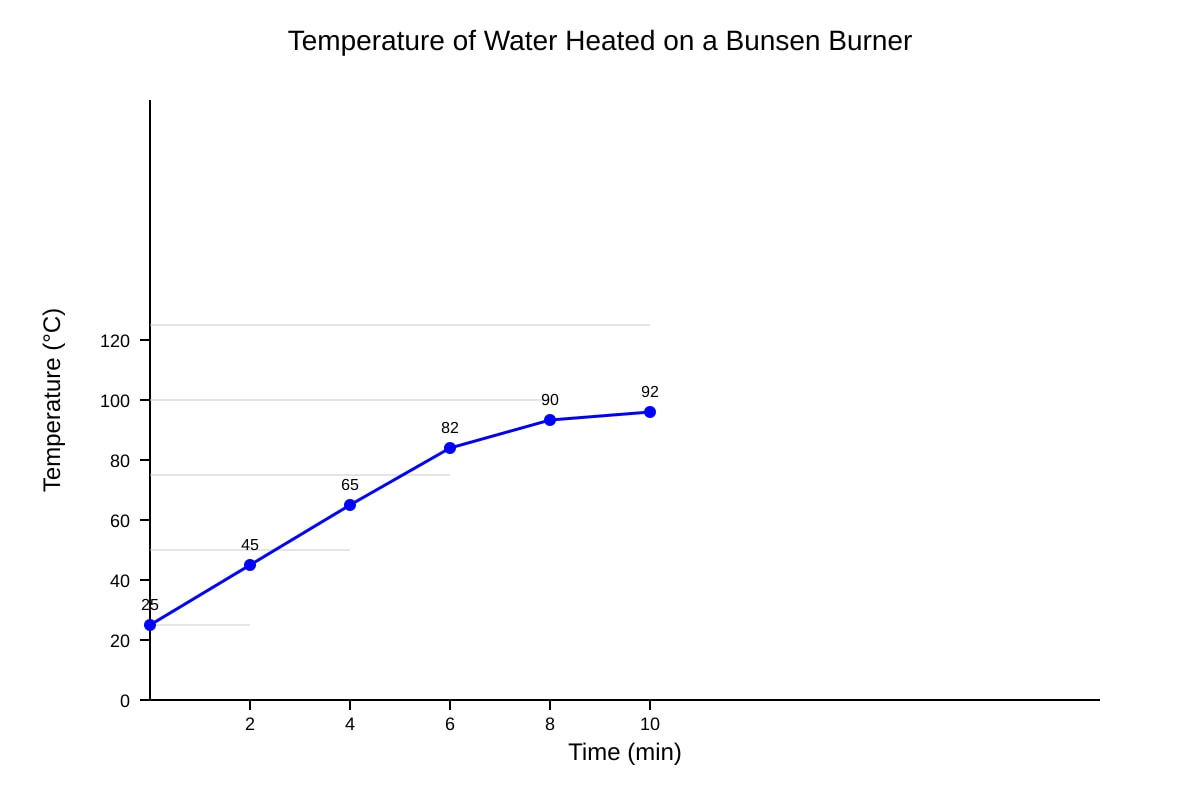
(a) 65 °C [1]
(b) Temperature rises quickly at first then increase slows and plateaus near 92 °C [2].
(c) Improvement: use data logger for more accurate readings / repeat and average [1].
Teaching note: From placeholder graph points at (4,65). Plateau shows heating limit.
19. [Total 4]
(a) It is a prediction because it states what will happen ("more paper clips") [1]; the "because" part is reason but overall form is if–then prediction [1]. (Accept hypothesis if justified as testable explanation.)
(b) Fair test: use same type and number of paper clips [1], same distance, same brand of magnet except strength [1].
Teaching note: Only magnet strength changed.
20. [Total 4]
Correct order: aim → hypothesis → variables → data collection → conclusion [4, 1 each, in sequence]
Teaching note: Aim first, then guess (hypothesis), plan variables, collect data, conclude.