From Real Exams Quiz

Secondary 1 Science Scientific Inquiry Quiz

Free Sec 1 Science Scientific Inquiry quiz with questions, answers, and syllabus-aligned practice for Singapore students preparing for school assessments.

These static practice materials are generated from the site's syllabus and paper-generation workflow, with source and model context shown so students and parents can evaluate the material before use.

Secondary 1 Science From Real Exams Generated by NVIDIA Nemotron 3 Ultra 550B A55B Free Updated 2026-06-14

Questions

<!-- TuitionGoWhere generation metadata: stage=3-0; model=nvidia/nemotron-3-ultra-550b-a55b:free; model_label=NVIDIA Nemotron 3 Ultra 550B A55B Free; generated=2026-06-14; Sources: Stage 2-1 real exam-derived templates and Stage 2-2 exam-enriched syllabus. -->

Secondary 1 Science Quiz - Scientific Inquiry

Name: ___________________________
Class: ___________________________
Date: ___________________________
Score: ______ / 40

Duration: 45 minutes
Total Marks: 40

Instructions:

  • Answer all questions.
  • Write your answers in the spaces provided.
  • For calculation questions, show your working clearly.
  • Diagrams are not drawn to scale unless stated.

Section A: Multiple Choice Questions (10 marks)

Questions 1 to 10 carry 1 mark each. Choose the correct answer and write its letter (A, B, C, or D) in the box provided.

1. A student measures the length of a metal rod using a ruler. The student's eye is not directly above the marking on the ruler. Which type of error is this?

A. Zero error
B. Parallax error
C. Random error
D. Systematic error

Answer:

2. In an experiment to investigate the effect of temperature on the rate of dissolving sugar, which variable is the independent variable?

A. Mass of sugar
B. Temperature of water
C. Time taken for sugar to dissolve
D. Volume of water

Answer:

3. A student records the following readings for the diameter of a wire using a micrometer screw gauge: 0.45 mm, 0.46 mm, 0.44 mm, 0.45 mm, 0.47 mm. What is the average diameter?

A. 0.45 mm
B. 0.454 mm
C. 0.46 mm
D. 0.455 mm

Answer:

4. Which of the following is a hypothesis?

A. The temperature of water rises when heated.
B. If the concentration of acid increases, the rate of reaction will increase.
C. I observed bubbles forming during the reaction.
D. The experiment was repeated three times.

Answer:

5. A student uses a measuring cylinder to measure 25 cm³ of water. The measuring cylinder has graduations every 1 cm³. What is the uncertainty in the measurement?

A. ±0.1 cm³
B. ±0.5 cm³
C. ±1 cm³
D. ±2 cm³

Answer:

6. In a fair test, which variables must be kept constant?

A. Independent and dependent variables
B. Only the independent variable
C. All variables except the independent variable
D. Only the dependent variable

Answer:

7. The diagram below shows a thermometer with a zero error.

<image_placeholder> id: Q7-fig1 type: diagram linked_question: Q7 description: A thermometer showing a reading of -1°C when placed in melting ice (0°C). The mercury thread is slightly below the 0°C mark. labels: 0°C mark, -1°C reading, mercury thread, ice bath values: True temperature = 0°C, Observed reading = -1°C must_show: Thermometer scale from -10°C to 110°C, mercury thread position clearly below 0°C mark, ice bath surrounding bulb </image_placeholder>

What is the zero error of the thermometer? A. +1°C
B. -1°C
C. 0°C
D. Cannot be determined

Answer:

8. A student wants to investigate how the height of a ramp affects the speed of a toy car at the bottom. Which of the following is the dependent variable?

A. Height of the ramp
B. Mass of the toy car
C. Speed of the toy car at the bottom
D. Surface material of the ramp

Answer:

9. Which of the following sets of measurements shows high precision but low accuracy?

A. 9.8, 9.8, 9.8, 9.8 (true value = 9.8)
B. 10.2, 10.2, 10.2, 10.2 (true value = 9.8)
C. 9.5, 10.1, 9.9, 9.7 (true value = 9.8)
D. 9.8, 9.9, 9.7, 9.8 (true value = 9.8)

Answer:

10. A student plots a graph of extension of a spring against force applied. The graph is a straight line passing through the origin. What does this indicate?

A. The spring is damaged.
B. Extension is directly proportional to force.
C. There is a systematic error in the measurements.
D. The spring does not obey Hooke's Law.

Answer:


Section B: Short Answer and Structured Questions (18 marks)

11. A student uses a vernier caliper to measure the external diameter of a cylindrical metal rod. The diagram shows the vernier caliper reading.

<image_placeholder> id: Q11-fig1 type: diagram linked_question: Q11 description: Vernier caliper showing main scale reading of 2.4 cm and vernier scale where the 6th division aligns with a main scale division. Least count = 0.01 cm. labels: Main scale, Vernier scale, 0 mark on vernier, 6th vernier division alignment values: Main scale reading = 2.4 cm, Vernier division aligned = 6, Least count = 0.01 cm must_show: Clear main scale with cm and mm markings, vernier scale with 10 divisions, alignment at 6th division </image_placeholder>

(a) State the main scale reading.
Answer: ________________________________________ [1]

(b) State the vernier scale reading.
Answer: ________________________________________ [1]

(c) Calculate the diameter of the metal rod.
Answer: ________________________________________ [1]

12. In an experiment to investigate the effect of light intensity on the rate of photosynthesis, a student places a lamp at different distances from a water plant and counts the number of bubbles produced per minute.

(a) Identify the independent variable.
Answer: ________________________________________ [1]

(b) Identify the dependent variable.
Answer: ________________________________________ [1]

(c) State two variables that should be kept constant to ensure a fair test.
Answer: ________________________________________ [2]

(d) The student repeats the experiment three times at each distance. Explain why repeating the experiment improves reliability.
Answer: ________________________________________ [1]

13. A student measures the time taken for a pendulum to complete 20 oscillations using a stopwatch. The student repeats the measurement three times and obtains the following readings: 38.2 s, 38.6 s, 38.4 s.

(a) Calculate the average time for 20 oscillations.
Answer: ________________________________________ [1]

(b) Calculate the period of the pendulum (time for one oscillation).
Answer: ________________________________________ [1]

(c) The student's reaction time introduces a random error. Suggest one way to reduce the effect of this random error on the period measurement.
Answer: ________________________________________ [1]

14. The table below shows the results of an experiment investigating the stretching of a spring.

Force / NExtension / cm
00.0
12.1
24.3
36.2
48.5
510.4

(a) Plot the points on the grid below and draw the best-fit line.

<image_placeholder> id: Q14-fig1 type: graph linked_question: Q14 description: Graph paper grid for plotting Force (N) vs Extension (cm). X-axis: Force from 0 to 5 N. Y-axis: Extension from 0 to 11 cm. labels: X-axis: Force / N, Y-axis: Extension / cm, Title: Extension of Spring against Force values: Data points from table: (0,0), (1,2.1), (2,4.3), (3,6.2), (4,8.5), (5,10.4) must_show: Labeled axes with appropriate scales, plotted points, best-fit straight line through origin </image_placeholder>

(b) Using the graph, determine the extension when a force of 2.5 N is applied.
Answer: ________________________________________ [1]

(c) Does the spring obey Hooke's Law? Explain your answer using evidence from the graph.
Answer: ________________________________________ [2]

15. A student measures the volume of a small irregular stone using the displacement method. The diagrams show the measuring cylinder before and after the stone is added.

<image_placeholder> id: Q15-fig1 type: diagram linked_question: Q15 description: Two measuring cylinders side by side. Left: water level at 45 cm³. Right: water level at 58 cm³ with stone submerged. labels: Initial water level, Final water level, Stone, Measuring cylinder graduations values: Initial volume = 45 cm³, Final volume = 58 cm³ must_show: Clear water meniscus, stone fully submerged, graduated scale readable </image_placeholder>

(a) State the volume of the stone.
Answer: ________________________________________ [1]

(b) The student's eye is not level with the water meniscus when taking the reading. Name the type of error this causes.
Answer: ________________________________________ [1]

(c) Suggest one precaution the student should take to obtain an accurate reading.
Answer: ________________________________________ [1]


Section C: Data Analysis and Experimental Design (12 marks)

16. A group of students investigates how the concentration of hydrochloric acid affects the rate of reaction with magnesium ribbon. They measure the volume of hydrogen gas produced every 30 seconds for 3 minutes.

The table shows their results for two different concentrations.

Time / sVolume of H₂ / cm³ (1.0 mol/dm³ HCl)Volume of H₂ / cm³ (2.0 mol/dm³ HCl)
000
301228
602248
903062
1203672
1504078
1804280

(a) Plot a graph of volume of hydrogen gas against time for both concentrations on the same axes.

<image_placeholder> id: Q16-fig1 type: graph linked_question: Q16 description: Graph paper grid for plotting Volume of H₂ (cm³) vs Time (s) for two concentrations. X-axis: Time from 0 to 180 s. Y-axis: Volume from 0 to 90 cm³. labels: X-axis: Time / s, Y-axis: Volume of H₂ / cm³, Title: Volume of Hydrogen Gas Produced Against Time, Legend: 1.0 mol/dm³ HCl, 2.0 mol/dm³ HCl values: Two data series from table above must_show: Labeled axes with appropriate scales, both data series plotted with different markers, smooth curves or best-fit lines, legend </image_placeholder>

(b) Using the graph, determine the initial rate of reaction for 2.0 mol/dm³ HCl. Show your working on the graph.
Answer: ________________________________________ [2]

(c) Explain why the reaction with 2.0 mol/dm³ HCl produces hydrogen gas at a faster rate.
Answer: ________________________________________ [2]

(d) State one safety precaution the students should take when handling hydrochloric acid.
Answer: ________________________________________ [1]

17. A student wants to determine the density of a liquid. The student uses a measuring cylinder and an electronic balance.

(a) Describe the procedure the student should follow to determine the density of the liquid.
Answer: ________________________________________ [3]

(b) The student obtains the following data:

  • Mass of empty measuring cylinder = 45.2 g
  • Mass of measuring cylinder + liquid = 128.7 g
  • Volume of liquid = 85 cm³

Calculate the density of the liquid. Give your answer in g/cm³ to 2 decimal places.
Answer: ________________________________________ [2]

(c) The measuring cylinder has an uncertainty of ±1 cm³. Calculate the percentage uncertainty in the volume measurement.
Answer: ________________________________________ [1]

18. The diagram shows an experiment to investigate the cooling curve of naphthalene.

<image_placeholder> id: Q18-fig1 type: experimental_setup linked_question: Q18 description: Test tube containing naphthalene placed in a beaker of hot water (water bath). Thermometer clamped in the naphthalene. Stopwatch on bench. Bunsen burner heating water bath. labels: Test tube, Naphthalene, Thermometer, Water bath, Beaker, Bunsen burner, Tripod, Gauze, Clamp stand, Stopwatch values: Initial temperature ~90°C, Room temperature ~28°C must_show: Complete water bath setup with heating, thermometer immersed in naphthalene, clamp stand holding test tube </image_placeholder>

(a) State the purpose of using a water bath instead of heating the test tube directly.
Answer: ________________________________________ [1]

(b) The student records the temperature every 30 seconds. The temperature remains constant at 80°C for several minutes. Explain why the temperature remains constant during this time.
Answer: ________________________________________ [2]

(c) On the axes below, sketch the expected cooling curve for naphthalene. Label the axes and indicate the plateau region.

<image_placeholder> id: Q18-fig2 type: graph linked_question: Q18 description: Sketch axes for cooling curve. X-axis: Time / s. Y-axis: Temperature / °C. Show curve starting at ~90°C, decreasing, plateau at 80°C, then decreasing to room temperature. labels: X-axis: Time / s, Y-axis: Temperature / °C, Plateau region labeled "Solidifying at 80°C" values: Starting temp ~90°C, Plateau at 80°C, Final temp ~28°C must_show: Labeled axes, cooling curve with clear plateau, plateau region labeled </image_placeholder>

19. A student hypothesises: "Increasing the surface area of a solid reactant increases the rate of a chemical reaction."

Design an experiment to test this hypothesis using calcium carbonate and hydrochloric acid. In your answer, include:

  • The independent variable
  • The dependent variable
  • Two controlled variables
  • A brief procedure
  • How the results would be analysed to support or refute the hypothesis

Answer: ________________________________________ [5]

20. The table shows the results of an experiment to determine the resistance of a wire at different lengths.

Length of wire / cmCurrent / AVoltage / V
200.451.8
400.231.8
600.151.8
800.111.8
1000.091.8

(a) Calculate the resistance for each length of wire using the formula R = V/I. Complete the table below.

Length of wire / cmResistance / Ω
20
40
60
80
100

Answer: [2]

(b) Plot a graph of resistance against length of wire.

<image_placeholder> id: Q20-fig1 type: graph linked_question: Q20 description: Graph paper grid for plotting Resistance (Ω) vs Length (cm). X-axis: Length from 0 to 100 cm. Y-axis: Resistance from 0 to 25 Ω. labels: X-axis: Length of wire / cm, Y-axis: Resistance / Ω, Title: Resistance of Wire Against Length values: Calculated resistances from part (a) must_show: Labeled axes with appropriate scales, plotted points, best-fit straight line through origin </image_placeholder>

(c) State the relationship between resistance and length of the wire based on your graph.
Answer: ________________________________________ [1]

(d) Predict the resistance of a 120 cm wire of the same material and thickness.
Answer: ________________________________________ [1]


End of Quiz

Answers

<!-- TuitionGoWhere generation metadata: stage=3-0; model=nvidia/nemotron-3-ultra-550b-a55b:free; model_label=NVIDIA Nemotron 3 Ultra 550B A55B Free; generated=2026-06-14; Sources: Stage 2-1 real exam-derived templates and Stage 2-2 exam-enriched syllabus. -->

Secondary 1 Science Quiz - Scientific Inquiry (Answer Key)

Total Marks: 40


Section A: Multiple Choice Questions (10 marks)

1. Answer: B

Explanation: Parallax error occurs when the observer's eye is not positioned directly perpendicular to the scale marking, causing an apparent shift in the reading. This is a common error when using rulers, measuring cylinders, and other analog instruments.

2. Answer: B

Explanation: The independent variable is the variable that is deliberately changed by the experimenter. In this experiment, the temperature of water is being changed to observe its effect on the rate of dissolving.

3. Answer: A

Explanation: Average = (0.45 + 0.46 + 0.44 + 0.45 + 0.47) / 5 = 2.27 / 5 = 0.454 mm. Rounded to 2 decimal places (matching the precision of the readings), the average is 0.45 mm.

4. Answer: B

Explanation: A hypothesis is a testable prediction about the relationship between variables, often written as an "If... then..." statement. Option B predicts that increasing acid concentration will increase reaction rate. Option A is an observation, C is an observation, D is a procedural step.

5. Answer: B

Explanation: The uncertainty of an analog instrument is typically half of the smallest division. For a measuring cylinder with 1 cm³ graduations, the uncertainty is ±0.5 cm³.

6. Answer: C

Explanation: In a fair test, only the independent variable is changed, the dependent variable is measured, and all other variables (controlled variables) are kept constant to ensure that any change in the dependent variable is due only to the independent variable.

7. Answer: B

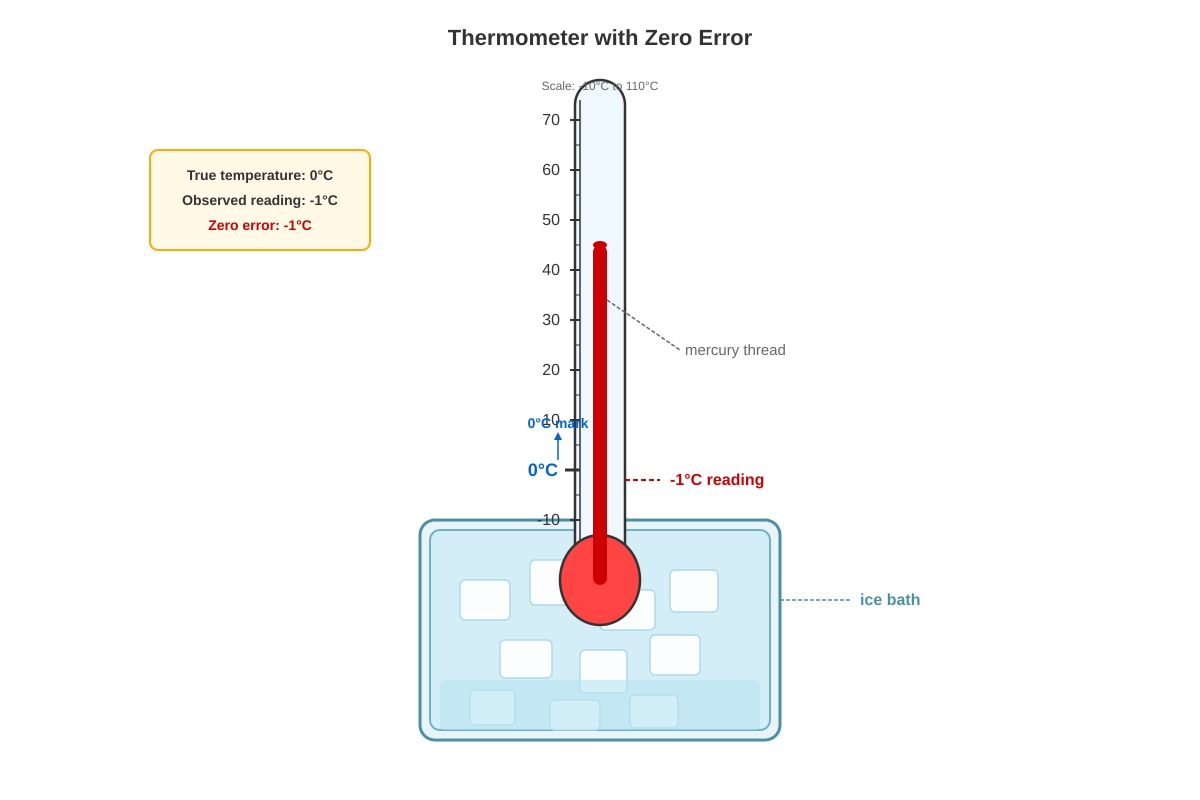
Explanation: Zero error = Observed reading - True value = (-1°C) - (0°C) = -1°C. The thermometer reads -1°C when it should read 0°C, so it has a negative zero error of -1°C. All readings will be 1°C lower than the true value.

8. Answer: C

Explanation: The dependent variable is the variable that is measured or observed in response to changes in the independent variable. Here, the speed of the toy car is measured as the ramp height is changed.

9. Answer: B

Explanation: Precision refers to how close repeated measurements are to each other. Accuracy refers to how close measurements are to the true value. Set B shows high precision (all values are 10.2, very close to each other) but low accuracy (true value is 9.8, readings are consistently 0.4 higher).

10. Answer: B

Explanation: A straight line graph passing through the origin indicates direct proportionality between the two variables. This means extension ∝ force, which is Hooke's Law.


Section B: Short Answer and Structured Questions (18 marks)

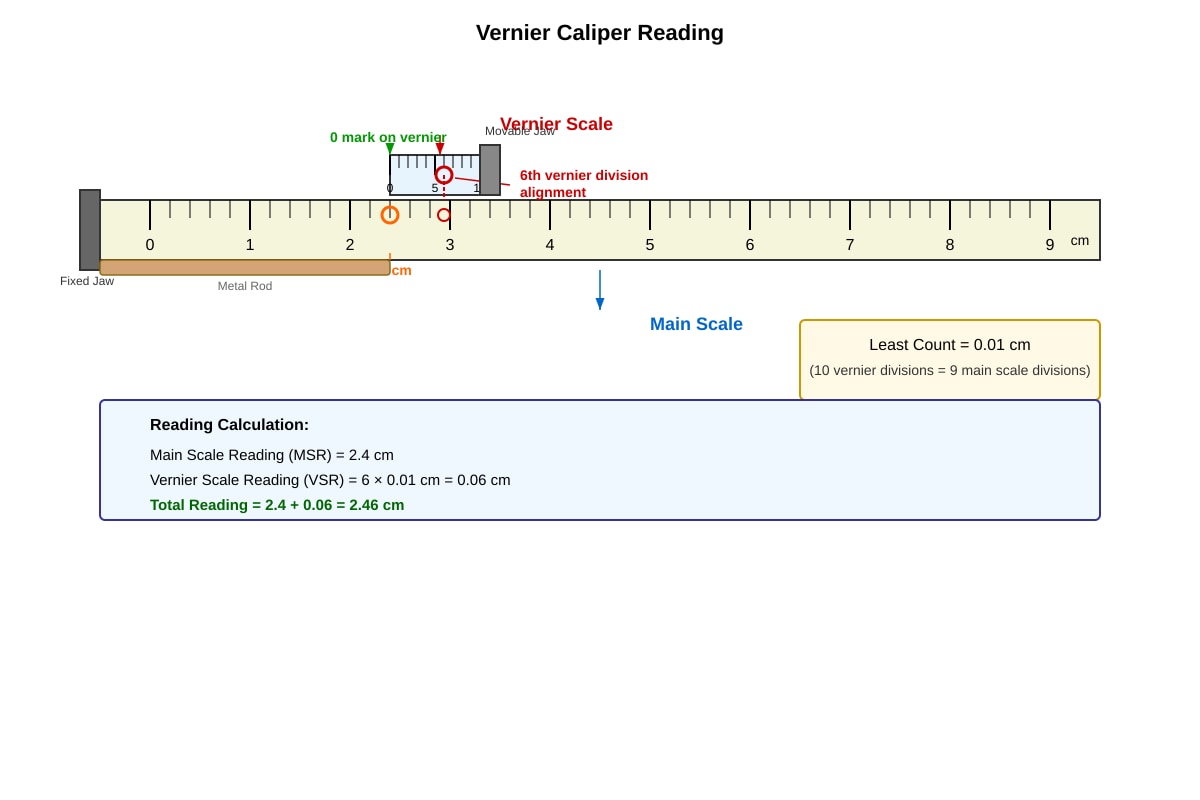
11. (a) Main scale reading: 2.4 cm [1]

(b) Vernier scale reading: 0.06 cm (6 × 0.01 cm) [1] (c) Diameter = 2.4 + 0.06 = 2.46 cm [1]

Explanation: The main scale reading is the value on the main scale just to the left of the vernier zero mark. The vernier reading is the number of the aligned vernier division multiplied by the least count (0.01 cm). Total reading = main scale + vernier scale.

12. (a) Independent variable: Distance of lamp from plant (or light intensity) [1]

(b) Dependent variable: Number of bubbles produced per minute (rate of photosynthesis) [1] (c) Two controlled variables (any two):

  • Type/species of water plant
  • Mass/length of water plant
  • Temperature of water
  • Concentration of CO₂ (e.g., same amount of sodium hydrogen carbonate)
  • Time of day / ambient light conditions [2] (d) Repeating the experiment allows identification of anomalous results and calculation of an average, which reduces the effect of random errors and improves reliability. [1]

13. (a) Average time = (38.2 + 38.6 + 38.4) / 3 = 115.2 / 3 = 38.4 s [1]

(b) Period = 38.4 s / 20 = 1.92 s [1] (c) Measure the time for a larger number of oscillations (e.g., 50 or 100) and then divide by that number. This reduces the percentage error due to reaction time. [1]

Explanation: Reaction time error (typically ~0.2 s) is fixed regardless of how many oscillations are timed. By timing more oscillations, the absolute error stays the same but the calculated period becomes more accurate.

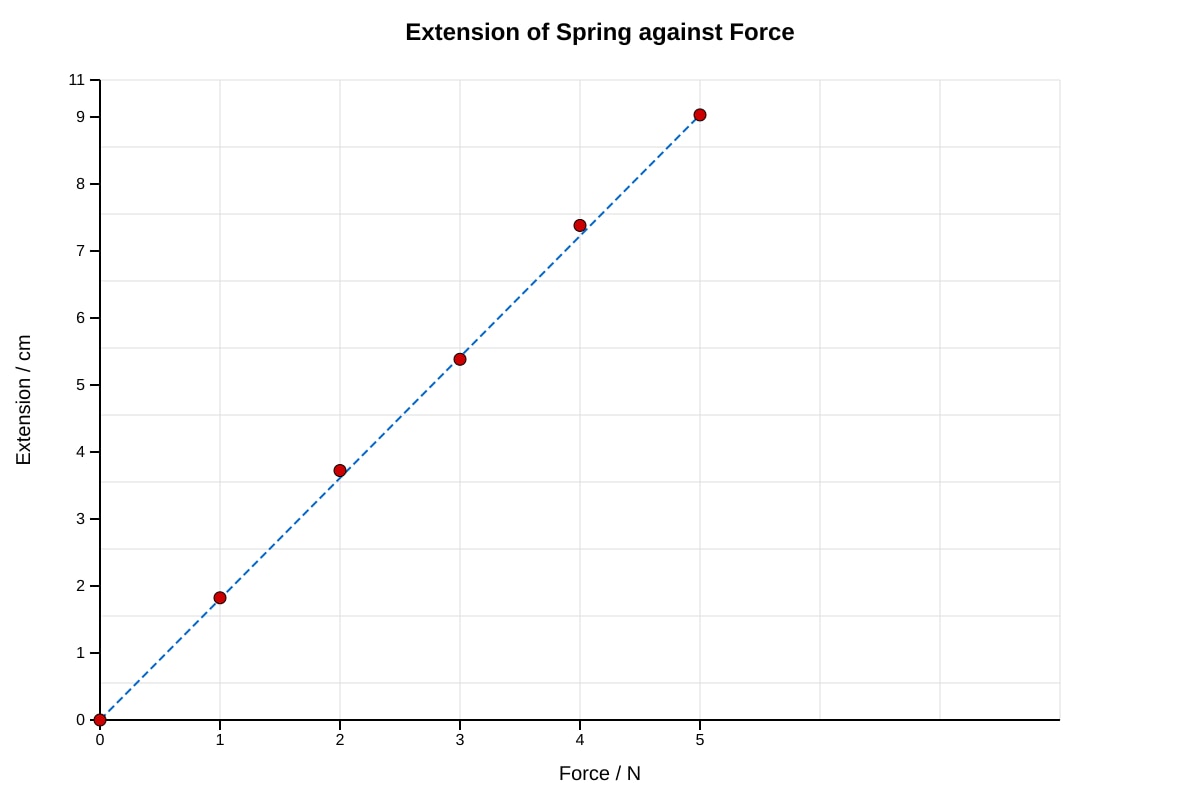
14. (a) Graph plotting [2 marks: 1 for correct plotting of all points, 1 for best-fit straight line through origin]

(b) Extension at 2.5 N = 5.25 cm (accept 5.2–5.3 cm from graph) [1] (c) Yes, the spring obeys Hooke's Law. The graph is a straight line passing through the origin, showing that extension is directly proportional to the force applied. [2]

Marking points for (c):

  • Straight line graph [1]
  • Passes through origin [1]
  • Conclusion: extension ∝ force / obeys Hooke's Law [1] (Award 2 marks for any two correct points)

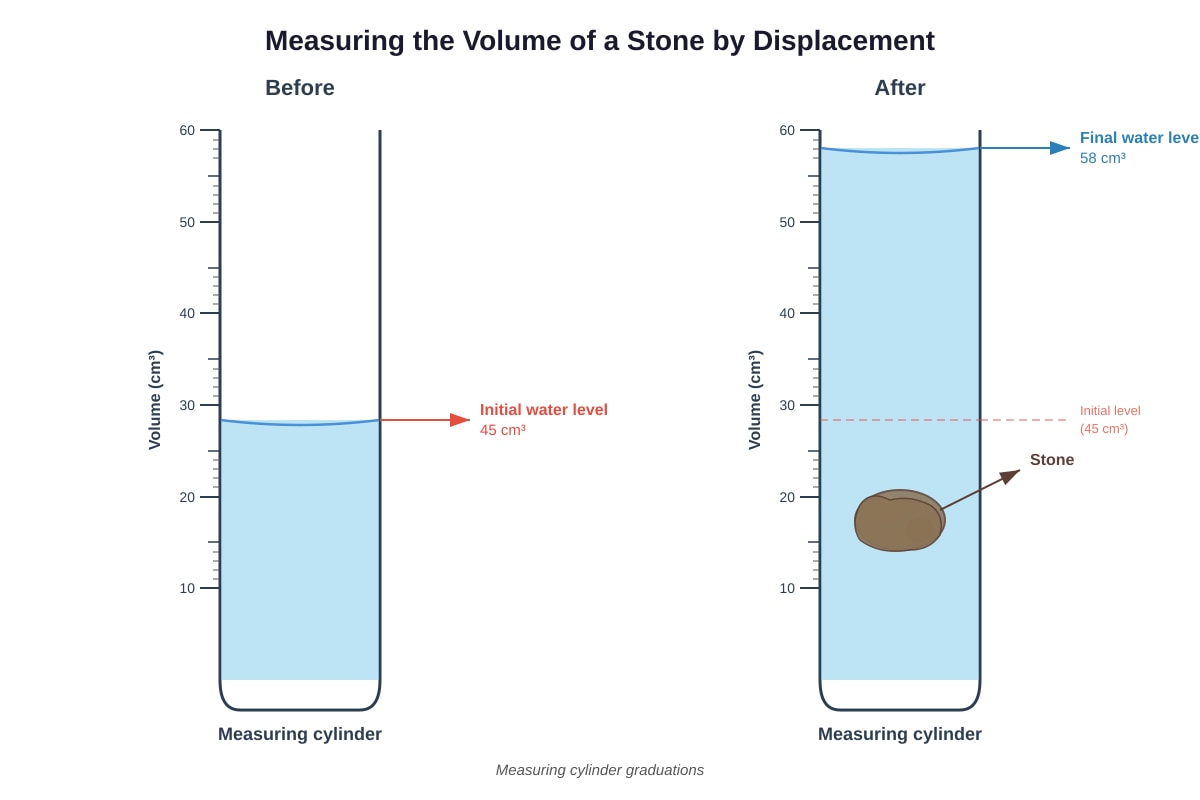
15. (a) Volume of stone = 58 cm³ - 45 cm³ = 13 cm³ [1]

(b) Parallax error [1] (c) Position the eye directly in line with the bottom of the meniscus (at eye level) when taking the reading. [1]

Explanation: The displacement method measures volume by the difference in water level before and after submerging an object. Reading the meniscus at eye level avoids parallax error.


Section C: Data Analysis and Experimental Design (12 marks)

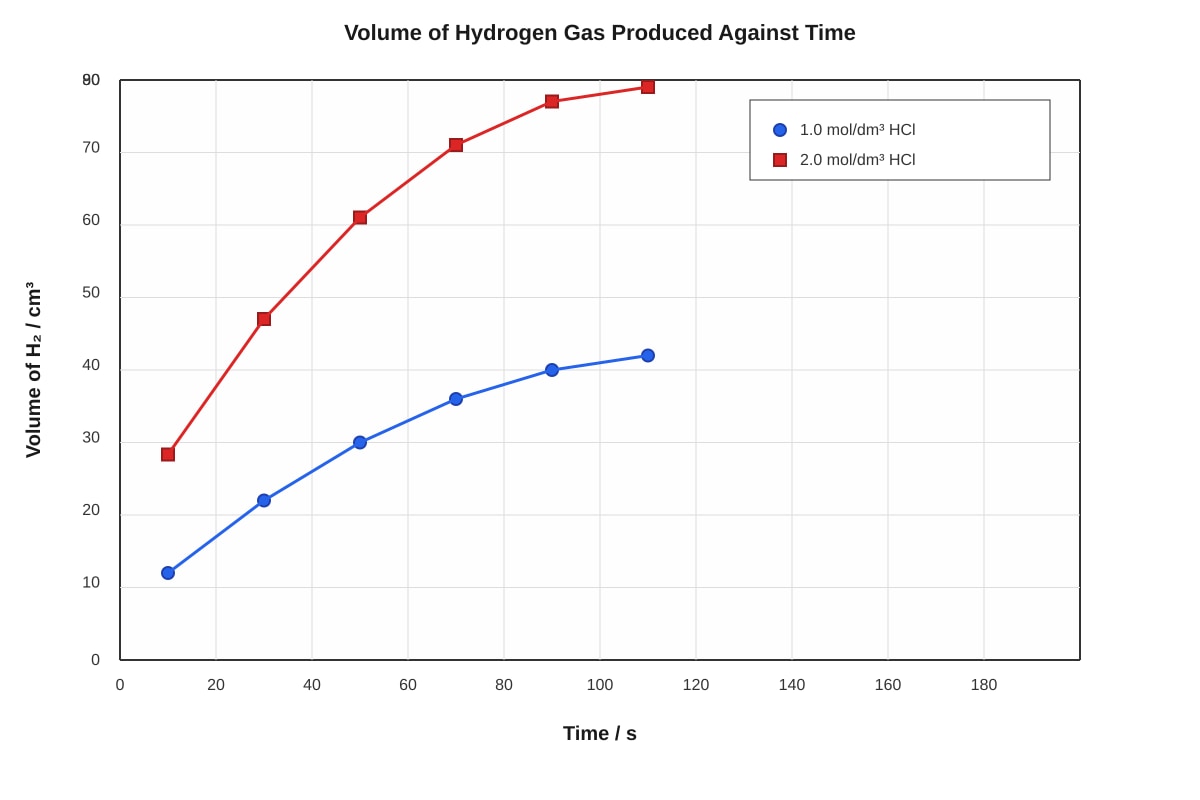
16. (a) Graph plotting [3 marks: 1 for labeled axes with correct scales, 1 for correct plotting of both data series, 1 for smooth curves/best-fit lines with legend]

(b) Initial rate for 2.0 mol/dm³ HCl:

  • Draw tangent to the curve at t = 0
  • Gradient = (Volume at ~30 s - 0) / (30 - 0) = 28 cm³ / 30 s = 0.93 cm³/s (accept 0.9–1.0 cm³/s) [2]

Working: Rate = ΔVolume / ΔTime. Using first 30 s interval: (28 - 0) / (30 - 0) = 0.933 cm³/s.

(c) Higher concentration means more HCl particles per unit volume. This increases the frequency of effective collisions between HCl and Mg particles, increasing the rate of reaction. [2]

Marking points:

  • More particles per unit volume / higher concentration [1]
  • More frequent (effective) collisions [1]

(d) Wear safety goggles / gloves / lab coat. / Avoid skin contact with acid. / Clean up spills immediately. (Any one) [1]

17. (a) Procedure: [3]

  1. Measure the mass of the empty measuring cylinder using the electronic balance.
  2. Pour a known volume of the liquid into the measuring cylinder and record the volume (read at eye level, bottom of meniscus).
  3. Measure the mass of the measuring cylinder with the liquid.
  4. Calculate mass of liquid = (mass of cylinder + liquid) - (mass of empty cylinder).
  5. Calculate density = mass of liquid / volume of liquid.

(b) Mass of liquid = 128.7 g - 45.2 g = 83.5 g Density = 83.5 g / 85 cm³ = 0.98 g/cm³ (0.98235... rounded to 2 d.p.) [2]

Working:

  • Mass of liquid = 128.7 - 45.2 = 83.5 g [1]
  • Density = 83.5 / 85 = 0.98235... = 0.98 g/cm³ [1]

(c) Percentage uncertainty = (Uncertainty / Measurement) × 100% = (1 / 85) × 100% = 1.18% (or 1.2%) [1]

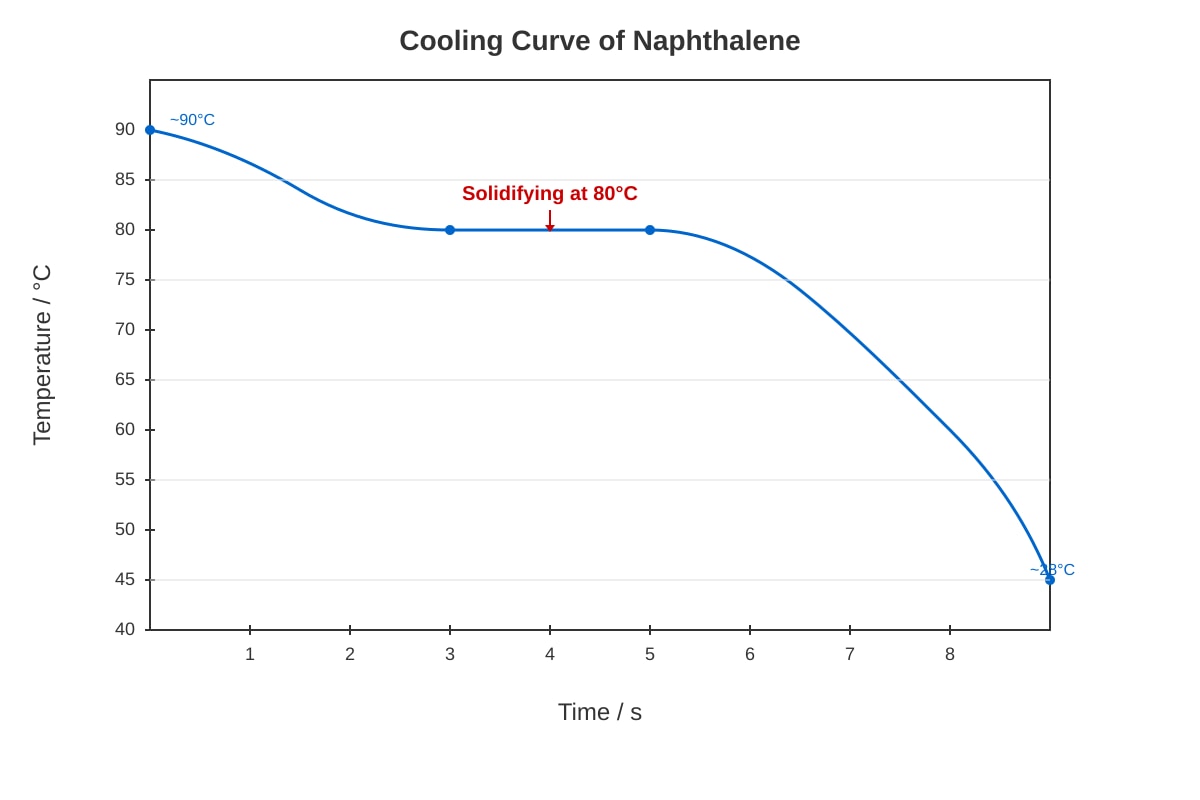
18. (a) To ensure even/uniform heating of the naphthalene and to prevent localised overheating or cracking of the test tube. [1]

(b) During the plateau, naphthalene is changing state from liquid to solid (solidifying/freezing). The heat energy lost to the surroundings is balanced by the latent heat of fusion released during solidification, so the temperature remains constant until all the liquid has solidified. [2]

Marking points:

  • Change of state / solidifying / freezing [1]
  • Latent heat released compensates for heat loss / energy used to form bonds [1]

(c) Sketch of cooling curve [2 marks: 1 for correct shape with plateau, 1 for labeled axes and plateau label]

  • Axes labeled: Time / s (x-axis), Temperature / °C (y-axis)
  • Curve starts at ~90°C, decreases, plateaus at 80°C, then decreases to ~28°C
  • Plateau region labeled "Solidifying at 80°C" or "Constant temperature during change of state"

19. Experimental Design [5 marks]

Independent variable: Surface area of calcium carbonate (e.g., powder vs. small chips vs. large chips) [1]

Dependent variable: Rate of reaction (measured by volume of CO₂ gas produced per unit time, or time taken for a fixed volume of gas, or mass loss per unit time) [1]

Controlled variables (any two):

  • Concentration and volume of hydrochloric acid
  • Mass of calcium carbonate
  • Temperature of reactants
  • Particle size of calcium carbonate (for each trial) [2]

Procedure:

  1. Measure a fixed mass (e.g., 2 g) of calcium carbonate powder and place in a conical flask.
  2. Add a fixed volume (e.g., 50 cm³) of HCl of fixed concentration (e.g., 1.0 mol/dm³).
  3. Immediately connect to a gas syringe / inverted measuring cylinder / balance and start stopwatch.
  4. Record volume of CO₂ produced every 10 seconds until reaction stops.
  5. Repeat steps 1-4 using the same mass of small chips, then large chips.
  6. Keep all other conditions constant. [1]

Analysis:

  • Plot graphs of volume of CO₂ vs time for each surface area.
  • Compare initial gradients (initial rates) or time taken to produce a fixed volume of gas.
  • If the hypothesis is correct, the powder (largest surface area) will have the steepest gradient / shortest time, and large chips (smallest surface area) will have the shallowest gradient / longest time. [1]

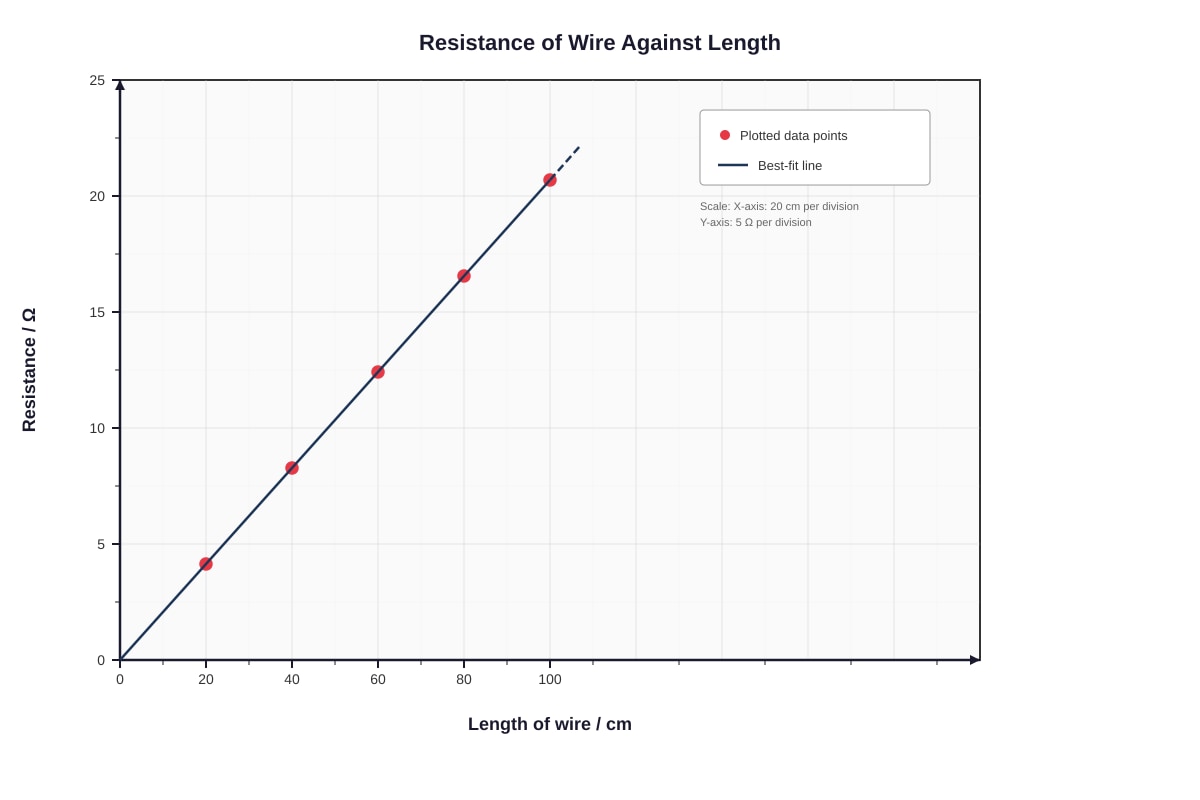
20. (a) Resistance calculations: [2 marks: 1 for correct formula use, 1 for all correct values]

Length / cmCurrent / AVoltage / VResistance / Ω
200.451.84.0
400.231.87.8
600.151.812.0
800.111.816.4
1000.091.820.0

Working: R = V/I

  • 20 cm: 1.8 / 0.45 = 4.0 Ω
  • 40 cm: 1.8 / 0.23 = 7.83 ≈ 7.8 Ω
  • 60 cm: 1.8 / 0.15 = 12.0 Ω
  • 80 cm: 1.8 / 0.11 = 16.36 ≈ 16.4 Ω
  • 100 cm: 1.8 / 0.09 = 20.0 Ω

(b) Graph plotting [2 marks: 1 for labeled axes with correct scales and plotted points, 1 for best-fit straight line through origin]

(c) Resistance is directly proportional to the length of the wire. (The graph is a straight line passing through the origin.) [1]

(d) Since R ∝ L, doubling length doubles resistance. Resistance at 100 cm = 20.0 Ω Resistance at 120 cm = 20.0 × (120/100) = 24.0 Ω [1]

Alternative: From graph, extend best-fit line to 120 cm and read off value ≈ 24 Ω.


End of Answer Key