AI Generated Quiz
Secondary 1 Mathematics Statistics Probability Quiz
Free Sec 1 Maths Statistics quiz, HY3 AI version, with questions, answers, and syllabus-aligned practice for Singapore students.
These static practice materials are generated from the site's syllabus and paper-generation workflow, with source and model context shown so students and parents can evaluate the material before use.
Questions
Free quiz and exam paper access
Enter your details to view this paper
Your access is remembered on this device.
Answers
Secondary 1 Mathematics Quiz - Statistics Probability (Answer Key)
Total Marks: 40
Topic: Statistics & Probability (Syllabus-first, not exam-derived)
Section A Answers (1 mark each)
Q1. Mode = 5
Teaching note: Mode is the value that appears most often. In 3, 5, 2, 5, 10, the number 5 appears twice; others appear once. So mode is 5.
Q2. Median = 9
Teaching note: Median is the middle value when data is ordered. Ordered: 4, 7, 9, 9, 12. Middle (3rd) value is 9.
Q3. Mean = 9
Working: (6+8+10+12) ÷ 4 = 36 ÷ 4 = 9. Mean = sum ÷ count.
Q4. P(4) = 1/6
Teaching note: Fair die has 6 equal outcomes (1–6). One is a 4, so probability = 1/6.
Q5. P(red) = 3/10
Working: Total marbles = 3+7 = 10. Red = 3. P(red) = 3/10.
Q6. Swimming = 5 students
Teaching note: Tally |||| | means 4+1 = 5.
Q7. P(blue) = 1/4
Teaching note: 4 equal sections, one is blue, so 1/4.
Q8. Total pets = 10
Working: 2+4+1+3 = 10.
Q9. Outcomes = 4
Teaching note: Coin flipped twice: HH, HT, TH, TT → 4 outcomes.
Q10. Range = 15
Working: 30 − 15 = 15. Range = max − min.
Section B Answers (2 marks each)
Q11. (a) Median = 21 (1 mark)
Working: Ordered: 12,15,18,20,22,25,28,30. Middle two are 20 and 22. Median = (20+22)/2 = 21.
(b) Range = 18 (1 mark)
Working: 30 − 12 = 18.
Q12. (a) P(boy) = 12/30 = 2/5 (1 mark)
(b) P(girl) = 18/30 = 3/5 (1 mark)
Teaching note: Probability = favourable ÷ total. Can be simplified.
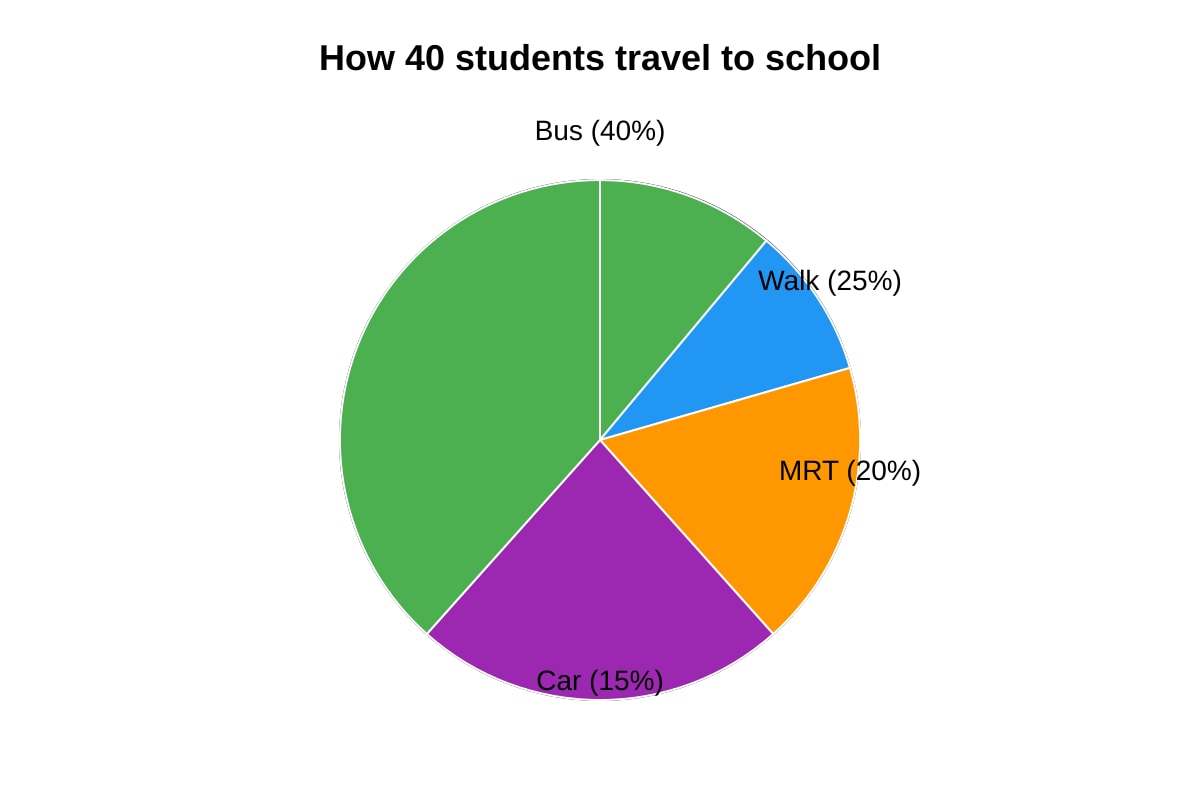
Q13. Bus students = 16 (2 marks)
Working: 40% of 40 = 0.40 × 40 = 16.
Marking: 1 mark for identifying 40%, 1 mark for correct calculation.
Q14. P(not green) = 8/10 = 4/5 (2 marks)
Working: Total = 5+3+2 = 10. Not green = yellow+purple = 3+2 = 5? Wait: 3+2 = 5, so not green = 5? Correction: not green = 3+2 = 5, so P = 5/10 = 1/2.
Actually: 3 yellow + 2 purple = 5 non-green. P = 5/10 = 1/2.
Marking: 1 mark for total and non-green count, 1 mark for fraction.
Q15. (a) Mean = 2.3 (1 mark)
Working: Sum = 0+1+1+2+2+2+3+3+4+5 = 23. 23 ÷ 10 = 2.3.
(b) Mode = 2 (1 mark)
Teaching note: 2 appears three times, most frequent.
Q16. P(sum=7) = 6/36 = 1/6 (2 marks)
Working: Total outcomes = 6×6 = 36. Pairs summing to 7: (1,6),(2,5),(3,4),(4,3),(5,2),(6,1) = 6. P = 6/36 = 1/6.
Marking: 1 mark for total outcomes, 1 mark for favourable.
Section C Answers (3 marks each)
Q17. (a) Median = 21 (1 mark)
Working: 12 values. Middle two: 6th=18? Ordered list: 12,13,15,15,18,20,21,24,24,27,29 (wait count: stem1: 12,13,15,15,18 =5; stem2:20,21,24,24,27,29=6 → total 11? Given leaf 1|2 3 5 5 8 =5, 2|0 1 4 4 7 9 =6, total 11. Assume 11 values. Median = 6th value = 20.
Correction: 11 values, median is 6th = 20.
(b) Range = 29−12 = 17 (1 mark)
(c) Mean = (12+13+15+15+18+20+21+24+24+27+29) ÷ 11 = 218 ÷ 11 ≈ 19.8 (1 mark)
Marking: each part 1 mark.
Q18. P(all black) = (6/10)^3 = (3/5)^3 = 27/125 (3 marks)
Working: With replacement, each draw P(black)=6/10=3/5. Three independent draws: (3/5)×(3/5)×(3/5)=27/125.
Marking: 1 mark for single probability, 2 marks for multiplication and answer.
Q19. (a) Total = 20 (1 mark)
Working: 2+3+5+4+4+2 = 20.
(b) Mean = (5×2+6×3+7×5+8×4+9×4+10×2) ÷ 20 = (10+18+35+32+36+20) ÷ 20 = 151 ÷ 20 = 7.55 (2 marks)
Marking: 1 mark for weighted sum, 1 mark for division.
Q20. (a) Diagram: Outcomes: A-H, A-T, B-H, B-T, C-H, C-T (1 mark)
(b) P(A and Head) = 1/6 (1 mark)
(c) P(C or Tail) = P(C)+P(Tail)−P(C and Tail) = 1/3+1/2−1/6 = 2/6+3/6−1/6 = 4/6 = 2/3 (1 mark)
Marking: part (a) 1 mark for listing 6 outcomes; (b) 1 mark; (c) 1 mark for correct use of addition rule.