AI Generated Quiz
Secondary 1 Mathematics Calculus Quiz
Free Sec 1 Maths Calculus quiz, Qwen3.7 AI version, with questions, answers, and syllabus-aligned practice for Singapore students.
These static practice materials are generated from the site's syllabus and paper-generation workflow, with source and model context shown so students and parents can evaluate the material before use.
Questions
Secondary 1 Mathematics Quiz - Rates of Change and Linear Graphs
Name: __________________________
Class: __________________________
Date: __________________________
Score: _________ / 40
Duration: 45 Minutes
Total Marks: 40
Instructions to Candidates:
- Answer all questions.
- Write your answers in the spaces provided.
- Show all necessary working clearly; no marks will be given for correct answers without working.
- The use of an approved calculator is expected.
- If the degree of accuracy is not specified in the question, and if the answer is not exact, give the answer to three significant figures. Give answers in degrees to one decimal place.
Note to Student: In Secondary 1 Mathematics, "Calculus" concepts are introduced as Rates of Change and the geometry of Straight Line Graphs. This quiz focuses on gradients, interpreting distance-time and speed-time graphs, and the equation of a line y=mx+c. It does not cover differentiation or integration.
Section A: Gradients and Equations of Lines (10 Marks)
1. Find the gradient of the straight line passing through the points A(2,5) and B(6,13). [2]
<br> <br> <br>2. Determine the gradient of the line given by the equation 3y+2x=12. [2]
<br> <br> <br>3. A straight line has a gradient of −4 and passes through the point (0,7). Write down the equation of this line. [1]
<br> <br>4. Find the y-intercept of the line passing through (1,2) and (3,8). [2]
<br> <br> <br>5. State whether the line with equation y=−2x+5 is increasing or decreasing as x increases. Give a reason for your answer. [1]
<br> <br>6. Two lines are parallel. One line has the equation y=3x−1. What is the gradient of the other line? [1]
<br> <br>7. Find the coordinates of the point where the line y=2x−4 crosses the x-axis. [1]
<br> <br>Section B: Rates of Change in Context (15 Marks)
8. A car travels a distance of 150 km in 2 hours. Calculate the average speed of the car in km/h. [2]
<br> <br> <br>9. The table below shows the volume of water in a tank at different times.
| Time (min) | 0 | 5 | 10 | 15 |
|---|---|---|---|---|
| Volume (L) | 20 | 50 | 80 | 110 |
Calculate the rate at which water is being added to the tank in Litres per minute. [2]
<br> <br> <br>10. A cyclist travels from home to the park. The distance-time graph is shown below.
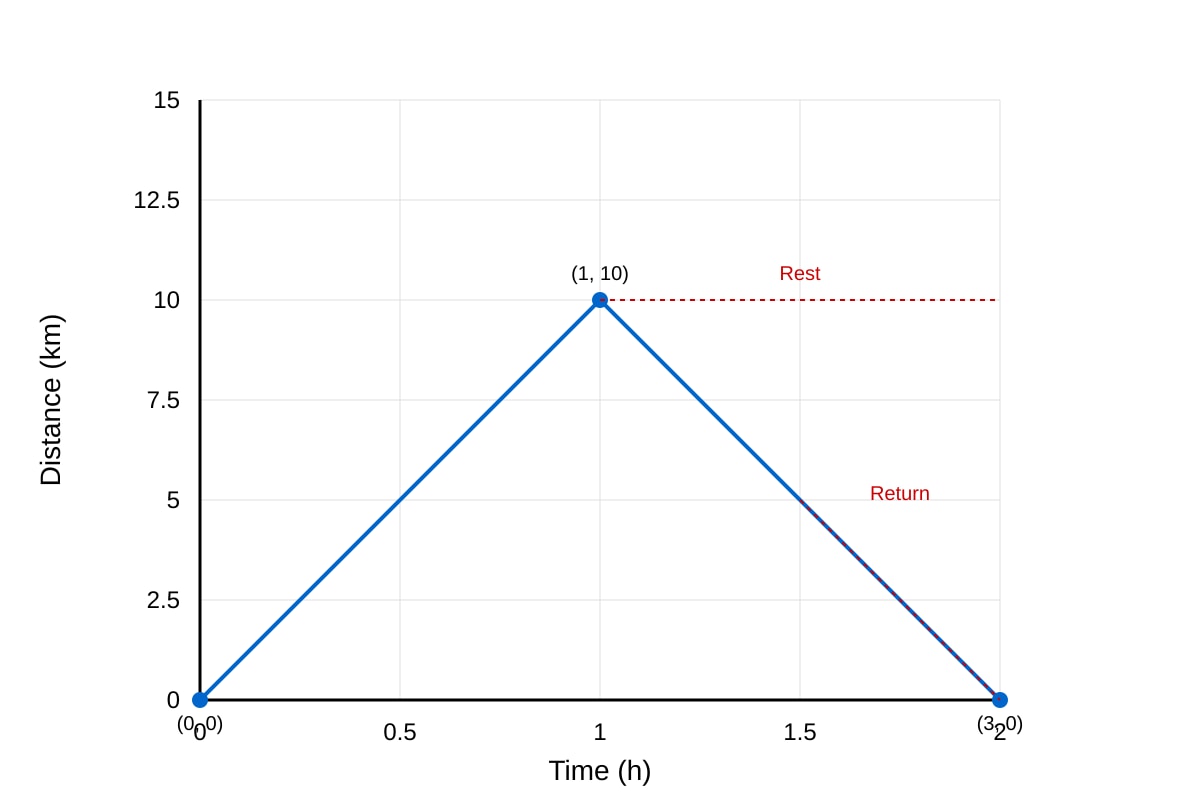
Generated graph for Q10.
(a) Describe the motion of the cyclist between t=1 hour and t=2 hours. [1]
<br> <br>(b) Calculate the speed of the cyclist during the first hour. [2]
<br> <br> <br>11. The temperature of a cup of coffee drops from 80∘C to 50∘C in 10 minutes. (a) Calculate the average rate of cooling in ∘C per minute. [2]
<br> <br> <br>(b) Explain why the rate of cooling might not be constant in a real-world scenario. [1]
<br> <br>12. A company prints T-shirts. The cost C (in dollars) is given by the formula C=5n+20, where n is the number of T-shirts. (a) What is the fixed cost (cost when 0 T-shirts are printed)? [1]
<br> <br>(b) What is the variable cost per T-shirt? [1]
<br> <br>(c) Calculate the total cost of printing 50 T-shirts. [2]
<br> <br> <br>13. Water leaks from a pipe at a constant rate. After 2 hours, 10 Litres have leaked. After 5 hours, 25 Litres have leaked. Find the rate of leakage in Litres per hour. [3]
<br> <br> <br>Section C: Graph Interpretation and Problem Solving (15 Marks)
14. Consider the speed-time graph below for a train journey.
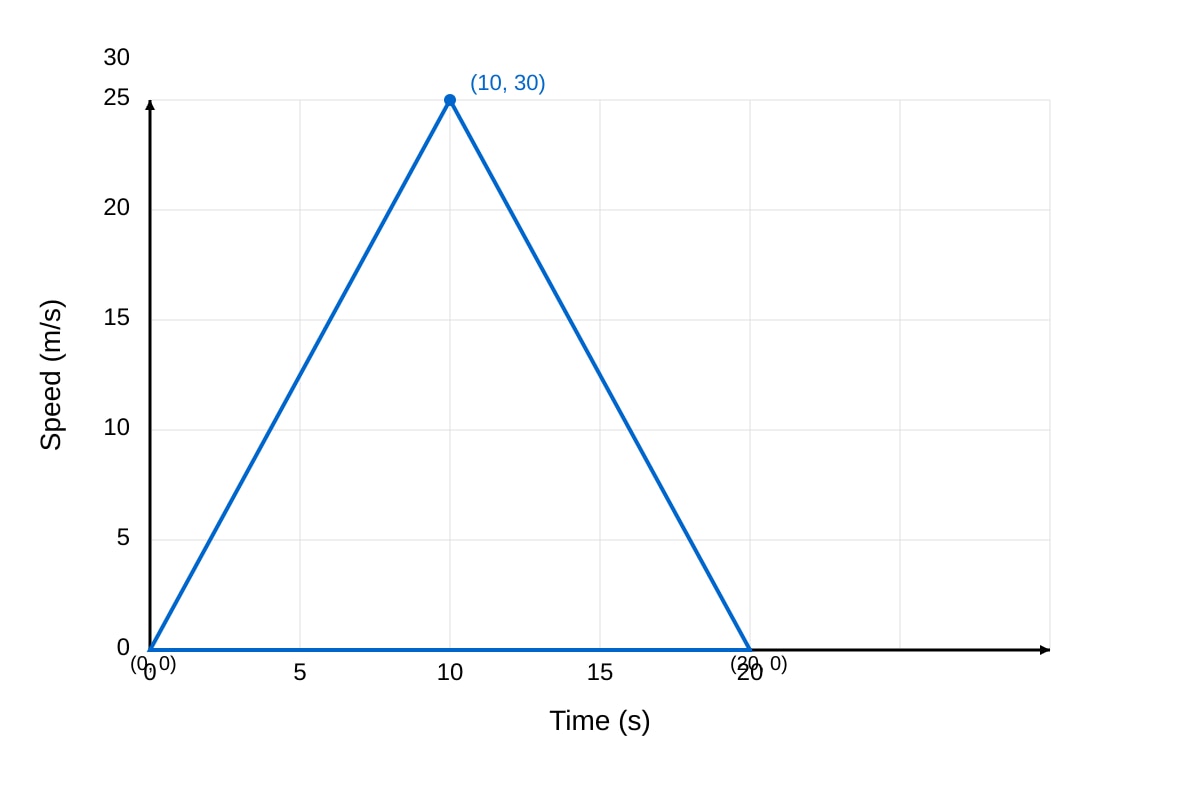
Generated graph for Q14.
(a) What is the maximum speed reached by the train? [1]
<br> <br>(b) Describe the motion of the train from t=10 s to t=20 s. [1]
<br> <br>(c) Calculate the acceleration of the train during the first 10 seconds. [2]
<br> <br> <br>15. The gradient of a distance-time graph represents which physical quantity? [1]
<br> <br>16. A straight line passes through the points (2,k) and (5,11). The gradient of the line is 2. Find the value of k. [3]
<br> <br> <br>17. Look at the equation y=3x−2. (a) Identify the gradient m. [1]
<br> <br>(b) Identify the y-intercept c. [1]
<br> <br>(c) Does the point (4,10) lie on this line? Show your working. [2]
<br> <br> <br>18. Two runners, A and B, are in a race. Runner A starts at the start line (0 m) and runs at a constant speed of 5 m/s. Runner B starts 10 m ahead of the start line and runs at a constant speed of 4 m/s. (a) Write an equation for the distance dA of Runner A from the start line after t seconds. [1]
<br> <br>(b) Write an equation for the distance dB of Runner B from the start line after t seconds. [1]
<br> <br>(c) At what time t will Runner A catch up with Runner B? [2]
<br> <br> <br>19. The graph of y=mx+c passes through (0,−3) and (2,1). Find the values of m and c. [3]
<br> <br> <br>20. A tank is being filled with water. The graph of Volume (V) against Time (t) is a straight line passing through the origin. If the gradient of the graph is 5, what does the number 5 represent in this context? Include units. [2]
<br> <br> <br>*** End of Quiz ***
Answers
Secondary 1 Mathematics Quiz - Rates of Change and Linear Graphs (Answer Key)
Total Marks: 40
Section A: Gradients and Equations of Lines
1. Find the gradient of the straight line passing through the points A(2,5) and B(6,13). [2]
- Answer: 2
- Working: Gradient m=x2−x1y2−y1 m=6−213−5=48=2
- Teaching Note: The gradient is the "rise over run". Ensure students subtract coordinates in the correct order (top minus bottom, bottom minus bottom).
2. Determine the gradient of the line given by the equation 3y+2x=12. [2]
- Answer: −32
- Working: Rearrange into the form y=mx+c. 3y=−2x+12 y=−32x+4 Comparing to y=mx+c, the gradient m=−32.
- Teaching Note: A common mistake is to identify the coefficient of x in the original equation (2) as the gradient without isolating y first.
3. A straight line has a gradient of −4 and passes through the point (0,7). Write down the equation of this line. [1]
- Answer: y=−4x+7
- Working: Using y=mx+c, where m=−4 and the y-intercept c=7 (since it passes through (0,7)).
- Teaching Note: The point (0,7) is the y-intercept, so c is directly given.
4. Find the y-intercept of the line passing through (1,2) and (3,8). [2]
- Answer: −1 (or coordinate (0,−1))
- Working: First, find gradient m: m=3−18−2=26=3 Equation is y=3x+c. Substitute (1,2): 2=3(1)+c⟹c=2−3=−1 The y-intercept is −1.
- Teaching Note: Students must find the gradient first, then substitute a point to find c.
5. State whether the line with equation y=−2x+5 is increasing or decreasing as x increases. Give a reason for your answer. [1]
- Answer: Decreasing.
- Reason: The gradient (m=−2) is negative.
- Teaching Note: A negative gradient means the line goes down from left to right.
6. Two lines are parallel. One line has the equation y=3x−1. What is the gradient of the other line? [1]
- Answer: 3
- Teaching Note: Parallel lines have equal gradients.
7. Find the coordinates of the point where the line y=2x−4 crosses the x-axis. [1]
- Answer: (2,0)
- Working: At the x-axis, y=0. 0=2x−4⟹2x=4⟹x=2
- Teaching Note: Crossing the x-axis always means the y-coordinate is 0.
Section B: Rates of Change in Context
8. A car travels a distance of 150 km in 2 hours. Calculate the average speed of the car in km/h. [2]
- Answer: 75 km/h
- Working: Speed=TimeDistance=2150=75
- Teaching Note: Ensure units are included in the final answer for full marks in context questions.
9. Calculate the rate at which water is being added to the tank in Litres per minute. [2]
- Answer: 6 L/min
- Working: Change in Volume = 50−20=30 L. Change in Time = 5−0=5 min. Rate=530=6 L/min (Check with other intervals: 10−580−50=530=6).
- Teaching Note: The rate is constant because the change is uniform. This is the gradient of the Volume-Time graph.
10. Distance-time graph analysis. (a) Describe the motion between t=1 and t=2 hours. [1] * Answer: The cyclist is stationary (at rest / not moving). * Reason: The distance from home does not change (horizontal line).
(b) Calculate the speed during the first hour. [2]
*   **Answer:** $10$ km/h
*   **Working:**
    $$ \text{Speed} = \frac{\text{Change in Distance}}{\text{Change in Time}} = \frac{10 - 0}{1 - 0} = 10 \text{ km/h} $$
11. Cooling coffee. (a) Average rate of cooling. [2] * Answer: 3∘C/min * Working: Change in Temp = 80−50=30∘C. Time = 10 min. Rate = 1030=3∘C/min.
(b) Why might the rate not be constant? [1]
*   **Answer:** The rate of cooling depends on the temperature difference between the coffee and the room. As the coffee cools, the difference decreases, so it cools slower. (Or: Heat loss is faster when hotter).
12. T-shirt cost C=5n+20. (a) Fixed cost. [1] * Answer: \20∗∗∗Reason:∗∗ThisisthevalueofCwhenn=0(they$-intercept).
(b) Variable cost per T-shirt. [1]
*   **Answer:** $\$5$
*   **Reason:** This is the coefficient of $n$ (the gradient).

(c) Cost of 50 T-shirts. [2]
*   **Answer:** $\$270$
*   **Working:**
    $$ C = 5(50) + 20 = 250 + 20 = 270 $$
13. Water leakage rate. [3]
- Answer: 5 Litres per hour.
- Working: Change in Volume = 25−10=15 Litres. Change in Time = 5−2=3 hours. Rate=315=5 L/h
- Teaching Note: Do not just divide 25 by 5. You must use the change in values (Δy/Δx).
Section C: Graph Interpretation and Problem Solving
14. Speed-time graph analysis. (a) Maximum speed. [1] * Answer: 30 m/s.
(b) Motion from $t=10$ to $t=20$. [1]
*   **Answer:** The train is decelerating (slowing down) at a constant rate.

(c) Acceleration in first 10 seconds. [2]
*   **Answer:** $3$ m/s$^2$
*   **Working:**
    $$ \text{Acceleration} = \frac{\text{Change in Speed}}{\text{Time Taken}} = \frac{30 - 0}{10 - 0} = \frac{30}{10} = 3 \text{ m/s}^2 $$
*   **Teaching Note:** In a speed-time graph, the gradient represents acceleration.
15. What does the gradient of a distance-time graph represent? [1]
- Answer: Speed (or Velocity).
16. Line through (2,k) and (5,11) with gradient 2. Find k. [3]
- Answer: 5
- Working: m=x2−x1y2−y1 2=5−211−k 2=311−k 6=11−k k=11−6=5
17. Equation y=3x−2. (a) Gradient m. [1] * Answer: 3
(b) $y$-intercept $c$. [1]
*   **Answer:** $-2$

(c) Does $(4, 10)$ lie on the line? [2]
*   **Answer:** Yes.
*   **Working:**
    Substitute $x = 4$ into the equation:
    $$ y = 3(4) - 2 = 12 - 2 = 10 $$
    Since the calculated $y$ matches the point's $y$-coordinate ($10$), the point lies on the line.
18. Runners A and B. (a) Equation for Runner A. [1] * Answer: dA=5t
(b) Equation for Runner B. [1]
*   **Answer:** $d_B = 4t + 10$
*   **Reason:** Starts 10m ahead ($+10$), speed 4 m/s ($4t$).

(c) Time to catch up. [2]
*   **Answer:** $10$ seconds.
*   **Working:**
    Set $d_A = d_B$:
    $$ 5t = 4t + 10 $$
    $$ 5t - 4t = 10 $$
    $$ t = 10 $$
19. Graph passes through (0,−3) and (2,1). Find m and c. [3]
- Answer: m=2,c=−3
- Working: Since it passes through (0,−3), the y-intercept c=−3. Calculate gradient m: m=2−01−(−3)=24=2 So, m=2 and c=−3.
20. Volume-Time graph gradient is 5. What does 5 represent? [2]
- Answer: The rate of flow of water into the tank is 5 Litres per second (assuming standard units, or whatever units are on axes, e.g., units3/time).
- Teaching Note: The gradient of a Volume-Time graph is the flow rate. Units are crucial here (Volume units / Time units).
Free quiz and exam paper access
Enter your details to view this paper
Your access is remembered on this device.