From Real Exams Quiz
Secondary 1 Mathematics Statistics Probability Quiz
Free Sec 1 Maths Statistics quiz, HY3 Exam version, with questions, answers, and syllabus-aligned practice for Singapore students.
These static practice materials are generated from the site's syllabus and paper-generation workflow, with source and model context shown so students and parents can evaluate the material before use.
Questions
Secondary 1 Mathematics Quiz - Statistics Probability
Name: ___________________________
Class: ___________
Date: ___________
Score: ___________ / 40
Duration: 50 minutes
Total Marks: 40
Instructions:
- Answer all 20 questions.
- Show your working clearly where required.
- Use the spaces provided to write your answers.
- Calculators may be used.
Section A: Data Handling and Averages (Questions 1–5)
1. [2 marks]
The number of books read by 7 students in a month are: 3, 5, 2, 8, 5, 6, 5.
Find the mean number of books read.
2. [2 marks]
Using the same data in Q1, find the median number of books read.
3. [2 marks]
Using the same data in Q1, find the mode of the number of books read.
4. [2 marks]
The table below shows the scores of a class in a quiz.
| Score | 10 | 20 | 30 | 40 |
|---|---|---|---|---|
| Frequency | 2 | 5 | 3 | 2 |
Find the mean score.
5. [2 marks]
A data set has values: 4, 7, 9, 11, 13.
What is the range of the data?
Section B: Representing Data (Questions 6–10)
6. [2 marks]
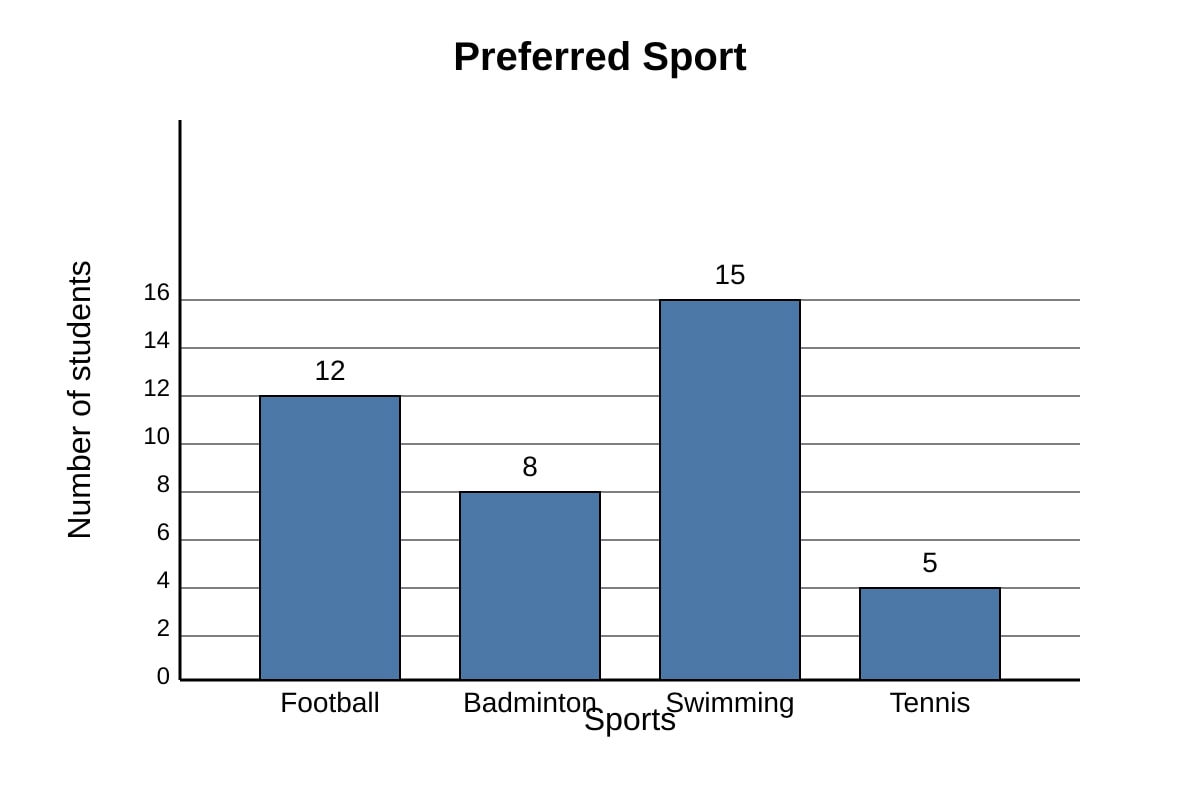
The bar chart below shows the number of students who prefer each sport.

Generated bar_chart for Q6.
How many more students prefer Swimming than Tennis?
7. [2 marks]
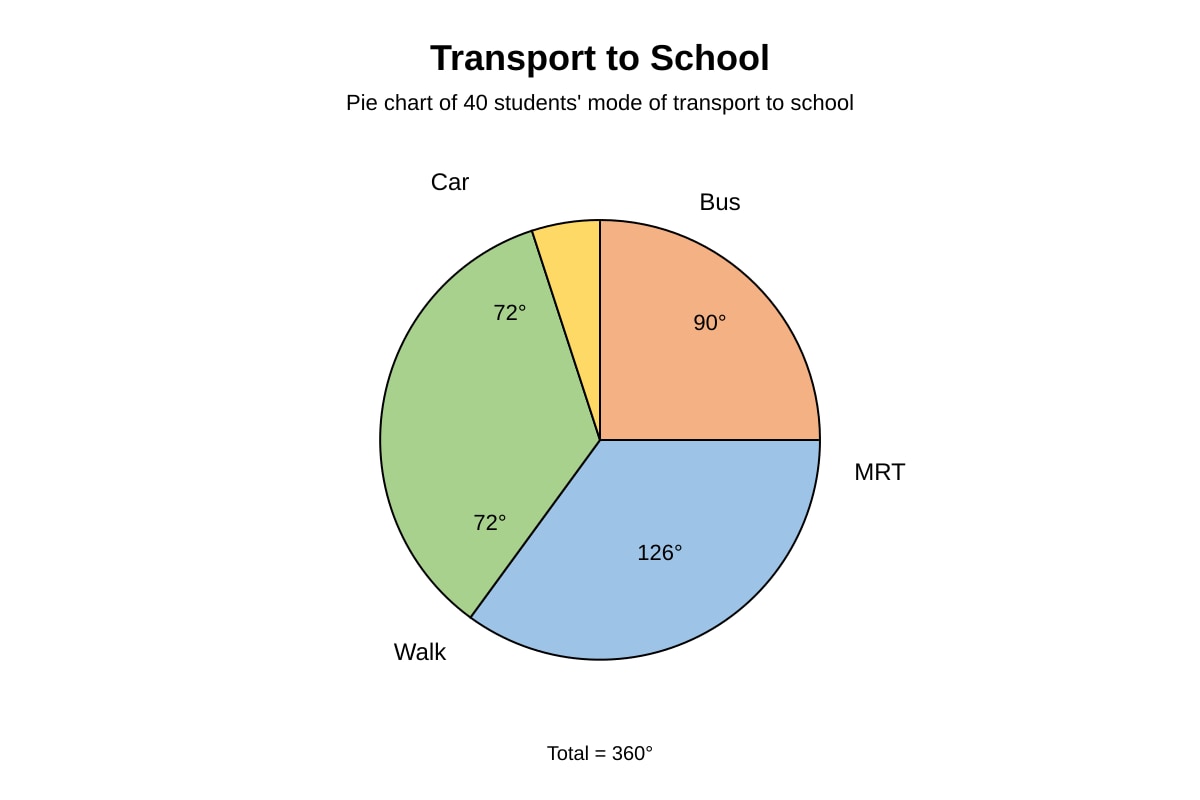
The pie chart below shows how 40 students travel to school.

Generated pie_chart for Q7.
Find the number of students who travel by MRT.
8. [2 marks]
A line graph shows the temperature (°C) at 8am, 10am, 12pm, 2pm as 24, 27, 30, 29 respectively.
What is the increase in temperature from 8am to 12pm?
9. [2 marks]
The frequency table shows the number of siblings of 20 students.
| Siblings | 0 | 1 | 2 | 3 |
|---|---|---|---|---|
| Frequency | 4 | 9 | 5 | 2 |
Find the total number of students represented.
10. [2 marks]
From the table in Q9, find the percentage of students who have exactly 1 sibling.
Section C: Probability (Questions 11–15)
11. [2 marks]
A bag contains 5 red, 3 blue, and 2 green marbles.
What is the probability of picking a red marble at random?
12. [2 marks]
A fair die is rolled. What is the probability of getting an even number?
13. [2 marks]
A letter is chosen at random from the word "MATHEMATICS".
What is the probability that the letter is "M"?
14. [2 marks]
A spinner has 4 equal sections coloured red, blue, red, yellow.
What is the probability of landing on blue?
15. [2 marks]
In a class of 30 students, 18 are girls. A student is chosen at random.
What is the probability that the student is a boy?
Section D: Application and Interpretation (Questions 16–20)
16. [2 marks]
The stem-and-leaf plot shows the scores of students in a test.
Stem | Leaf
2 | 3 5 8
3 | 1 4 4 9
4 | 0 2
Key: 2|3 means 23.
How many students scored at least 30?
17. [2 marks]
A box contains 10 chocolates: 4 with nuts, 6 without.
One is taken at random. What is the probability it has no nuts?
18. [2 marks]
The table shows the favourite subject of 25 students.
| Subject | Math | Science | English |
|---|---|---|---|
| Frequency | 10 | 8 | 7 |
What is the probability that a randomly chosen student prefers Science?
19. [2 marks]
The mean of 4 numbers is 12. Three of the numbers are 10, 14, 9.
Find the fourth number.
20. [2 marks]
A coin is flipped twice. List all possible outcomes and find the probability of getting exactly one head.
Answers
Secondary 1 Mathematics Quiz - Statistics Probability (Answer Key)
Total Marks: 40
Topic: Statistics & Probability
Section A: Data Handling and Averages
Q1 [2 marks]
Data: 3, 5, 2, 8, 5, 6, 5 (7 values)
Mean = (3+5+2+8+5+6+5) ÷ 7 = 34 ÷ 7 ≈ 4.86
Teaching note: Mean is the sum of all values divided by the count. 34/7 = 4.857... round to 2 d.p. if needed.
Answer: 34/7 or 4.86
Q2 [2 marks]
Ordered data: 2, 3, 5, 5, 5, 6, 8
Median = middle value = 5 (4th value)
Teaching note: Arrange in order; for odd count, median is the centre.
Answer: 5
Q3 [2 marks]
Mode = most frequent value = 5 (appears 3 times)
Teaching note: Mode is the value with highest frequency.
Answer: 5
Q4 [2 marks]
Mean = (10×2 + 20×5 + 30×3 + 40×2) ÷ (2+5+3+2)
= (20+100+90+80) ÷ 12 = 290 ÷ 12 ≈ 24.17
Answer: 290/12 or 24.17
Q5 [2 marks]
Range = max − min = 13 − 4 = 9
Teaching note: Range shows spread.
Answer: 9
Section B: Representing Data
Q6 [2 marks]
Swimming=15, Tennis=5 → difference = 10
Answer: 10
Q7 [2 marks]
MRT angle = 126° out of 360° → (126/360)×40 = 14
Teaching note: Sector angle proportion gives frequency.
Answer: 14
Q8 [2 marks]
Increase = 30 − 24 = 6°C
Answer: 6
Q9 [2 marks]
Total = 4+9+5+2 = 20
Answer: 20
Q10 [2 marks]
Percentage = (9/20)×100% = 45%
Answer: 45%
Section C: Probability
Q11 [2 marks]
Total marbles = 5+3+2 = 10. P(red) = 5/10 = 1/2
Answer: 1/2
Q12 [2 marks]
Even numbers on die: 2,4,6 (3 out of 6) → P = 3/6 = 1/2
Answer: 1/2
Q13 [2 marks]
"MATHEMATICS" has 11 letters, M appears twice → P(M) = 2/11
Answer: 2/11
Q14 [2 marks]
Blue sections = 1 out of 4 → P(blue) = 1/4
Answer: 1/4
Q15 [2 marks]
Boys = 30−18 = 12. P(boy) = 12/30 = 2/5
Answer: 2/5
Section D: Application and Interpretation
Q16 [2 marks]
Scores ≥30: stem 3 (4 values), stem 4 (2 values) → total 6
Answer: 6
Q17 [2 marks]
Without nuts = 6 out of 10 → P = 6/10 = 3/5
Answer: 3/5
Q18 [2 marks]
P(Science) = 8/25
Answer: 8/25
Q19 [2 marks]
Sum of 4 numbers = 12×4 = 48. Fourth = 48 − (10+14+9) = 15
Answer: 15
Q20 [2 marks]
Outcomes: HH, HT, TH, TT (4 equally likely). Exactly one head: HT, TH → 2/4 = 1/2
Answer: Outcomes: HH, HT, TH, TT; P=1/2
Free quiz and exam paper access
Enter your details to view this paper
Your access is remembered on this device.