From Real Exams Quiz
Secondary 1 Mathematics Calculus Quiz
Free Nemo AI-generated Sec 1 Maths Calculus quiz with questions, answers, and syllabus-aligned practice for Singapore students preparing for school assessments.
These static practice materials are generated from the site's syllabus and paper-generation workflow, with source and model context shown so students and parents can evaluate the material before use.
Questions
Secondary 1 Mathematics Quiz - Calculus
Name: ___________________________
Class: ___________________________
Date: ___________________________
Score: _____ / 40
Duration: 45 minutes
Total Marks: 40
Instructions:
- Answer all questions.
- Write your answers in the spaces provided.
- Show all working clearly.
- Omission of essential working will result in loss of marks.
- Calculators may be used unless otherwise stated.
Section A: Gradient and Rate of Change (Questions 1–5) [10 marks]
1. The graph shows the distance-time graph of a car travelling along a straight road.
<image_placeholder> id: Q1-fig1 type: graph linked_question: Q1 description: Distance-time graph with time (s) on horizontal axis from 0 to 10, distance (m) on vertical axis from 0 to 100. Straight line from (0,0) to (10,100). labels: Time (s), Distance (m) values: Points (0,0), (2,20), (5,50), (10,100) must_show: Straight line passing through origin with constant gradient </image_placeholder>
(a) Find the speed of the car.
Answer: ______________________ m/s [1]
(b) State what the gradient of the graph represents.
Answer: _________________________________________________________________________ [1]
2. A tank is being filled with water at a constant rate. The volume of water litres in the tank after minutes is given by .
(a) Find the rate at which water is flowing into the tank.
Answer: ______________________ litres/min [1]
(b) Explain what the value 10 represents in this context.
Answer: _________________________________________________________________________ [1]
3. The graph below shows the velocity-time graph of a particle moving in a straight line.
<image_placeholder> id: Q3-fig1 type: graph linked_question: Q3 description: Velocity-time graph with time (s) on horizontal axis from 0 to 8, velocity (m/s) on vertical axis from 0 to 12. Horizontal line from (0,6) to (4,6), then straight line down to (8,0). labels: Time (s), Velocity (m/s) values: Constant velocity 6 m/s from t=0 to t=4; linear decrease from 6 m/s to 0 m/s between t=4 and t=8 must_show: Two distinct sections - constant velocity then uniform deceleration </image_placeholder>
(a) Find the acceleration of the particle during the first 4 seconds.
Answer: ______________________ m/s² [1]
(b) Find the acceleration of the particle between and seconds.
Answer: ______________________ m/s² [1]
(c) Calculate the total distance travelled by the particle in 8 seconds.
Answer: ______________________ m [2]
4. The cost dollars of producing items is given by .
(a) State the fixed cost.
Answer: $ ______________________ [1]
(b) State the variable cost per item.
Answer: $ ______________________ per item [1]
(c) If the selling price per item is $5, find the minimum number of items that must be sold to make a profit.
Answer: ______________________ items [2]
5. A car accelerates uniformly from rest. After 5 seconds, its velocity is 20 m/s.
(a) Find the acceleration of the car.
Answer: ______________________ m/s² [1]
(b) Sketch the velocity-time graph for the first 5 seconds on the axes below.
<image_placeholder> id: Q5-fig1 type: graph linked_question: Q5 description: Blank axes for velocity-time graph. Horizontal axis: Time (s) from 0 to 5. Vertical axis: Velocity (m/s) from 0 to 25. labels: Time (s), Velocity (m/s) values: Line from (0,0) to (5,20) must_show: Straight line through origin with positive gradient, labelled axes </image_placeholder>
Section B: Area Under Graphs and Accumulation (Questions 6–12) [15 marks]
6. The graph shows the velocity-time graph of a cyclist for the first 10 seconds of motion.
<image_placeholder> id: Q6-fig1 type: graph linked_question: Q6 description: Velocity-time graph. Horizontal axis: Time (s) 0 to 10. Vertical axis: Velocity (m/s) 0 to 8. Shape: Triangle from (0,0) to (5,8) to (10,0). labels: Time (s), Velocity (m/s) values: Peak velocity 8 m/s at t=5 s; returns to 0 at t=10 s must_show: Symmetric triangle with peak at (5,8) </image_placeholder>
(a) Find the maximum velocity of the cyclist.
Answer: ______________________ m/s [1]
(b) Calculate the total distance travelled by the cyclist in 10 seconds.
Answer: ______________________ m [2]
7. Water flows into a container at a rate of litres per minute, where and is the time in minutes.
(a) Find the rate of flow when minutes.
Answer: ______________________ litres/min [1]
(b) Calculate the total volume of water that flows into the container from to minutes.
Answer: ______________________ litres [3]
8. The graph below shows the rate of change of temperature (C/min) of a substance being heated over 6 minutes.
<image_placeholder> id: Q8-fig1 type: graph linked_question: Q8 description: Rate of temperature change vs time graph. Horizontal axis: Time (min) 0 to 6. Vertical axis: Rate (°C/min) 0 to 5. Horizontal line at rate = 4 from t=0 to t=3, then horizontal line at rate = 2 from t=3 to t=6. labels: Time (min), Rate of temperature change (°C/min) values: Constant rate 4°C/min for first 3 min, then 2°C/min for next 3 min must_show: Two horizontal segments at different heights </image_placeholder>
(a) During which time interval is the temperature increasing at the fastest rate?
Answer: ______________________ [1]
(b) If the initial temperature is 20°C, find the temperature after 6 minutes.
Answer: ______________________ °C [3]
9. A particle moves in a straight line with velocity m/s, where is time in seconds.
(a) Find the velocity when .
Answer: ______________________ m/s [1]
(b) Find the times when the particle is momentarily at rest.
Answer: ______________________ s [2]
(c) Find the acceleration when s.
Answer: ______________________ m/s² [2]
10. The graph shows the force (in newtons) applied to an object against the distance (in metres) moved.
<image_placeholder> id: Q10-fig1 type: graph linked_question: Q10 description: Force-distance graph. Horizontal axis: Distance (m) 0 to 8. Vertical axis: Force (N) 0 to 10. Shape: Rectangle from (0,0) to (4,5) to (8,5) to (8,0). labels: Distance (m), Force (N) values: Constant force 5 N from d=0 to d=4; constant force 5 N from d=4 to d=8 must_show: Rectangle of height 5 N and width 8 m </image_placeholder>
Calculate the work done in moving the object 8 metres.
Answer: ______________________ J [2]
11. A car travels with velocity m/s for seconds.
(a) Find the initial velocity of the car.
Answer: ______________________ m/s [1]
(b) Find the time when the car comes to rest.
Answer: ______________________ s [1]
(c) Calculate the total distance travelled before the car stops.
Answer: ______________________ m [2]
12. The rate of growth of a bacteria population is given by bacteria per hour, where is the population and is time in hours.
(a) If the initial population is 200, find the population after 6 hours.
Answer: ______________________ bacteria [2]
(b) Sketch the graph of population against time for the first 6 hours on the axes below.
<image_placeholder> id: Q12-fig1 type: graph linked_question: Q12 description: Blank axes for population-time graph. Horizontal axis: Time (hours) 0 to 6. Vertical axis: Population from 200 to 500. labels: Time (hours), Population values: Line from (0,200) to (6,500) must_show: Straight line with positive gradient starting at (0,200) </image_placeholder>
Section C: Applications and Problem Solving (Questions 13–20) [15 marks]
13. A stone is thrown vertically upwards. Its height metres above the ground after seconds is given by .
(a) Find the initial velocity of the stone.
Answer: ______________________ m/s [1]
(b) Find the maximum height reached by the stone.
Answer: ______________________ m [2]
(c) Find the time when the stone hits the ground.
Answer: ______________________ s [1]
14. The graph shows the velocity-time graph of a train journey between two stations.
<image_placeholder> id: Q14-fig1 type: graph linked_question: Q14 description: Velocity-time graph. Horizontal axis: Time (s) 0 to 100. Vertical axis: Velocity (m/s) 0 to 30. Shape: Trapezoid - accelerates uniformly from 0 to 30 m/s in 20 s, constant 30 m/s for 60 s, decelerates uniformly to 0 in 20 s. labels: Time (s), Velocity (m/s) values: (0,0), (20,30), (80,30), (100,0) must_show: Three distinct phases - acceleration, constant velocity, deceleration </image_placeholder>
(a) Find the acceleration during the first 20 seconds.
Answer: ______________________ m/s² [1]
(b) Find the deceleration during the last 20 seconds.
Answer: ______________________ m/s² [1]
(c) Calculate the distance between the two stations.
Answer: ______________________ m [3]
15. Oil leaks from a tank at a rate of litres per hour, where is the time in hours after the leak starts.
(a) Find the rate of leakage after 4 hours.
Answer: ______________________ litres/hour [1]
(b) Find the time when the leak stops.
Answer: ______________________ hours [1]
(c) Calculate the total amount of oil leaked.
Answer: ______________________ litres [3]
16. A rocket is launched vertically. Its velocity m/s after seconds is given by for .
(a) Find the maximum velocity of the rocket.
Answer: ______________________ m/s [2]
(b) Find the acceleration when s.
Answer: ______________________ m/s² [1]
(c) Calculate the height of the rocket at s.
Answer: ______________________ m [2]
17. The graph below shows the rate of water flow (in litres/min) into a tank over 12 minutes.
<image_placeholder> id: Q17-fig1 type: graph linked_question: Q17 description: Flow rate vs time graph. Horizontal axis: Time (min) 0 to 12. Vertical axis: Flow rate (L/min) 0 to 10. Shape: Triangle from (0,0) to (6,10) to (12,0). labels: Time (min), Flow rate (L/min) values: Peak flow 10 L/min at t=6 min; zero at t=0 and t=12 must_show: Symmetric triangle with peak at (6,10) </image_placeholder>
(a) Find the maximum flow rate.
Answer: ______________________ L/min [1]
(b) Calculate the total volume of water in the tank after 12 minutes.
Answer: ______________________ litres [2]
(c) At what time is the flow rate exactly 5 L/min?
Answer: ______________________ min [1]
18. A particle moves along a straight line. Its displacement metres from a fixed point O after seconds is given by .
(a) Find the velocity when s.
Answer: ______________________ m/s [2]
(b) Find the acceleration when s.
Answer: ______________________ m/s² [1]
(c) Find the times when the particle changes direction.
Answer: ______________________ s [2]
19. The cost of producing units of a product is given by .
(a) Find the marginal cost when .
Answer: $ ______________________ [2]
(b) Explain the meaning of marginal cost in this context.
Answer: _________________________________________________________________________ [1]
(c) Find the average cost per unit when .
Answer: $ ______________________ [1]
20. A car starts from rest and accelerates uniformly at m/s² for 10 seconds. It then travels at constant velocity for 20 seconds before decelerating uniformly to rest in 5 seconds.
(a) Sketch the velocity-time graph for the whole journey on the axes below.
<image_placeholder> id: Q20-fig1 type: graph linked_question: Q20 description: Blank axes for velocity-time graph. Horizontal axis: Time (s) 0 to 35. Vertical axis: Velocity (m/s) 0 to 25. labels: Time (s), Velocity (m/s) values: (0,0) to (10,20) straight line; (10,20) to (30,20) horizontal; (30,20) to (35,0) straight line must_show: Three phases - acceleration, constant velocity, deceleration; labelled axes and key points </image_placeholder>
(b) Find the maximum velocity reached.
Answer: ______________________ m/s [1]
(c) Calculate the total distance travelled.
Answer: ______________________ m [2]
End of Quiz
Answers
Secondary 1 Mathematics Quiz - Calculus (Answer Key)
Total Marks: 40
Section A: Gradient and Rate of Change (Questions 1–5) [10 marks]
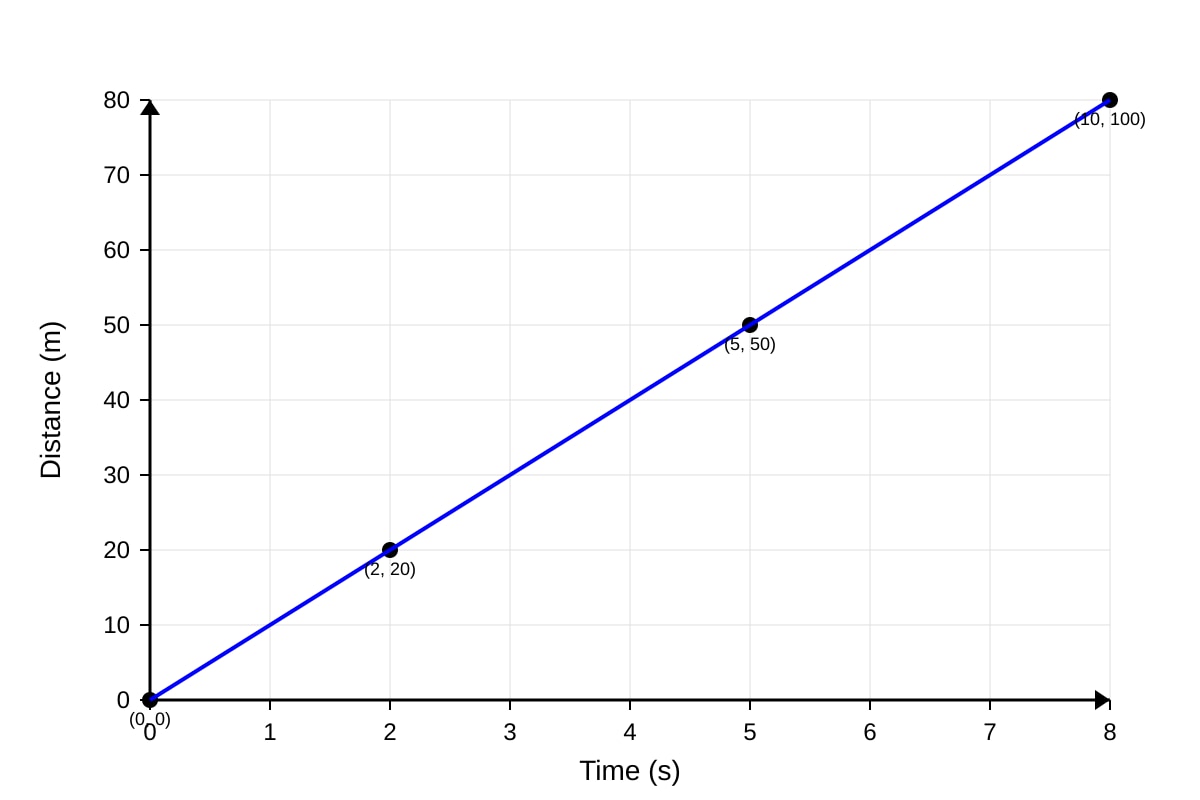
1. Distance-time graph of a car
(a) Speed = gradient of distance-time graph
Gradient = m/s
Answer: 10 m/s [1]
(b) The gradient of a distance-time graph represents the speed (or velocity) of the object.
Answer: The gradient represents the speed of the car. [1]
Teaching note: In a distance-time graph, gradient = speed. A straight line means constant speed. The steeper the line, the greater the speed.
2. Water tank filling:
(a) Rate of flow = coefficient of = 5 litres/min
Answer: 5 litres/min [1]
(b) The value 10 is the constant term. When , . This is the initial volume of water in the tank before filling starts.
Answer: The initial volume of water in the tank (at ) is 10 litres. [1]
Teaching note: In a linear model , is the rate of change and is the initial value (when ).
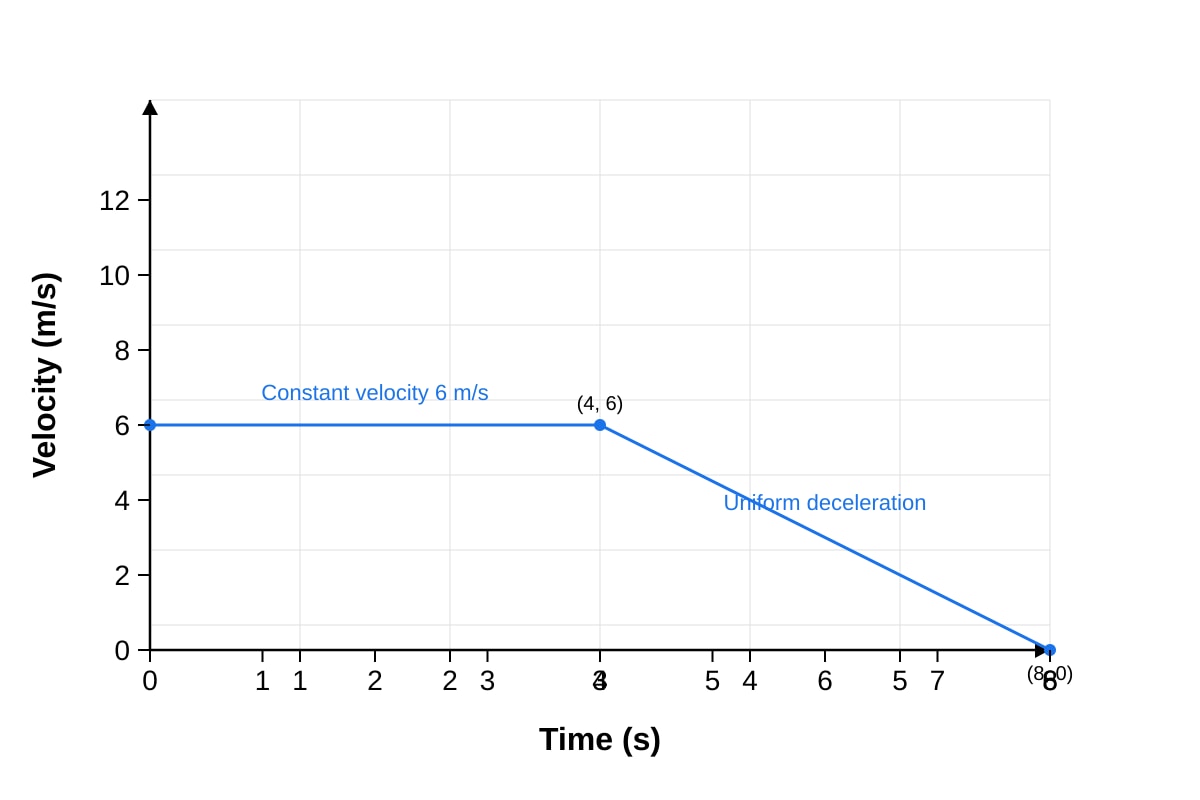
3. Velocity-time graph of a particle
(a) First 4 seconds: horizontal line at m/s. Gradient = 0.
Acceleration = 0 m/s²
Answer: 0 m/s² [1]
(b) Between and : velocity decreases from 6 to 0 m/s uniformly.
Acceleration = gradient = m/s²
Answer: -1.5 m/s² [1]
(c) Distance = area under velocity-time graph
Area = area of rectangle (0 to 4 s) + area of triangle (4 to 8 s)
=
= m
Answer: 36 m [2]
Marking: 1 mark for correct method (area under graph), 1 mark for correct answer.
Teaching note: Area under velocity-time graph = displacement (distance if velocity doesn't change sign).
4. Cost function:
(a) Fixed cost = constant term = 50 [1]
(b) Variable cost per item = coefficient of = 2 per item [1]
(c) Revenue . Profit when :
Minimum integer items
Answer: 17 items [2]
Marking: 1 mark for setting up inequality , 1 mark for correct answer 17.
Teaching note: Break-even occurs when revenue = cost. Profit requires revenue > cost.
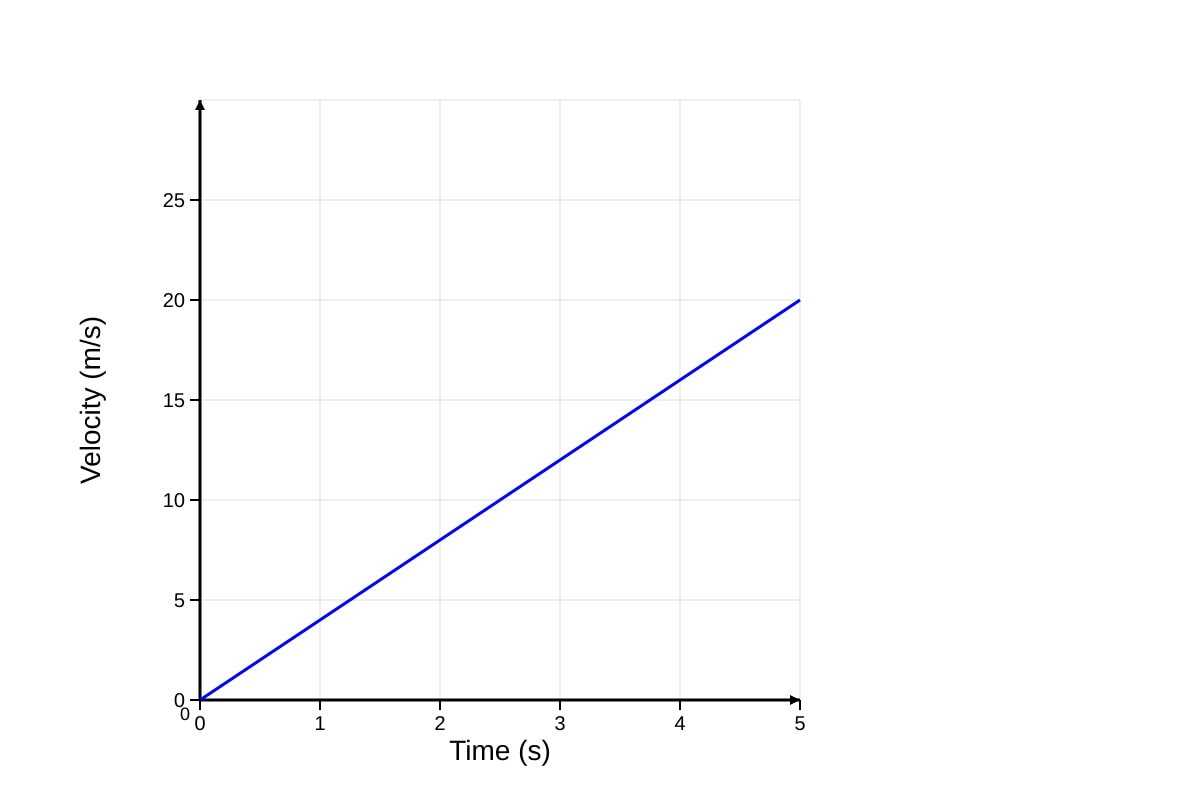
5. Car accelerating uniformly from rest
(a) Acceleration = m/s²
Answer: 4 m/s² [1]
(b) Sketch: Straight line from (0,0) to (5,20) on velocity-time axes.
Answer: [Graph: straight line through origin with positive gradient, labelled axes] [1]
Teaching note: Uniform acceleration from rest gives a straight line through origin on a - graph. Gradient = acceleration.
Section B: Area Under Graphs and Accumulation (Questions 6–12) [15 marks]
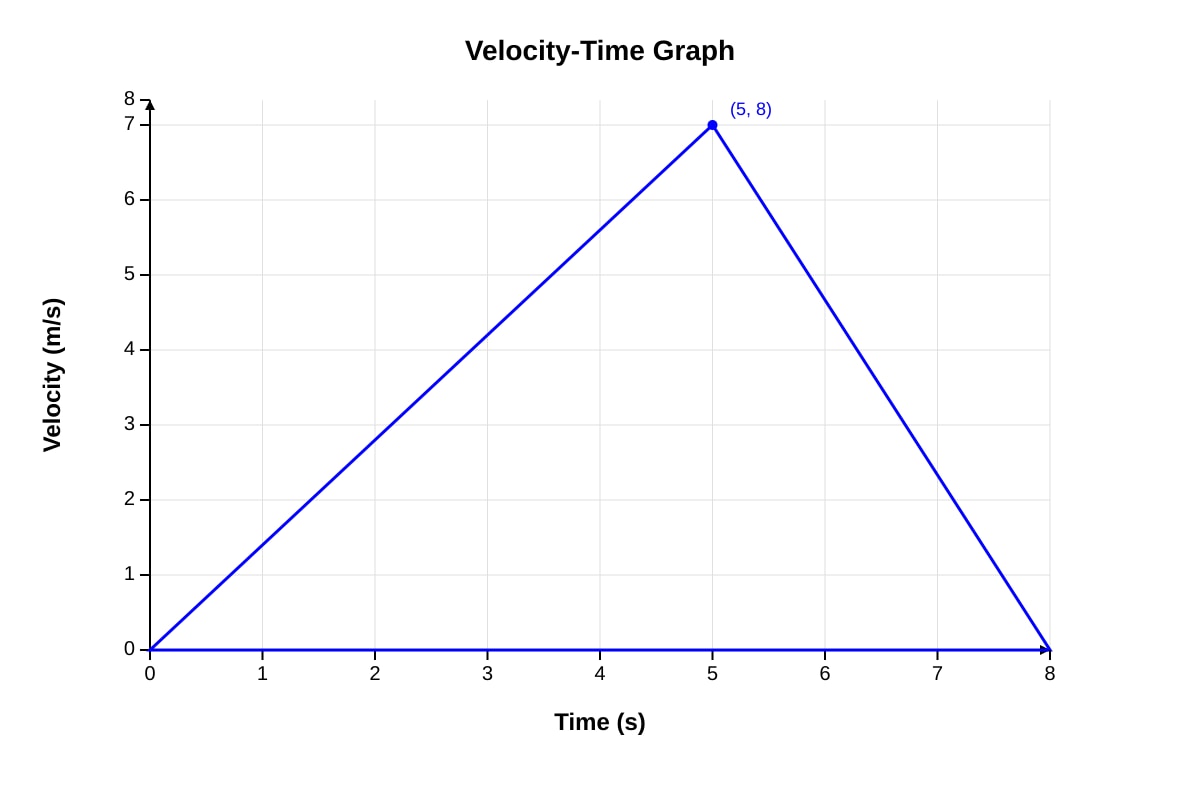
6. Cyclist velocity-time graph (triangle)
(a) Maximum velocity = peak of triangle = 8 m/s
Answer: 8 m/s [1]
(b) Distance = area of triangle = m
Answer: 40 m [2]
Marking: 1 mark for area formula, 1 mark for correct answer.
7. Water flow rate:
(a) At : litres/min
Answer: 11 litres/min [1]
(b) Total volume = area under rate-time graph from to
=
=
= litres
Alternative (trapezium area): At , ; at , . Area = litres
Answer: 28 litres [3]
Marking: 1 mark for correct method (integration or trapezium area), 1 mark for correct substitution/limits, 1 mark for correct answer.
Teaching note: Total quantity = area under rate-time graph. For linear rate, area is a trapezium.
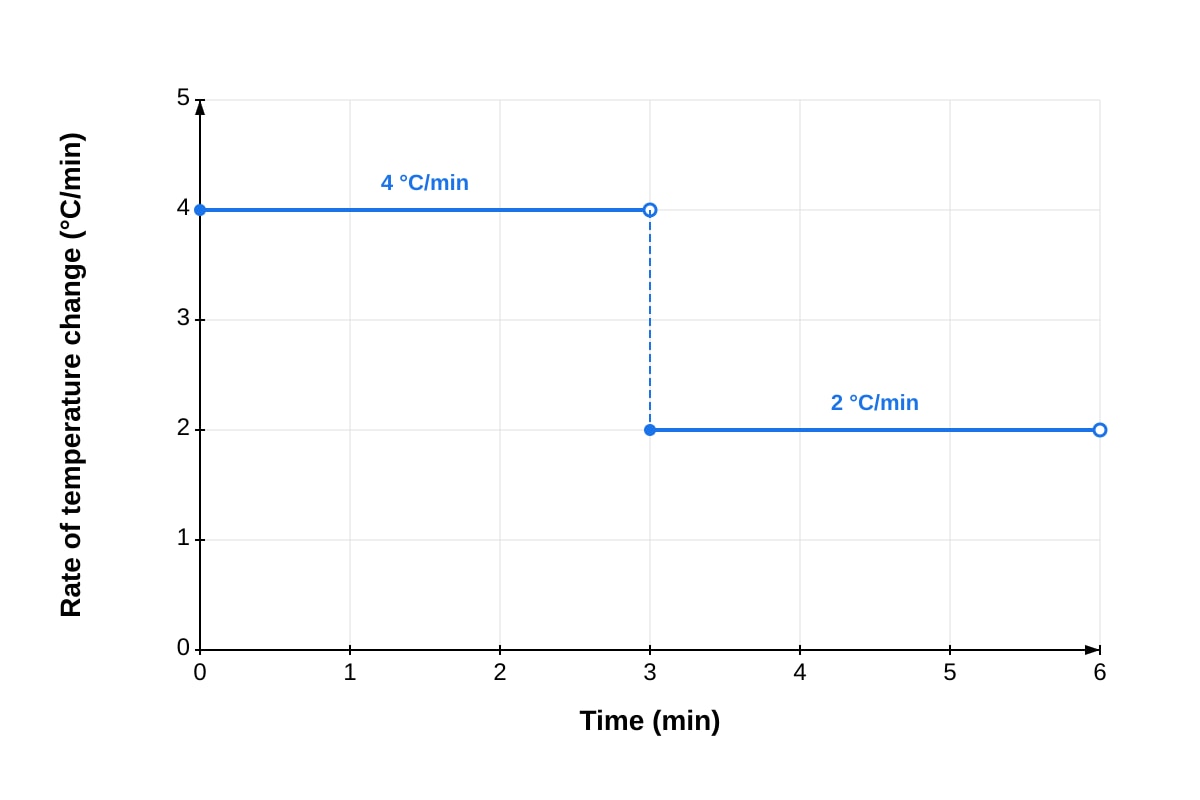
8. Rate of temperature change graph
(a) Fastest rate = highest value on graph = 4°C/min (first 3 minutes)
Answer: 0 to 3 minutes [1]
(b) Temperature increase = area under rate-time graph
= Area of rectangle 1 + Area of rectangle 2
= °C
Final temperature = °C
Answer: 38°C [3]
Marking: 1 mark for area calculation, 1 mark for adding initial temperature, 1 mark for correct answer.
9. Particle velocity:
(a) At : m/s
Answer: 9 m/s [1]
(b) At rest when :
or seconds
Answer: 1 s and 3 s [2]
Marking: 1 mark for setting and simplifying, 1 mark for correct solutions.
(c) Acceleration
At : m/s²
Answer: 0 m/s² [2]
Marking: 1 mark for differentiating to get , 1 mark for correct substitution and answer.
Teaching note: Acceleration is the derivative of velocity (gradient of - graph).
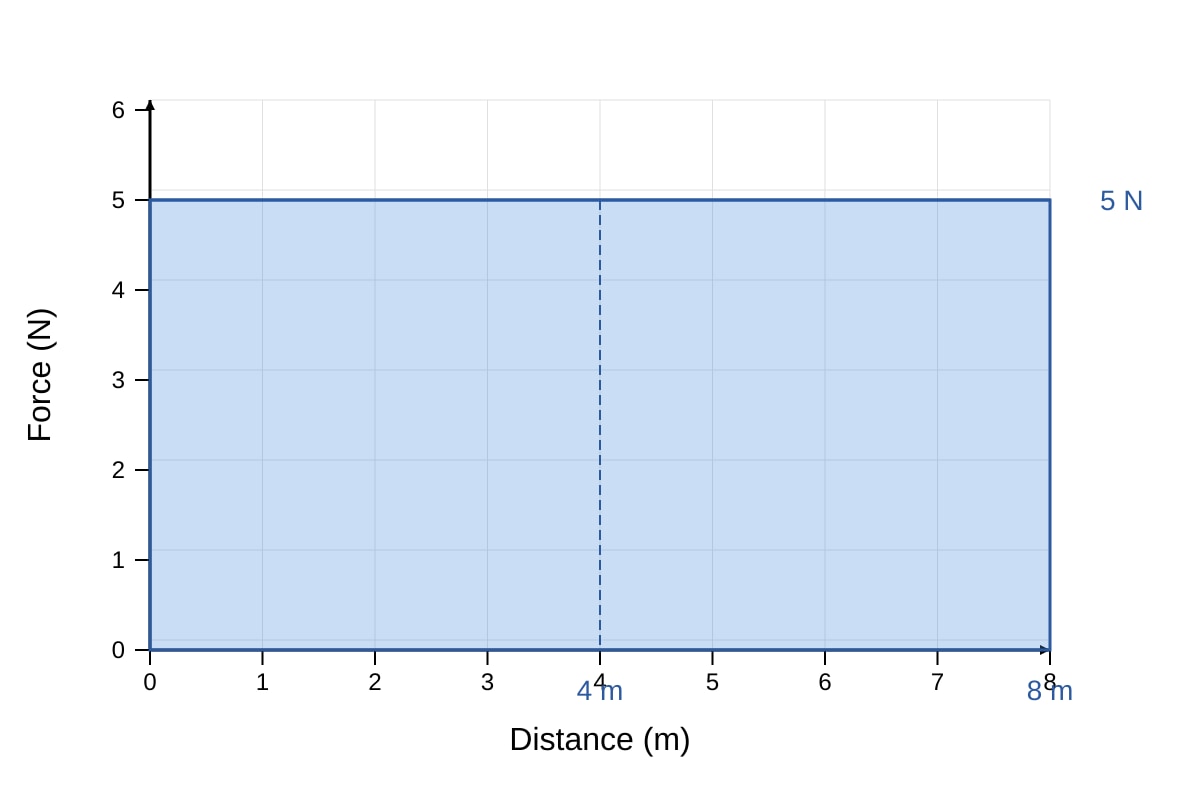
10. Force-distance graph (rectangle)
Work done = area under force-distance graph
= Force distance = J
Answer: 40 J [2]
Marking: 1 mark for identifying area = work done, 1 mark for correct calculation.
11. Car velocity:
(a) Initial velocity at : m/s
Answer: 10 m/s [1]
(b) At rest when : s
Answer: 5 s [1]
(c) Distance = area under - graph from to
Graph is a triangle: base = 5, height = 10
Area = m
Answer: 25 m [2]
Marking: 1 mark for correct area method, 1 mark for correct answer.
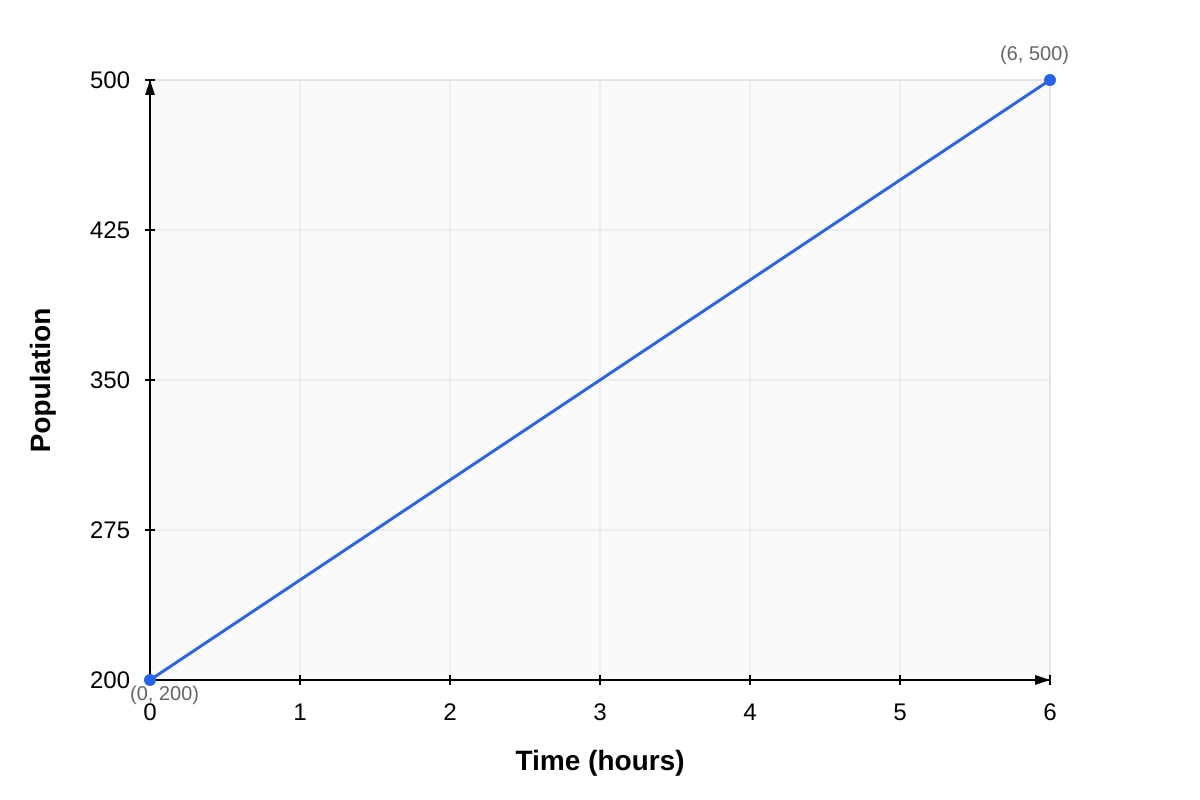
12. Bacteria growth:
(a) Constant rate of change linear growth.
. At , .
At : bacteria
Answer: 500 bacteria [2]
Marking: 1 mark for finding , 1 mark for correct answer.
(b) Sketch: Straight line from (0,200) to (6,500) on population-time axes.
Answer: [Graph: straight line with positive gradient starting at (0,200)] [1]
Teaching note: Constant rate of change linear graph. Gradient = rate of change.
Section C: Applications and Problem Solving (Questions 13–20) [15 marks]
13. Stone thrown upwards:
(a) Velocity
Initial velocity at : m/s
Answer: 20 m/s [1]
Teaching note: Velocity is the derivative of displacement (gradient of - graph).
(b) Maximum height when : s
m
Answer: 20 m [2]
Marking: 1 mark for finding , 1 mark for correct height.
(c) Hits ground when :
(start) or s
Answer: 4 s [1]
14. Train velocity-time graph (trapezoid)
(a) Acceleration = gradient of first section = m/s²
Answer: 1.5 m/s² [1]
(b) Deceleration = gradient of last section = m/s²
Magnitude of deceleration = 1.5 m/s²
Answer: 1.5 m/s² [1]
(c) Distance = area under graph = area of trapezoid
=
=
Wait: parallel sides are the velocities at start and end of constant velocity phase?
Better: Area = rectangle + two triangles
=
= m
Or trapezium formula: Average velocity time = m
Answer: 2400 m [3]
Marking: 1 mark for correct area method, 1 mark for correct calculation of areas, 1 mark for correct answer.
15. Oil leak:
(a) At : litres/hour
Answer: 80 litres/hour [1]
(b) Leak stops when : hours
Answer: 20 hours [1]
(c) Total oil leaked = area under - graph from to
Triangle: base = 20, height = 100
Area = litres
Answer: 1000 litres [3]
Marking: 1 mark for identifying triangle area, 1 mark for correct base and height, 1 mark for correct answer.
16. Rocket:
(a) Maximum velocity when acceleration :
s
m/s
Answer: 125 m/s [2]
Marking: 1 mark for setting and finding , 1 mark for correct .
(b) Acceleration
At : m/s²
Answer: 20 m/s² [1]
(c) Height = displacement = area under - graph from 0 to 10
= m
Answer: m or 833.33 m [2]
Marking: 1 mark for correct integration, 1 mark for correct evaluation and answer.
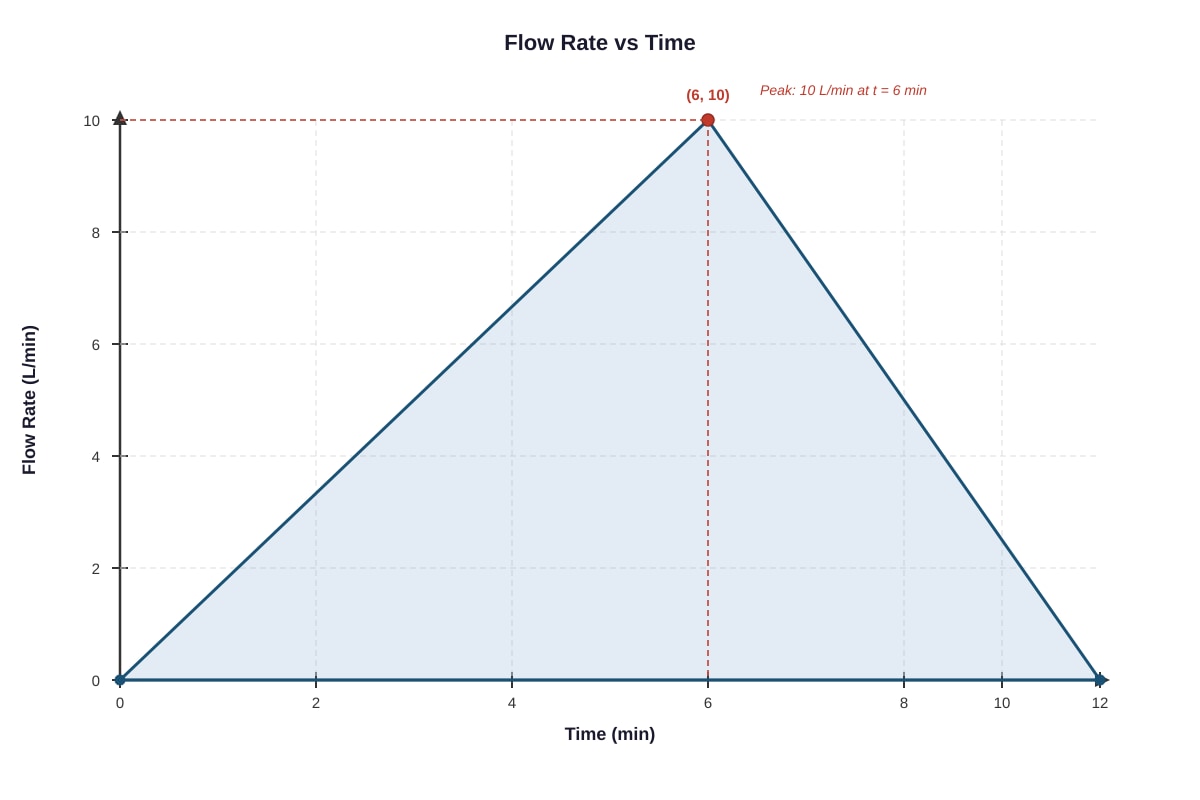
17. Water flow rate graph (triangle)
(a) Maximum flow rate = peak = 10 L/min
Answer: 10 L/min [1]
(b) Total volume = area of triangle = litres
Answer: 60 litres [2]
Marking: 1 mark for area formula, 1 mark for correct answer.
(c) Flow rate = 5 L/min occurs at two times (rising and falling).
By symmetry, at min and min.
Or calculation: Rising: gradient = L/min². .
Falling: .
Answer: 3 min and 9 min [1]
18. Particle displacement:
(a) Velocity
At : m/s
Answer: -3 m/s [2]
Marking: 1 mark for correct differentiation, 1 mark for correct substitution and answer.
(b) Acceleration
At : m/s²
Answer: 0 m/s² [1]
(c) Changes direction when :
s and s
Answer: 1 s and 3 s [2]
Marking: 1 mark for setting and solving, 1 mark for both correct times.
19. Cost function:
(a) Marginal cost =
At : Marginal cost =
Answer: $30 [2]
Marking: 1 mark for correct differentiation, 1 mark for correct substitution and answer.
Teaching note: Marginal cost is the derivative of total cost — the cost of producing one additional unit.
(b) Marginal cost represents the instantaneous rate of change of total cost with respect to quantity — the approximate cost of producing the next (11th) unit when 10 units have already been produced.
Answer: The cost of producing one additional unit (the 11th unit) when 10 units have been produced. [1]
(c) Average cost =
At : Average cost =
Answer: $75 [1]
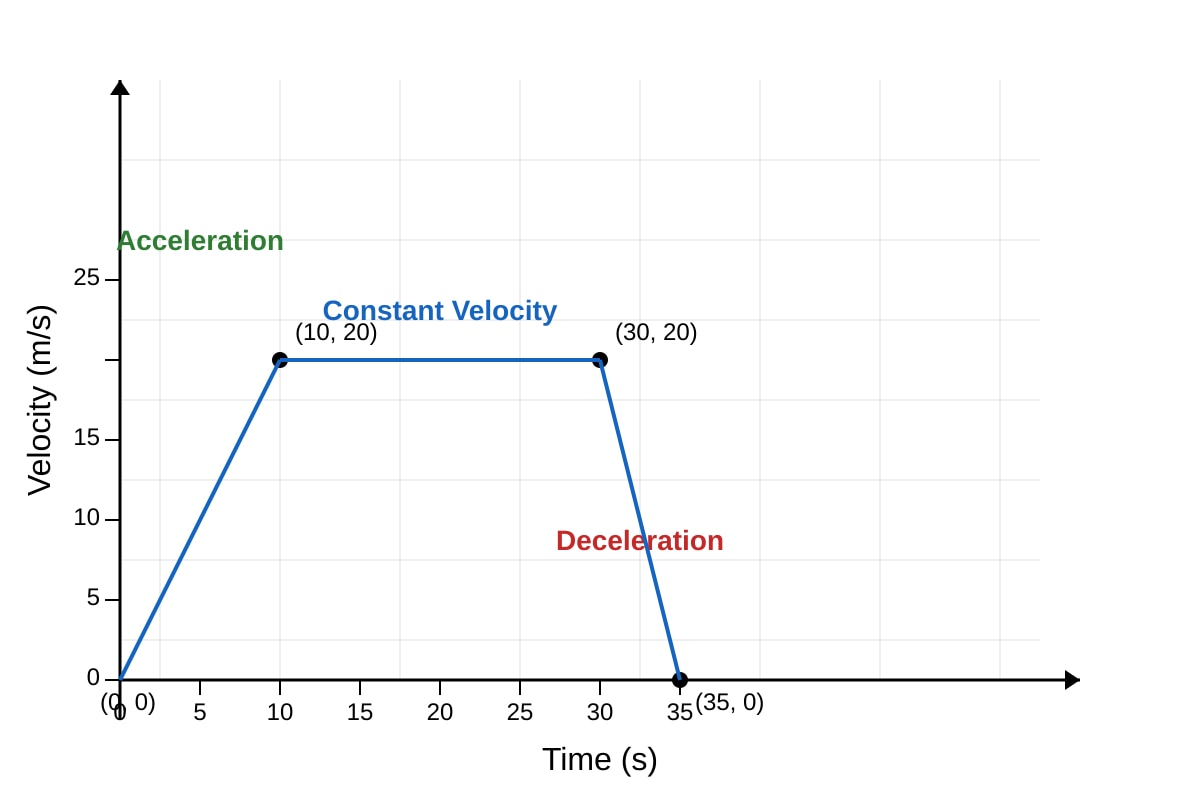
20. Car journey: three phases
(a) Sketch:
- 0 to 10 s: straight line from (0,0) to (10,20)
- 10 to 30 s: horizontal line at
- 30 to 35 s: straight line from (30,20) to (35,0)
Answer: [Graph with three phases, labelled axes and key points] [1]
(b) Maximum velocity = velocity after acceleration phase = m/s
Answer: 20 m/s [1]
(c) Total distance = area under - graph
= Area of triangle (0-10) + rectangle (10-30) + triangle (30-35)
=
= m
Answer: 550 m [2]
Marking: 1 mark for correct area breakdown, 1 mark for correct answer.
End of Answer Key