AI Generated Quiz
Secondary 1 Geography Resources Sustainability Quiz
Free Sec 1 Geography Resources Sustainability quiz, Nemo3 AI version, with questions, answers, and syllabus-aligned practice for Singapore students.
These static practice materials are generated from the site's syllabus and paper-generation workflow, with source and model context shown so students and parents can evaluate the material before use.
Questions
Secondary 1 Geography Quiz - Resources Sustainability
Name: ___________________________
Class: ___________________________
Date: ___________________________
Score: ______ / 40
Duration: 45 minutes
Total Marks: 40
Instructions:
- Answer all questions.
- Write your answers in the spaces provided.
- For questions requiring extended responses, use the lined space provided.
- The number of marks is given in brackets [ ] at the end of each question or part question.
- Diagrams and maps are not drawn to scale unless stated.
Section A: Multiple Choice Questions (10 marks)
Answer all questions. Choose the correct answer and write the letter (A, B, C, or D) in the box provided.
1. Which of the following best defines a renewable resource? [1]
☐ A. A resource that exists in fixed amounts and cannot be replenished
☐ B. A resource that can be replenished naturally over a relatively short period
☐ C. A resource that is only found in tropical regions
☐ D. A resource that requires advanced technology to extract
2. Singapore imports over 90% of its food. Which strategy does Singapore use to enhance food security? [1]
☐ A. Converting all nature reserves into farmland
☐ B. Relying solely on imports from a single country
☐ C. Diversifying import sources and investing in local high-tech farming
☐ D. Banning the export of all locally produced food
3. The diagram below shows the water cycle. Which process is represented by arrow X? [1]
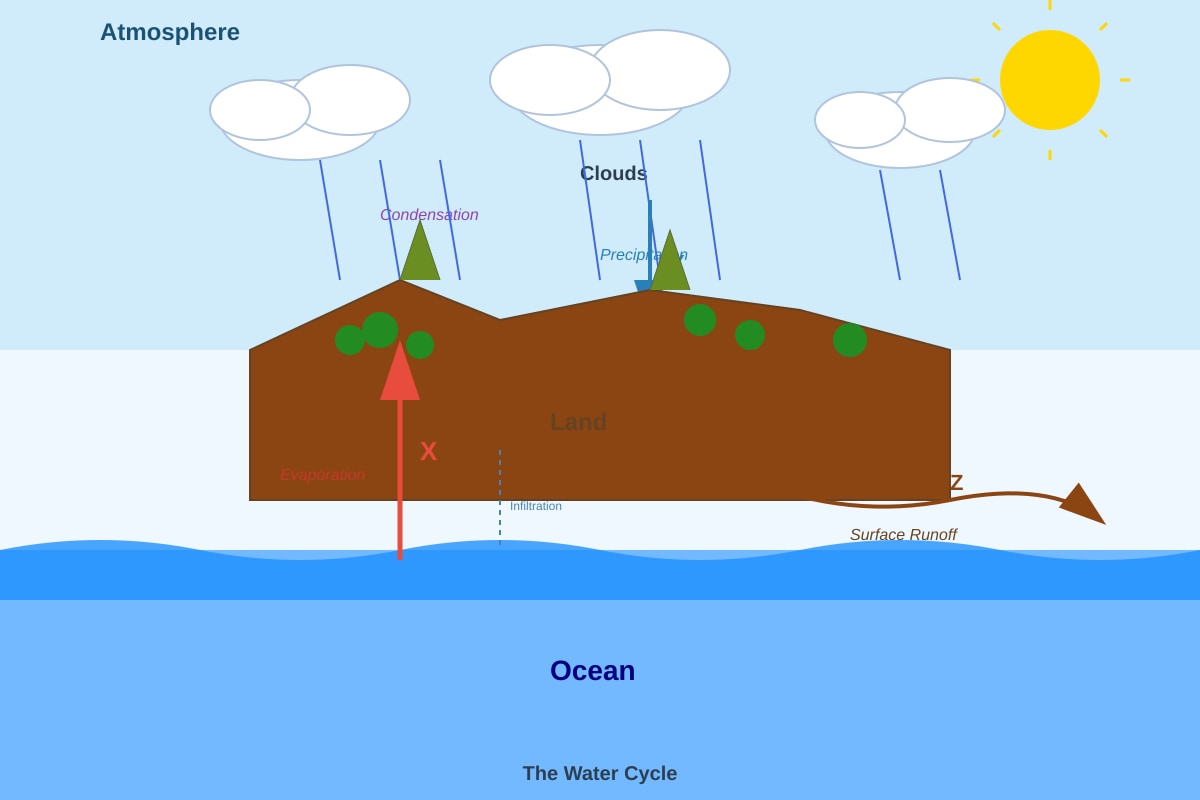
Generated diagram for Q3.
☐ A. Condensation
☐ B. Precipitation
☐ C. Evaporation
☐ D. Surface runoff
4. Which of the following is a negative impact of deforestation on water resources? [1]
☐ A. Increased groundwater recharge
☐ B. Reduced soil erosion
☐ C. Increased surface runoff and flooding
☐ D. Improved water quality in rivers
5. NEWater is a key pillar of Singapore's water sustainability. What process is primarily used to produce NEWater? [1]
☐ A. Desalination
☐ B. Membrane filtration and UV disinfection
☐ C. Cloud seeding
☐ D. Groundwater extraction
6. Study the table below showing water consumption per person per day in four countries. Which country has the highest domestic water consumption? [1]
| Country | Domestic Water Consumption (litres/person/day) |
|---|---|
| A | 150 |
| B | 280 |
| C | 210 |
| D | 180 |
☐ A. Country A
☐ B. Country B
☐ C. Country C
☐ D. Country D
7. Which human activity is the largest contributor to the enhanced greenhouse effect? [1]
☐ A. Volcanic eruptions
☐ B. Burning of fossil fuels
☐ C. Photosynthesis by plants
☐ D. Ocean currents
8. Mangrove forests are important for coastal protection. Which of the following describes their role? [1]
☐ A. They increase wave energy reaching the shore
☐ B. Their roots trap sediment and reduce coastal erosion
☐ C. They prevent all flooding during high tides
☐ D. They increase the salinity of coastal waters
9. The concept of "sustainable development" means: [1]
☐ A. Developing as fast as possible without any restrictions
☐ B. Meeting present needs without compromising future generations' ability to meet their needs
☐ C. Protecting the environment at the expense of all economic growth
☐ D. Using only non-renewable resources for development
10. Which of the following is an example of a non-renewable energy resource? [1]
☐ A. Solar energy
☐ B. Wind energy
☐ C. Natural gas
☐ D. Biomass
Section B: Structured Questions (18 marks)
Answer all questions in the spaces provided.
11. The diagram below shows a cross-section of a tropical rainforest. [3]
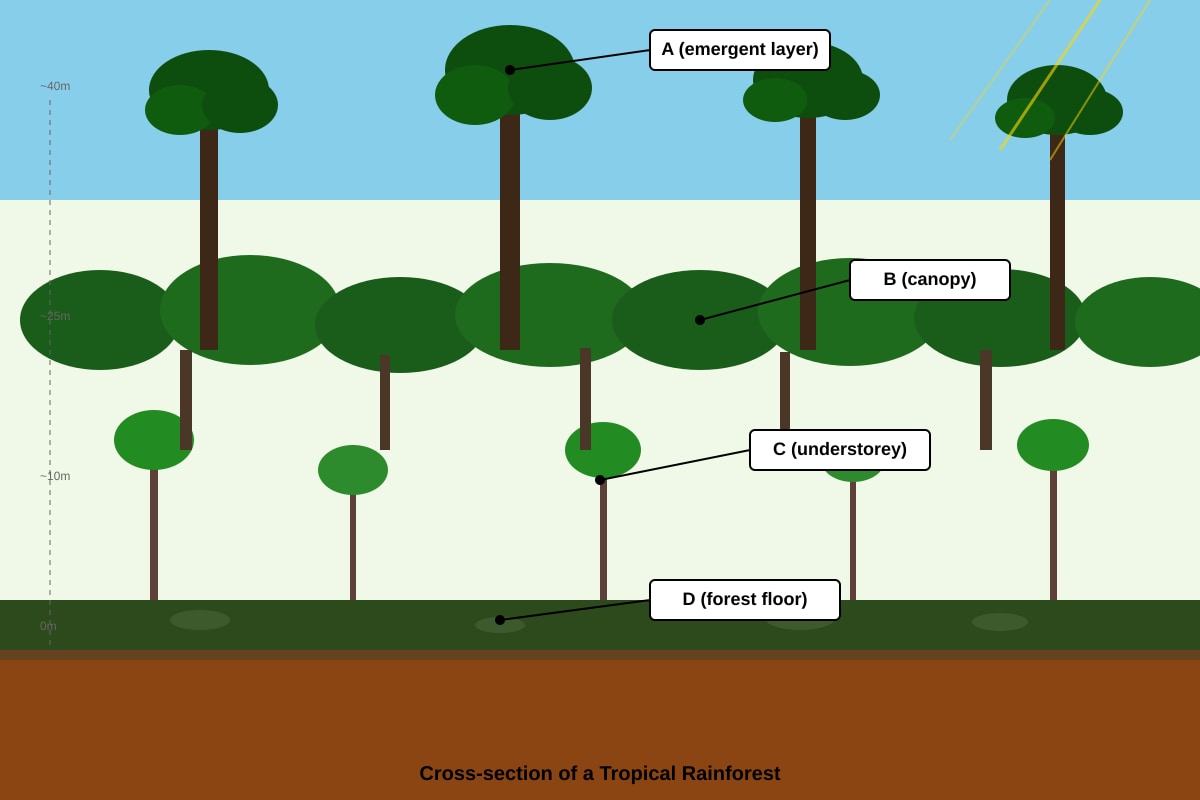
Generated diagram for Q11.
(a) Identify the layer labelled B.
(b) State two characteristics of the vegetation in layer B.
(c) Explain why the forest floor (layer D) receives very little sunlight.
12. Singapore's Four National Taps provide a diversified water supply. [4]
(a) Name all four national taps.
(b) Explain why having a diversified water supply is important for Singapore's water security.
13. The graph below shows the trend in global carbon dioxide (CO₂) concentration from 1960 to 2020. [4]
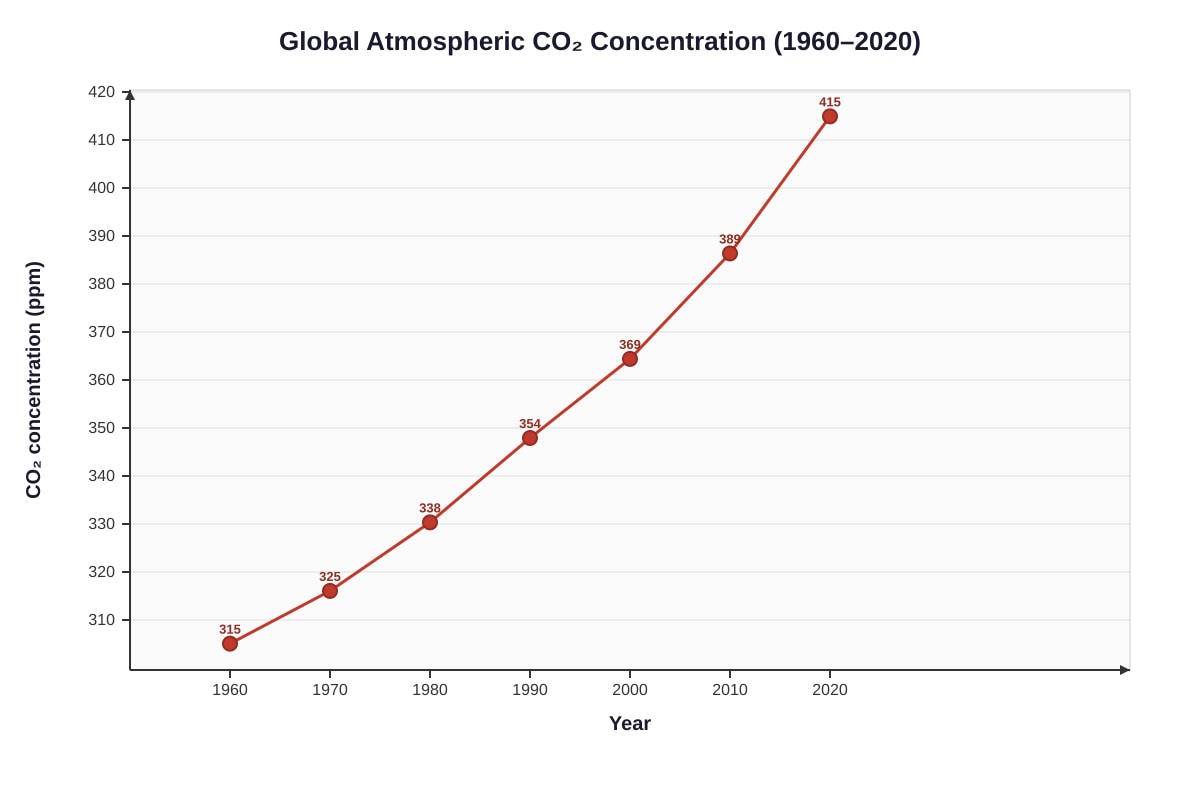
Generated graph for Q13.
(a) Describe the trend in global CO₂ concentration from 1960 to 2020.
(b) Calculate the increase in CO₂ concentration between 1990 and 2020. Show your working.
(c) State one human activity that has contributed to this trend.
14. The table below shows the advantages and disadvantages of two energy resources. [4]
| Energy Resource | Advantages | Disadvantages |
|---|---|---|
| Solar | Renewable, no air pollution during operation | Intermittent (depends on sunlight), high initial cost |
| Coal | Reliable supply, high energy density | Non-renewable, releases CO₂ and pollutants |
(a) Using the table, explain why solar energy is considered more sustainable than coal.
(b) Despite its disadvantages, why do some countries continue to use coal?
15. Study the photograph below showing a high-tech vertical farm in Singapore. [3]
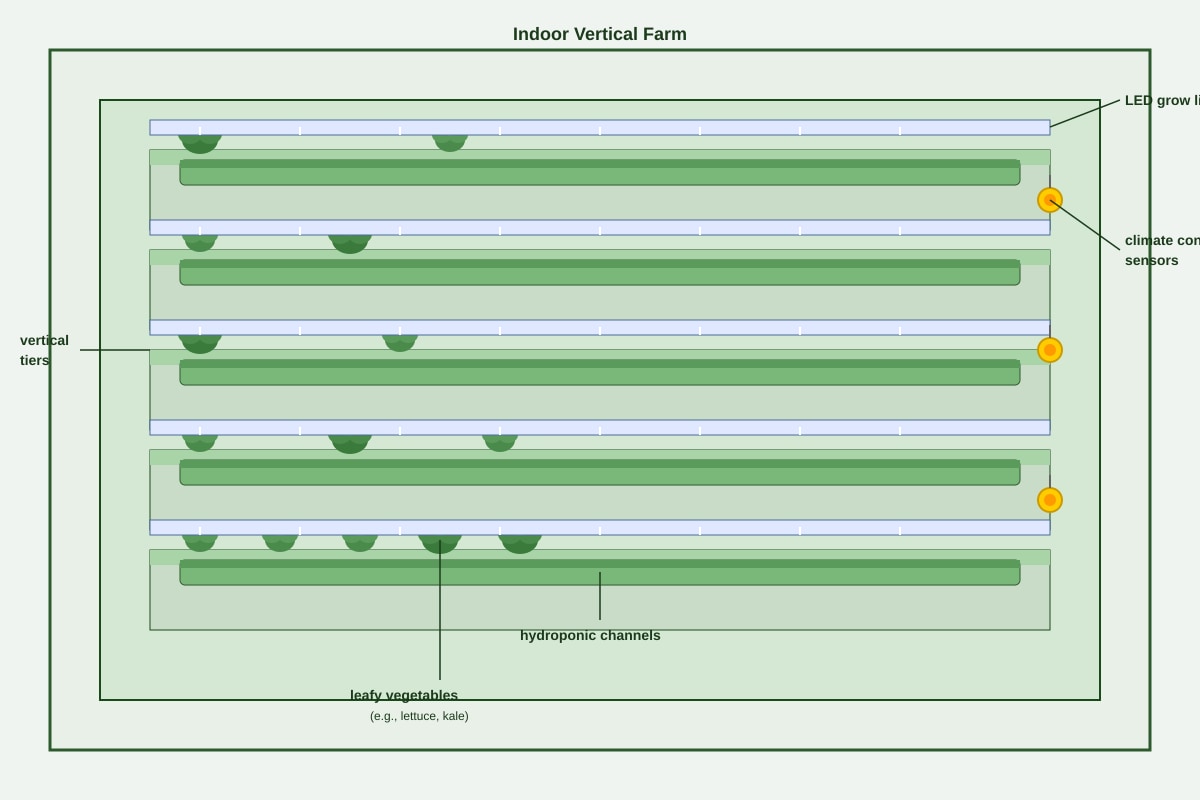
Generated source_image for Q15.
(a) Identify the farming method shown in the photograph.
(b) State two benefits of this farming method for land-scarce Singapore.
16. The table below shows the percentage of waste recycled in Singapore from 2010 to 2020. [3]
| Year | Overall Recycling Rate (%) |
|---|---|
| 2010 | 58 |
| 2015 | 61 |
| 2020 | 52 |
(a) Describe the trend in Singapore's overall recycling rate from 2010 to 2020.
(b) Suggest one reason for the change in recycling rate between 2015 and 2020.
(c) State one way households can improve recycling rates.
17. The diagram below shows a simplified food web in a mangrove ecosystem. [4]
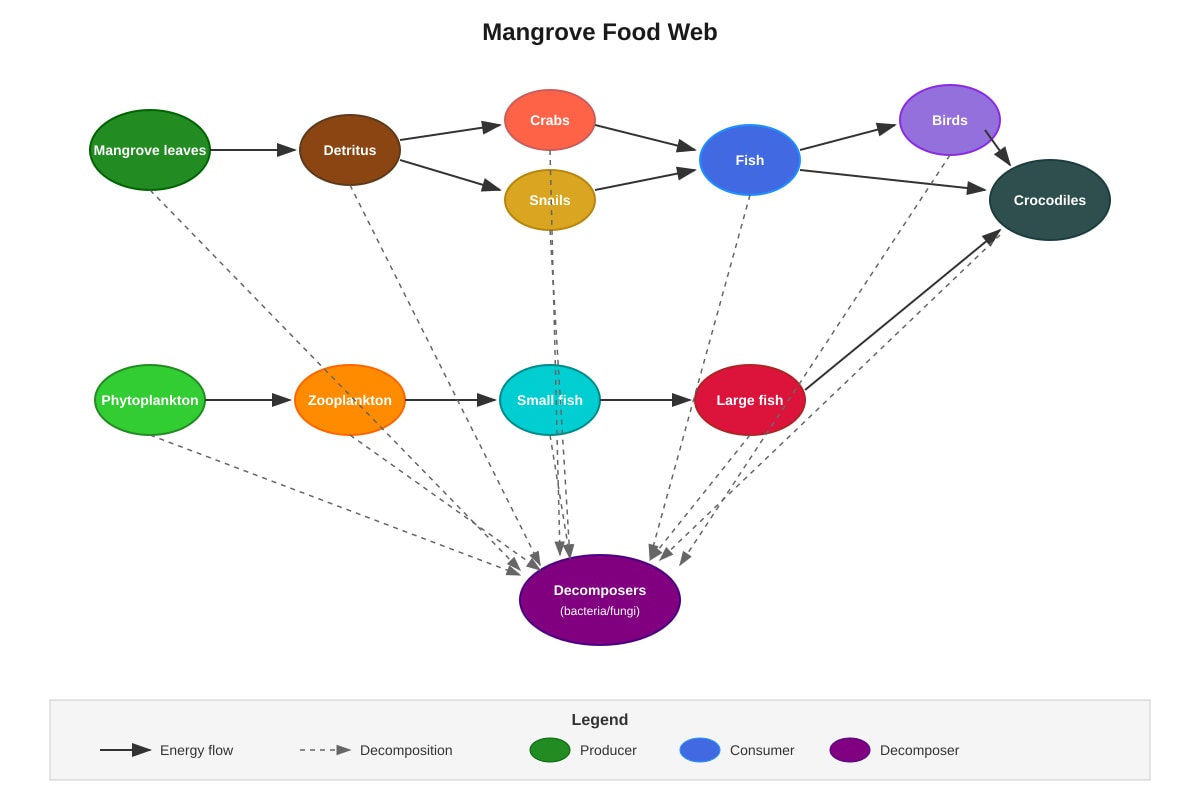
Generated diagram for Q17.
(a) Identify one producer in this food web.
(b) Using the food web, explain how energy is transferred from producers to tertiary consumers.
(c) State the role of decomposers in this ecosystem.
18. Singapore aims to achieve its "30 by 30" goal for food security. [3]
(a) Explain what the "30 by 30" goal means.
(b) Describe one challenge Singapore faces in achieving this goal.
(c) Suggest one strategy, other than vertical farming, to increase local food production.
19. The photograph below shows a solar panel installation on a HDB block in Singapore. [3]
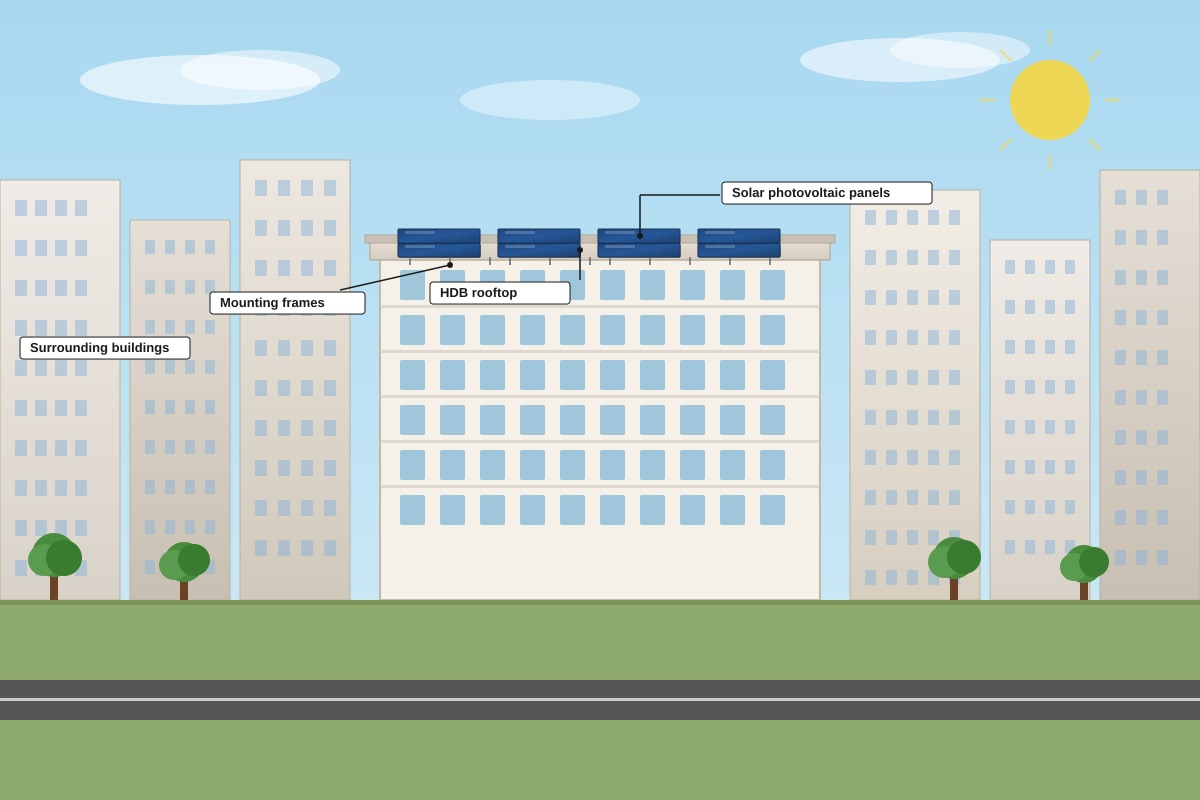
Generated source_image for Q19.
(a) Identify the energy conversion that takes place in solar panels.
(b) State one advantage and one disadvantage of solar energy in Singapore's context.
Advantage: ______________________________________________________________________
Disadvantage: ____________________________________________________________________
(c) Explain why deploying solar panels on HDB rooftops is a suitable strategy for Singapore.
20. "Individual actions can contribute significantly to resource sustainability." [6]
(a) Describe two actions individuals can take to reduce their carbon footprint.
(b) Explain two reasons why individual actions alone may not be sufficient to achieve resource sustainability.
(c) Suggest one way the government can encourage sustainable behaviour among citizens.
End of Quiz
Answers
Secondary 1 Geography Quiz - Resources Sustainability (Answer Key)
Total Marks: 40
Section A: Multiple Choice Questions (10 marks)
1. B [1]
Explanation: A renewable resource is one that can be replenished naturally over a relatively short period (e.g., solar energy, wind, biomass). Option A describes a non-renewable resource. Options C and D are incorrect generalisations.
2. C [1]
Explanation: Singapore's food security strategy is based on three "food baskets": diversifying import sources (importing from over 170 countries), growing locally (high-tech urban farming), and growing overseas (investing in farms abroad). Option C correctly captures the first two strategies.
3. C [1]
Explanation: Arrow X points upward from the ocean surface to the atmosphere, representing evaporation — the process where liquid water changes to water vapour due to heat from the sun. Condensation (A) is the opposite process (vapour to liquid). Precipitation (B) is water falling from clouds. Surface runoff (D) is water flowing over land.
4. C [1]
Explanation: Deforestation removes tree cover, leaving soil exposed to rain. This increases surface runoff (water flows quickly overland instead of infiltrating) and leads to flooding. It also increases soil erosion (not reduces it, so B is wrong) and reduces groundwater recharge (A is wrong). Water quality worsens due to sediment (D is wrong).
5. B [1]
Explanation: NEWater is produced by treating used water through membrane filtration (microfiltration and reverse osmosis) followed by UV disinfection. This makes it ultra-clean and safe for industrial and indirect potable use. Desalination (A) treats seawater, not used water.
6. B [1]
Explanation: Country B has the highest value at 280 litres/person/day. This is a direct data reading question.
7. B [1]
Explanation: The burning of fossil fuels (coal, oil, natural gas) for energy, transport, and industry is the largest human source of CO₂ emissions, driving the enhanced greenhouse effect. Volcanic eruptions (A) contribute far less. Photosynthesis (C) removes CO₂. Ocean currents (D) redistribute heat but do not cause the enhanced greenhouse effect.
8. B [1]
Explanation: Mangrove roots trap sediment and dissipate wave energy, reducing coastal erosion and protecting shorelines. They do not increase wave energy (A), prevent all flooding (C — they reduce impact but not all flooding), or increase salinity (D — they tolerate salt but don't increase it).
9. B [1]
Explanation: This is the classic Brundtland Commission definition (1987): "Meeting present needs without compromising future generations' ability to meet their needs." It balances economic, social, and environmental needs across time.
10. C [1]
Explanation: Natural gas is a fossil fuel formed over millions of years — a non-renewable resource. Solar (A), wind (B), and biomass (D) are renewable.
Section B: Structured Questions (18 marks)
11. Tropical Rainforest Cross-Section [3]
(a) Canopy [1]
Layer B is the dense, continuous layer of tree crowns forming the "roof" of the rainforest.
(b) Any two of: [2]
- Tall trees (30–45 m) forming a dense, continuous layer
- Broad, waxy leaves with drip tips to shed water
- Epiphytes (e.g., orchids, ferns) and lianas (woody vines) grow on branches
- High biodiversity; most rainforest animals live here
- Leaves adapted to capture maximum sunlight
(c) The dense canopy (layer B) blocks most sunlight from reaching the forest floor. Only about 1–2% of sunlight penetrates to layer D, so little undergrowth survives. [1]
Key concept: Vertical stratification and light competition.
12. Singapore's Four National Taps [4]
(a) [2]
- Water from local catchment (rainwater collected in reservoirs)
- Imported water (from Johor, Malaysia)
- NEWater (high-grade reclaimed water)
- Desalinated water (treated seawater)
1 mark for any 2 correct; 2 marks for all 4 correct.
(b) [2]
- Reduces vulnerability: If one source fails (e.g., drought affects local catchment, political issues affect imports), others can compensate.
- Climate resilience: Weather extremes (droughts, floods) impact sources differently; diversification ensures continuous supply.
- Long-term sustainability: Meets growing demand without over-relying on any single finite source.
- Negotiating leverage: Less dependence on imported water strengthens water security.
Any two well-explained reasons for 2 marks.
13. Global CO₂ Concentration Trend [4]
(a) [1]
CO₂ concentration has increased steadily from about 315 ppm in 1960 to about 415 ppm in 2020 — a rise of ~100 ppm over 60 years. The rate of increase has also accelerated in recent decades.
(b) [2]
Working:
CO₂ in 2020 = 415 ppm
CO₂ in 1990 = 354 ppm
Increase = 415 − 354 = 61 ppm
1 mark for correct reading of values, 1 mark for correct subtraction and answer with unit (ppm).
(c) [1]
Burning of fossil fuels (coal, oil, natural gas) for electricity, transport, and industry.
Other acceptable answers: Deforestation, cement production, industrial processes.
14. Energy Resource Comparison [4]
(a) [2]
Solar is renewable (sunlight is continuously available) while coal is non-renewable (finite, takes millions of years to form). Solar produces no air pollution or CO₂ during operation, whereas coal releases CO₂, SO₂, NOₓ, and particulates, contributing to climate change and health problems. Therefore, solar can be used indefinitely without depleting resources or harming the environment, making it more sustainable.
(b) [2]
- Reliable baseload power: Coal plants can operate 24/7 regardless of weather, unlike intermittent solar.
- High energy density: Small amounts of coal produce large amounts of energy; infrastructure already exists.
- Lower upfront cost: Cheaper to build and operate in the short term where carbon pricing is absent.
- Energy security: Countries with domestic coal reserves reduce import dependence.
- Economic factors: Jobs in mining and power sectors; transition costs to renewables are high.
Any two valid reasons for 2 marks.
15. Vertical Farming in Singapore [3]
(a) Vertical farming / Indoor high-tech farming / Hydroponic vertical farming [1]
Accept any term describing multi-tier, controlled-environment, soilless cultivation.
(b) Any two of: [2]
- Maximises land use: Grows more food per square metre by stacking vertically — critical for land-scarce Singapore.
- Climate-controlled: Unaffected by weather, haze, or heavy rain; consistent yields year-round.
- Water-efficient: Hydroponics uses 90–95% less water than soil farming.
- Pesticide-free: Enclosed environment reduces pests; safer produce.
- Reduces food miles: Located in urban areas; fresher produce, lower transport emissions.
- Supports "30 by 30" goal: Helps Singapore produce 30% of nutritional needs locally by 2030.
16. Singapore's Recycling Trends [3]
(a) [1]
The overall recycling rate increased slightly from 58% in 2010 to 61% in 2015, but then decreased significantly to 52% in 2020, ending lower than the 2010 rate.
(b) [1]
China's "National Sword" policy (2018) banned imports of contaminated recyclables, disrupting global recycling markets and reducing Singapore's recycling rate as export options shrank.
Other acceptable answers: COVID-19 pandemic disruptions to collection/sorting; increased contamination of recyclables; lower global demand for recycled materials.
(c) [1]
Rinse and clean recyclables before placing them in the blue bin to avoid contamination (e.g., no food residue in containers).
Other acceptable answers: Separate waste correctly (know what can/cannot be recycled), reduce use of disposables, participate in e-waste recycling programmes.
17. Mangrove Food Web [4]
(a) Mangrove leaves OR Phytoplankton [1]
Both are producers (photosynthesise).
(b) [2]
Energy flows from producers (mangrove leaves/phytoplankton) → primary consumers (detritus feeders like crabs/snails, or zooplankton) → secondary consumers (fish/birds/small fish) → tertiary consumers (crocodiles/large fish). At each trophic level, only about 10% of energy is transferred; the rest is lost as heat through respiration, waste, and uneaten parts. Decomposers break down dead organisms at all levels, recycling nutrients back to producers.
(c) [1]
Decomposers (bacteria and fungi) break down dead organic matter and waste, releasing nutrients (e.g., nitrates, phosphates) back into the environment for producers to reuse, completing the nutrient cycle.
18. Singapore's "30 by 30" Goal [3]
(a) [1]
The "30 by 30" goal aims for Singapore to produce 30% of its nutritional needs locally by 2030, up from less than 10% currently, to strengthen food security.
(b) [1]
Severe land scarcity — only about 1% of Singapore's land is allocated for agriculture, competing with housing, industry, defence, and nature reserves.
Other acceptable answers: High energy and manpower costs for high-tech farming; climate change impacts (heat, floods); reliance on imported feed/inputs for aquaculture; limited variety of food that can be grown locally.
(c) [1]
Rooftop farming on HDB carparks, commercial buildings, and schools.
Other acceptable answers: Indoor hydroponic/aeroponic farming in repurposed industrial spaces; floating sea farms for fish/seaweed; urban community gardens; insect farming for protein; lab-grown meat facilities.
19. Solar Panels on HDB Rooftops [3]
(a) [1]
Solar (radiant) energy → Electrical energy (via photovoltaic effect).
(b) [2]
Advantage: Renewable and clean — no CO₂ emissions during operation; reduces reliance on fossil fuels.
Disadvantage: Intermittent — depends on sunlight (cloud cover, night); requires energy storage or grid integration for consistent supply.
Other acceptable advantages: Uses unused roof space; lowers electricity bills for town councils; modular and scalable. Other disadvantages: High upfront cost; efficiency reduced by shading/tropical heat; visual impact.
(c) [1]
Singapore has limited land for ground-mounted solar farms, but vast unused rooftop space on HDB blocks (over 10,000 blocks). Deploying solar on rooftops maximises existing infrastructure, avoids land competition, and generates power close to where it is consumed (reducing transmission losses), making it ideal for dense urban environments.
Section C: Extended Response Questions (12 marks)
16. Water Conservation in Singapore [6]
(a) Two ways households can reduce water consumption: [2]
- Take shorter showers (e.g., 5 minutes instead of 15) and turn off tap while soaping — saves up to 27 litres per shower.
- Use water-efficient appliances (4-tick WELS rated washing machines, dual-flush toilets) — reduces per-use consumption significantly.
Other acceptable answers: Fix leaks promptly, wash vegetables in a container not running tap, use a mug when brushing teeth, collect rinse water for plants, run washing machine only on full load.
(b) Two reasons why conservation matters despite Four National Taps: [4]
- Energy and carbon footprint: Producing NEWater and desalinated water is energy-intensive (reverse osmosis requires high pressure). Conserving water reduces energy demand and carbon emissions, supporting Singapore's climate goals.
- Cost and infrastructure limits: Expanding supply infrastructure (new desalination plants, deeper tunnels) is expensive and land-intensive. Demand management through conservation delays costly expansions and keeps water affordable.
Other acceptable reasons: Climate change may reduce rainfall reliability; imported water agreement expires 2061; conservation fosters resilience mindset; reduces wastewater treatment load.
17. Tropical Rainforests as "Lungs of the Earth" [6]
(a) [2]
Tropical rainforests absorb vast amounts of CO₂ during photosynthesis and store carbon in biomass (trees, soil), acting as a major carbon sink. They also release water vapour through transpiration, driving regional and global rainfall patterns (e.g., "flying rivers" from the Amazon). This regulates temperature and precipitation globally. Deforestation releases stored carbon, accelerating climate change.
(b) Two threats to tropical rainforests in Southeast Asia: [2]
- Commercial logging (legal and illegal) for timber, often followed by land conversion.
- Conversion to oil palm plantations — the leading driver of deforestation in Indonesia and Malaysia.
Other acceptable answers: Mining (coal, gold); infrastructure development (roads, dams); forest fires (often human-lit for land clearing); smallholder agriculture; climate change (droughts increase fire risk).
(c) One strategy to sustainably manage tropical rainforests: [2]
Reduced Impact Logging (RIL) with strict certification (e.g., FSC) — carefully planned extraction that minimises damage to residual forest, protects waterways, and allows regeneration. Combined with protected areas, community-based management, and eco-tourism, this balances economic use with conservation.
Other acceptable answers: Establishing and enforcing protected areas; payment for ecosystem services (REDD+); sustainable agroforestry; indigenous land rights recognition; zero-deforestation supply chain commitments by corporations.
18. Individual Actions and Resource Sustainability [6]
(a) Two actions individuals can take to reduce their carbon footprint: [2]
- Use public transport, walk, or cycle instead of driving — transport is a major emissions source.
- Reduce meat consumption (especially beef) — livestock produces methane and requires large land/water/feed inputs.
Other acceptable answers: Switch to green electricity plans; reduce air travel; buy less fast fashion; reduce food waste; use energy-efficient appliances; support local produce.
(b) Two reasons why individual actions alone may not be sufficient: [2]
- Systemic barriers: Infrastructure (e.g., lack of cycling paths, unreliable public transport), pricing (green products often cost more), and urban design limit individual choices.
- Scale of emissions: Major sources (power generation, industry, shipping, aviation) are corporate/government decisions; the top 100 companies account for ~70% of global emissions. Individual lifestyle changes cannot override structural systems.
Other acceptable reasons: Collective action problems (free-rider effect); rebound effects (efficiency gains offset by increased consumption); need for policy signals (carbon pricing, regulations); global coordination required.
(c) One way the government can encourage sustainable behaviour: [2]
Implement a carbon tax with revenue recycling — price carbon to reflect its true cost, then return revenues as rebates or green subsidies (e.g., for energy-efficient appliances, EV adoption). This makes sustainable choices cheaper and high-carbon choices costlier, shifting behaviour at scale.
Other acceptable answers: Mandate green building standards; expand public transport and cycling infrastructure; ban single-use plastics; subsidise renewable energy; introduce Extended Producer Responsibility (EPR) for e-waste/packaging; integrate sustainability into school curriculum.
End of Answer Key
Free quiz and exam paper access
Enter your details to view this paper
Your access is remembered on this device.