AI Generated Quiz
Secondary 1 Geography Physical Geography Quiz
Free Sec 1 Geography Physical Geography quiz, Nemo3 AI version, with questions, answers, and syllabus-aligned practice for Singapore students.
These static practice materials are generated from the site's syllabus and paper-generation workflow, with source and model context shown so students and parents can evaluate the material before use.
Questions

Free quiz and exam paper access
Enter your details to view this paper
Your access is remembered on this device.
Answers
Secondary 1 Geography Quiz - Physical Geography (Answer Key)
Total Marks: 40
Section A: Water Cycle and Water Stores (Questions 1–5) [10 marks]
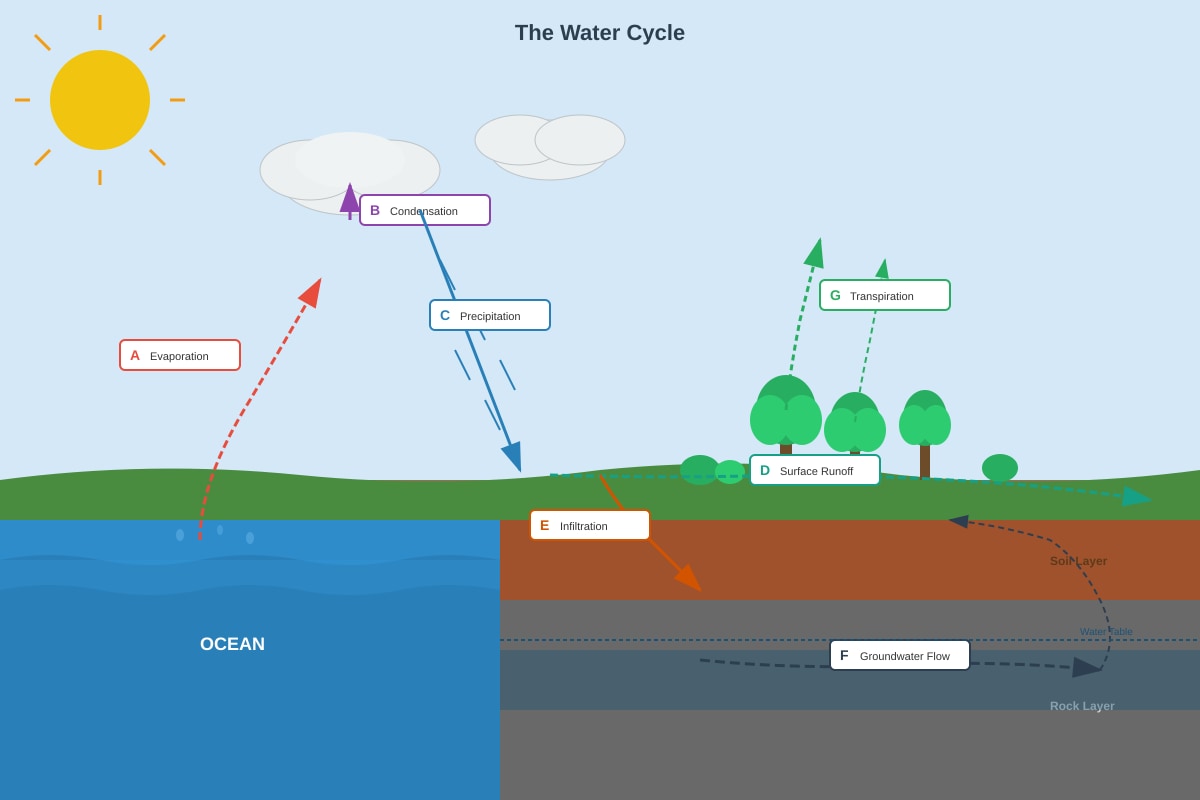
1. Water Cycle Diagram
(a) [3 marks – 1 mark each]
- A: Evaporation (from ocean surface)
- C: Precipitation (rain/snow/hail falling from clouds)
- G: Transpiration (water vapour released from plant leaves)
Teaching note: Evaporation is driven by solar heat; condensation forms clouds; precipitation returns water to land/sea; transpiration is plant "breathing" – together with evaporation, it's called evapotranspiration.
(b) [1 mark]
Infiltration is the downward movement of water into the soil/ground, while surface runoff is water flowing over the land surface into streams.
Common mistake: Confusing infiltration with percolation (deeper movement into groundwater). Infiltration is entry into soil; percolation is movement beyond soil to aquifer.
2. Earth's Water Stores
(a) [2 marks – 1 for working, 1 for answer]
Working: 100% – 97.2% (oceans) = 2.8%
Or sum of freshwater stores: 2.1 + 0.6 + 0.01 + 0.0001 + 0.001 = 2.7111% ≈ 2.8%
Answer: 2.8%
Teaching note: Over 97% of Earth's water is saline. Freshwater is scarce – most is locked in ice (2.1%) and groundwater (0.6%). Rivers and lakes hold a tiny fraction.
(b) [2 marks – 1 for each valid point]
- Groundwater is stored underground in aquifers, so it is less affected by seasonal droughts and evaporation compared to rivers.
- Groundwater recharges slowly and provides a more consistent, year-round supply, whereas river levels fluctuate greatly with rainfall.
Accept other valid points: Less pollution risk; larger total volume available.
3. Watershed Definition [1 mark]
A watershed (or drainage divide) is the highland boundary/ridge line that separates two adjacent drainage basins – it marks the area from which all surface water drains into a particular river system.
Teaching note: Think of it as the "rim of a bowl" – rain falling on one side flows into one river system; rain on the other side flows into another.
4. Human Activities Reducing Infiltration [2 marks – 1 each]
Any two of:
- Urbanisation – covering soil with impermeable surfaces (concrete, asphalt, buildings) prevents water from soaking in.
- Deforestation – removal of trees leaves soil exposed to rain, causing compaction and surface crusting, reducing pore spaces.
- Overgrazing/soil compaction by livestock or machinery reduces soil porosity.
- Drainage systems (storm drains) quickly channel water away, reducing time for infiltration.
5. River Basin Cross-Section
(a) [1 mark]
X: Watershed (or drainage divide / ridge line)
(b) [1 mark]
At Y (confluence), two or more tributaries join the main river, increasing the volume of water in the main channel downstream.
Teaching note: Confluences are where drainage density accumulates – the main river grows larger as it collects water from its tributary network.
Section B: Tropical Rainforests and Mangroves (Questions 6–12) [16 marks]
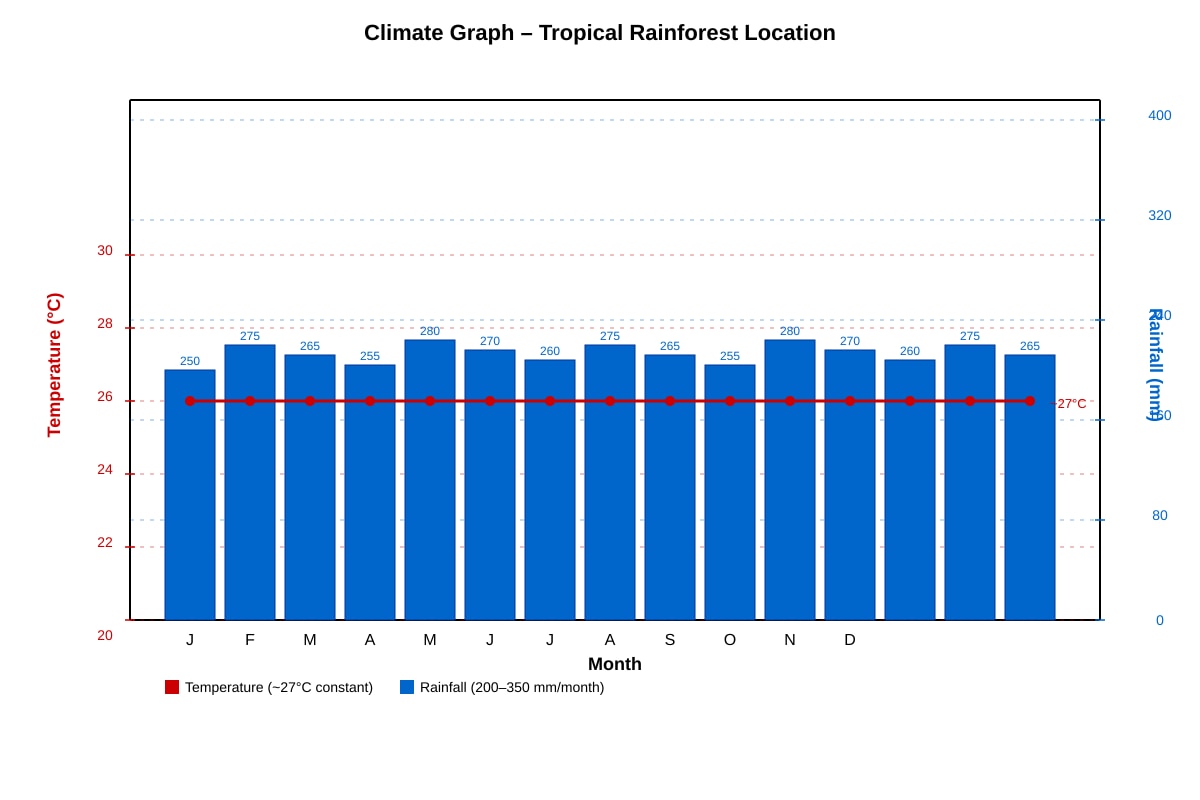
6. Tropical Rainforest Climate Graph
(a) [1 mark]
Annual temperature range = 2°C (or "very small / about 2°C", from 26°C to 28°C)
Teaching note: Tropical rainforests have low annual temperature range because the sun is overhead year-round near the equator.
(b) [1 mark]
Rainfall is high and evenly distributed throughout the year (no dry month; every month receives 200–350 mm).
Key phrase: "High, consistent, year-round rainfall" or "no distinct dry season."
(c) [2 marks – 1 for each valid point]
- The location is near the Equator, where the sun's altitude is high year-round (overhead at equinoxes), providing intense, consistent solar insolation.
- Day length is nearly constant (≈12 hours) throughout the year, so heating is uniform.
Teaching note: Contrast with temperate zones where tilt causes seasons. At the equator, the sun is always high → constant heating → high temps.
7. Rainforest Layers
(a) [1 mark]
Q: Canopy layer (or "canopy")
(b) [1 mark]
Any one valid adaptation for forest floor (low light):
- Large, broad leaves to capture maximum sunlight.
- Shade tolerance – able to photosynthesise at very low light intensities.
- Sapling strategy – rapid growth when a canopy gap opens.
Teaching note: Only ~1–2% of sunlight reaches the forest floor.
(c) [2 marks – 1 for each valid point]
- The canopy forms a dense, continuous layer of tree crowns (30–45 m) that intercepts most incoming solar radiation.
- Emergent trees are scattered, so the canopy is the main continuous surface exposed to the sun.
Teaching note: The canopy is the "powerhouse" of the rainforest – most photosynthesis occurs here.
8. Mangrove Environment Challenges [2 marks – 1 each]
Any two of:
- Waterlogged, anaerobic (oxygen-poor) soil – roots cannot respire.
- High salinity (salt water) – causes osmotic stress, difficult for water uptake.
- Regular tidal inundation/submergence – alternating wet/dry, mechanical stress from waves.
- Unstable, soft mud substrate – poor anchorage for roots.
- High temperatures and intense sunlight on exposed mudflats.
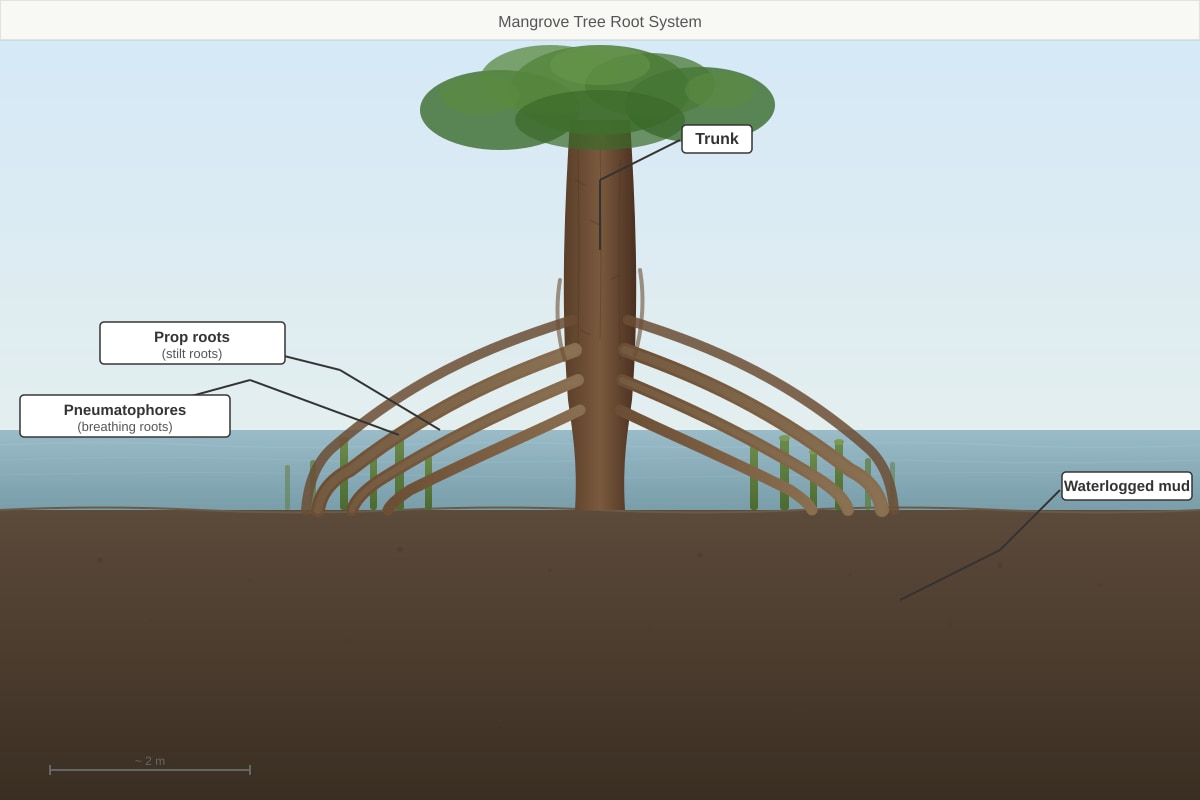
9. Mangrove Root Adaptations
(a) [2 marks – 1 each]
- Prop roots = Stilt roots (or "prop roots" accepted as name)
- Pneumatophores = Breathing roots (or "aerial roots / pneumatophores")
(b) [2 marks – 1 for identification, 1 for explanation]
- Pneumatophores grow vertically upwards from underground roots into the air.
- They have lenticels (pores) that allow gas exchange (oxygen in, CO₂ out) for root respiration in anaerobic mud.
Teaching note: Without pneumatophores, roots would suffocate in oxygen-depleted waterlogged soil.
10. Mangroves Protecting Coastlines [2 marks – 1 for mechanism, 1 for outcome]
- The dense network of prop roots and pneumatophores traps sediment and dissipates wave energy.
- This reduces coastal erosion and stabilises the shoreline, allowing land to build up behind the mangrove fringe.
Teaching note: Mangroves are "living seawalls" – they adapt to sea-level rise, unlike concrete walls.
11. Deforestation Data
(a) [2 marks – 1 for working, 1 for answer]
Working: (12,500 – 9,100) km² ÷ (2020 – 2010) years = 3,400 ÷ 10 = 340 km² per year
Answer: 340 km² per year
(b) [1 mark]
Any one valid human activity:
- Commercial logging / timber extraction
- Cattle ranching / agriculture (e.g., palm oil, soy)
- Mining / infrastructure development
- Settlement expansion / shifting cultivation
Teaching note: In SE Asia, palm oil plantations are a major driver.
12. Deforestation Effects on Local Climate [4 marks – 2 per consequence, 1 for identification + 1 for explanation]
Consequence 1: Reduced rainfall / drier climate
- Trees release water vapour through transpiration, which contributes to local cloud formation and precipitation.
- Deforestation reduces evapotranspiration, leading to less moisture in the air and lower rainfall.
Consequence 2: Higher temperatures / increased temperature range
- The canopy shades the forest floor, keeping it cool and humid.
- Removal of trees exposes the ground to direct sunlight, increasing daytime temperatures and diurnal temperature range.
Other valid consequences: Reduced humidity; increased surface runoff/flash floods; loss of cloud cover.
Section C: Rivers and Coasts (Questions 13–20) [14 marks]
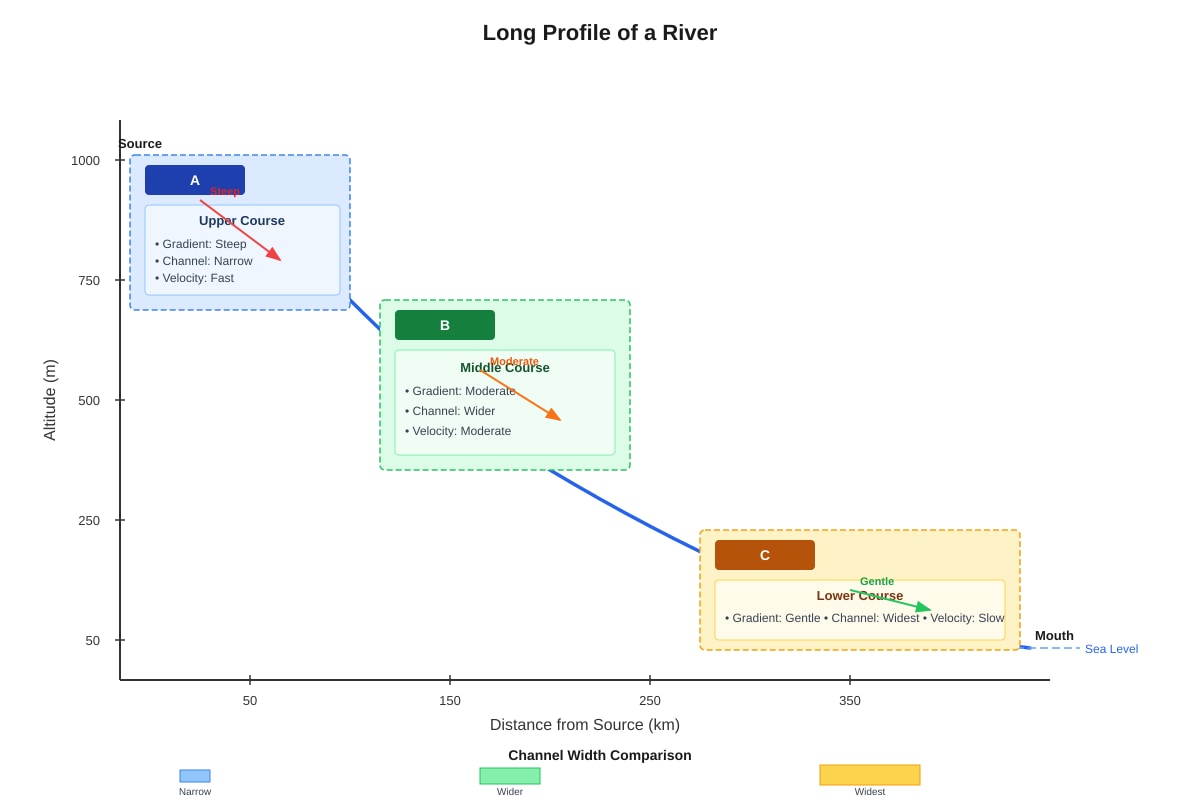
13. River Long Profile
(a) [1 mark]
B: Middle course (or "middle course")
(b) [1 mark]
Any one valid difference:
- Channel width: Narrow in upper course (A) → Widest in lower course (C)
- Gradient: Steep in upper course → Gentle/flat in lower course
- Velocity: Fast in upper course → Slower in lower course (near mouth)
- Valley shape: V-shaped (upper) → Wide, flat floodplain (lower)
- Dominant process: Vertical erosion (upper) → Deposition (lower)
Teaching note: The long profile is concave – steep at source, gentle at mouth – reflecting energy loss.
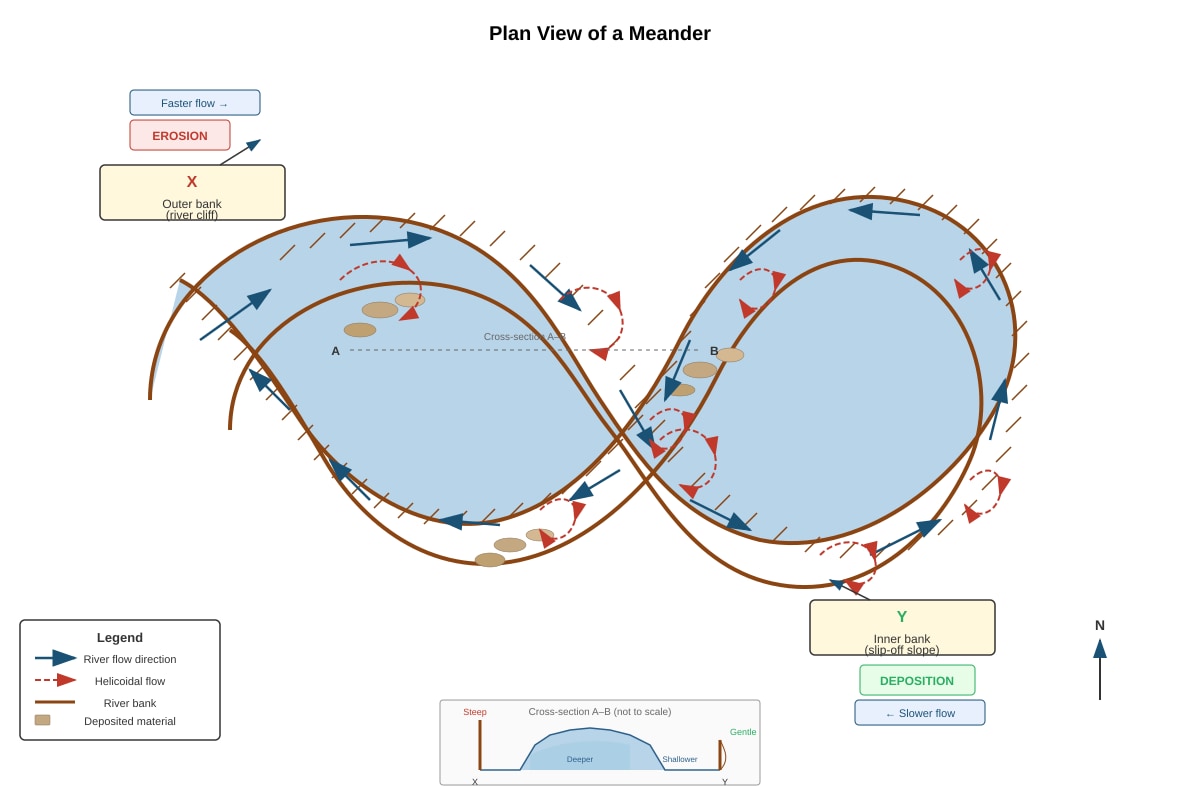
14. Meander Cross-Section
(a) [2 marks – 1 each]
- Process at X: Lateral erosion (or "hydraulic action / abrasion on outer bank")
- Landform: River cliff (or "cut bank / steep bank")
(b) [2 marks – 1 for velocity, 1 for deposition]
- Water velocity is lowest on the inner bend (Y) due to helicoidal flow (corkscrew motion) moving water from outer to inner bank at the bed.
- Reduced velocity means the river lacks energy to carry its load, so sediment is deposited, forming a slip-off slope (point bar).
Teaching note: Helicoidal flow is key – it erodes the outer bank and deposits on the inner bank simultaneously, causing meander migration.
15. Flood Risk Factors [2 marks – 1 each]
Any two of:
- Heavy/prolonged rainfall (exceeds infiltration capacity)
- Steep relief (rapid surface runoff)
- Impermeable geology/soil (clay, rock – low infiltration)
- Deforestation / urbanisation (reduced interception & infiltration)
- Drainage density (many streams = quick response)
- Snowmelt (sudden input)
- Human modifications (channelisation, levees failing)
Teaching note: Flood risk = hazard (rain) × vulnerability (basin characteristics) × exposure (people/property).
16. Coastal Spit
(a) [1 mark]
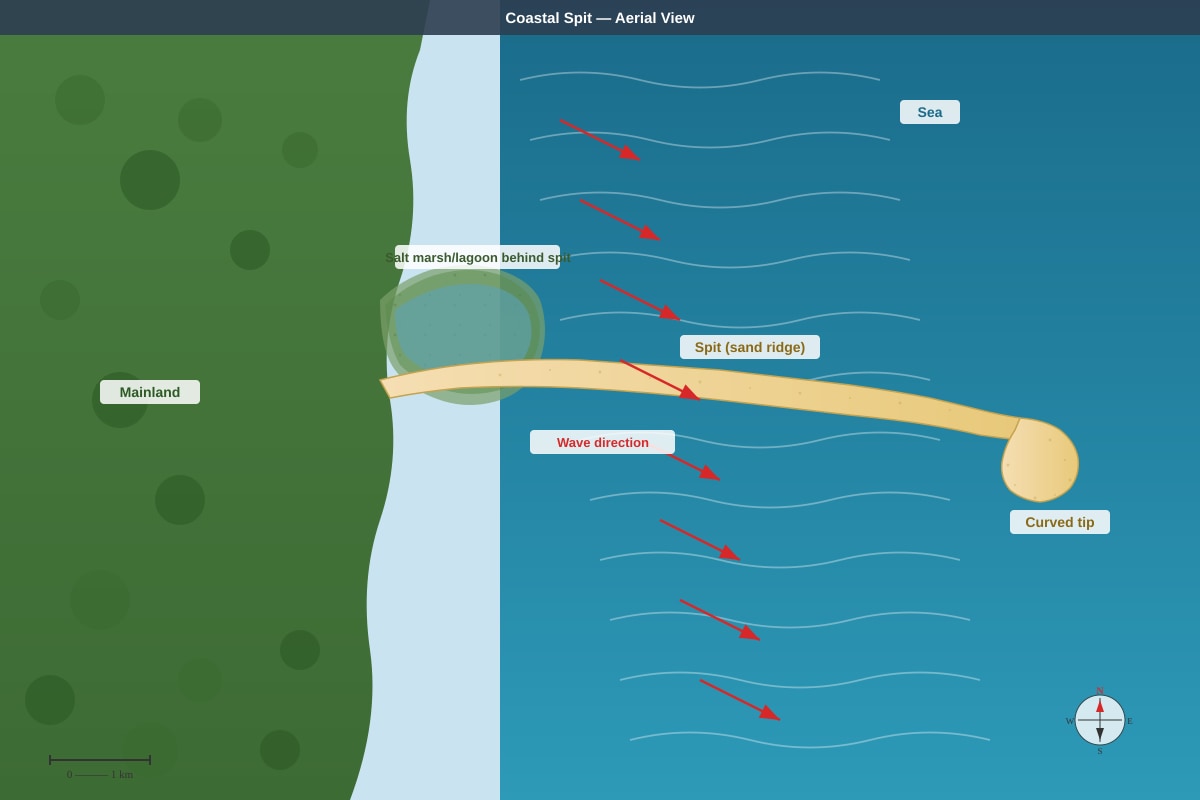
Longshore drift (or "longshore transport")
(b) [2 marks – 1 for process, 1 for shape link]
- Waves approach the coast at an angle (driven by prevailing wind).
- Swash carries sediment up the beach at an angle; backwash returns it perpendicular to shore (gravity).
- This zigzag movement transports sediment along the coast (longshore drift).
- Where the coastline changes direction (e.g., river mouth), sediment continues to be deposited in the original drift direction, forming a spit that extends outward and curves due to wave refraction/secondary winds.
Teaching note: The curved tip forms because waves refract around the end, or secondary wind directions curve the tip landward.
17. Constructive vs Destructive Waves [2 marks – 1 for each contrasting point]
| Feature | Constructive Waves | Destructive Waves |
|---|---|---|
| Wave height | Low (< 1 m) | High (> 1 m) |
| Wave frequency | Low (6–8 per min) | High (10–14 per min) |
| Swash vs Backwash | Strong swash, weak backwash → net deposition | Weak swash, strong backwash → net erosion |
| Beach effect | Build up beach (berms) | Erode beach (steep profile) |
| Typical season | Summer / calm weather | Winter / stormy weather |
Any one clear difference with correct contrast earns 2 marks.
18. Headland Erosion Sequence
(a) [2 marks – ½ each or 1 for correct sequence]
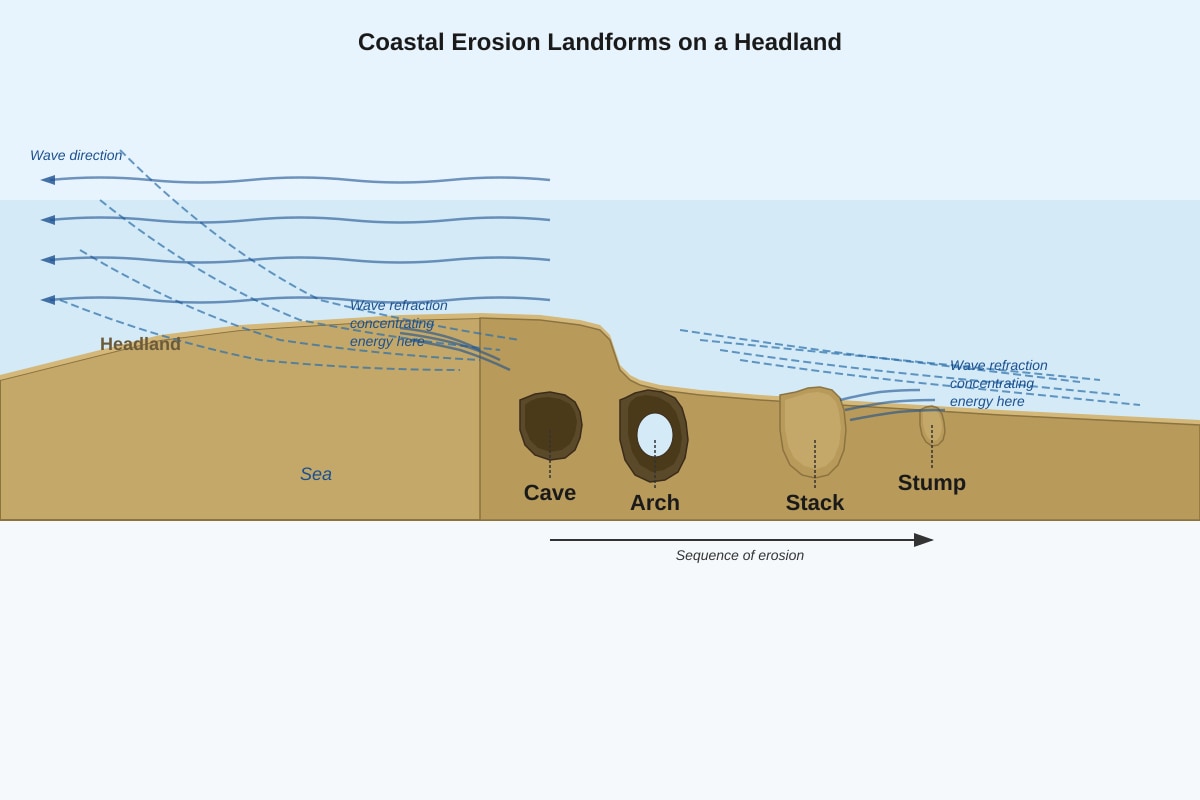
1. Cave → 2. Arch → 3. Stack → 4. Stump
Teaching note: Cave forms at weak point (fault/joint); two caves join → arch; arch roof collapses → stack; stack erodes → stump.
(b) [2 marks – 1 for refraction, 1 for energy concentration]
- Waves refract (bend) around the headland as they enter shallower water, because the part of the wave in shallower water slows down first.
- This converges wave orthogonals (energy) onto the sides of the headland, concentrating erosion on the headland while diverging energy in bays (deposition).
Teaching note: Wave refraction explains why headlands erode and bays fill – it's a self-reinforcing process straightening coastlines over time.
19. ABC Waters Programme [1 mark]
Any one valid way:
- Naturalising concrete drains/canals into vegetated, meandering streams with floodplains that store excess water during heavy rain.
- Creating wetlands/retention ponds that temporarily hold stormwater, reducing peak flow downstream.
- Slowing flow velocity with plants and natural features, increasing infiltration and reducing flash flood risk.
Teaching note: ABC Waters = "Active, Beautiful, Clean" – integrates drainage with recreation & biodiversity. Example: Bishan-Ang Mo Kio Park (Kallang River naturalised).
20. Hard vs Soft Engineering Evaluation [4 marks – Level-marked]
Level 3 (4 marks): Balanced evaluation with specific examples, clear comparison of effectiveness, sustainability, and cost.
Level 2 (2–3 marks): Some comparison, but limited detail or one-sided.
Level 1 (1 mark): Basic statements, little evaluation.
Expected content for full marks:
-
Hard engineering (seawalls, breakwaters, groynes, revetments):
- Effective short-term at protecting specific assets (roads, buildings).
- High cost to build and maintain; visually intrusive.
- Can increase erosion elsewhere (e.g., seawalls reflect wave energy → scour at base; groynes starve downdrift beaches).
- Rigid – cannot adapt to sea-level rise easily.
-
Soft engineering (beach nourishment, dune stabilisation, mangrove replanting, managed retreat):
- Works with natural processes; sustainable long-term.
- Lower maintenance cost; enhances biodiversity/recreation (e.g., mangroves = habitat + carbon sink).
- Adapts to sea-level rise (mangroves accrete sediment; dunes migrate).
- Limitations: Beach nourishment needs regular top-up; mangroves need suitable intertidal zone; managed retreat requires land.
-
Conclusion: Soft engineering is generally more sustainable and cost-effective long-term, but hard engineering may be necessary for immediate protection of critical infrastructure. Integrated approaches (e.g., seawall with mangrove belt in front) are increasingly used in Singapore (e.g., Pulau Tekong mangrove restoration with rock revetment).
Marking note: Credit specific Singapore examples (e.g., East Coast Park seawall + beach nourishment; Sungei Buloh mangroves; ABC Waters).
Common mistake: Listing methods without evaluating effectiveness (cost, longevity, side-effects, adaptability).