AI Generated Quiz
Secondary 1 Geography Physical Geography Quiz
Free Sec 1 Geography Physical Geography quiz, HY3 AI version, with questions, answers, and syllabus-aligned practice for Singapore students.
These static practice materials are generated from the site's syllabus and paper-generation workflow, with source and model context shown so students and parents can evaluate the material before use.
Questions
Free quiz and exam paper access
Enter your details to view this paper
Your access is remembered on this device.
Answers
Secondary 1 Geography Quiz - Physical Geography (Answer Key)
Total Marks: 40
Level: Secondary 1
Topic: Physical Geography
Section A: Map and Data Skills
Q1. (1 mark)
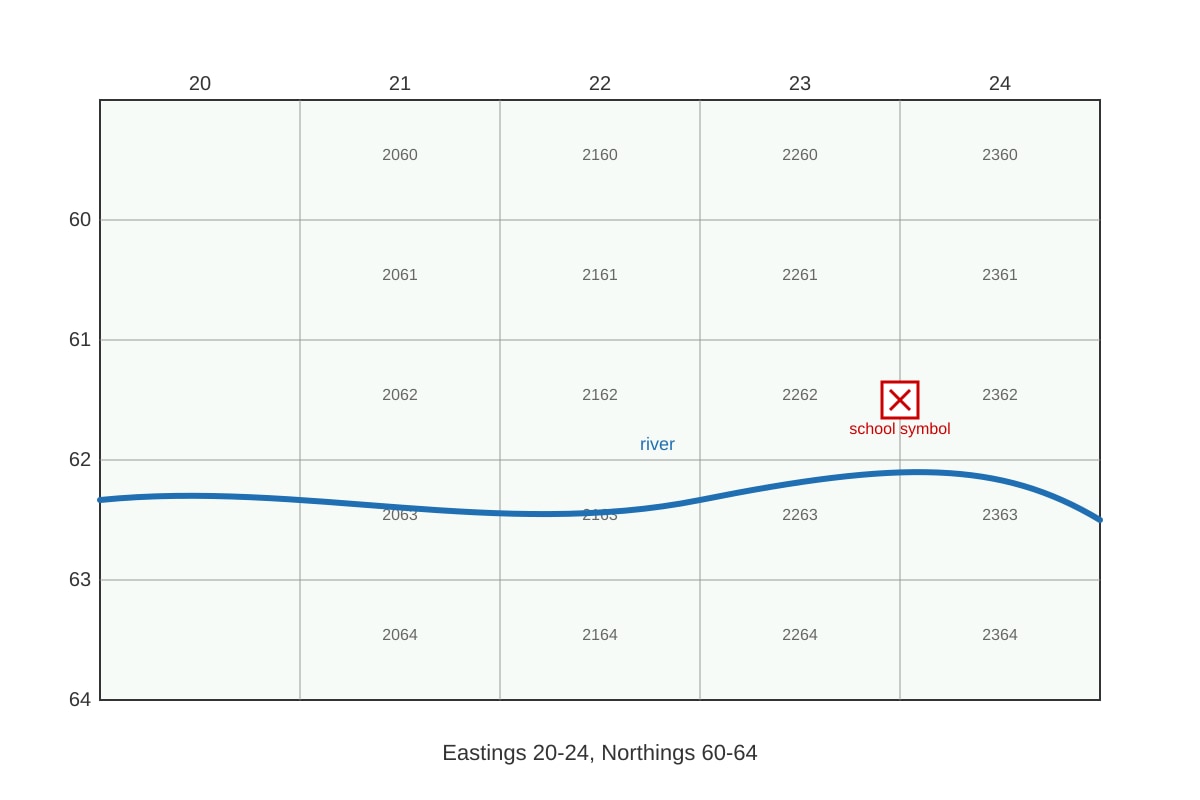
Answer: 2362
Teaching note: Read easting (horizontal, left to right) first = 23, then northing (vertical, bottom to top) = 62. Use the lower-left corner of the grid square containing the school.
Common mistake: Reversing order (northing before easting) gives wrong reference.
Q2. (1 mark)
Answer: 236263 (example; accept 236262–236263 range based on temple position in square 2362)
Teaching note: Start with 4-figure 2362, then subdivide square into 10×10. Temple is near top of square so northing subdivision ~6, easting ~3 → 236263.
Common mistake: Giving only 4 figures.
Q3. (1 mark)
Answer: 10 m
Teaching note: Contour interval is the vertical difference between adjacent labelled contour lines. On standard 1:50,000 map extracts used, interval is 10 m.
Common mistake: Confusing with map scale.
Q4. (3 marks)
Mark breakdown:
- 1 mark: Concentric contours / values increase toward centre → hill
- 1 mark: Approx. height (e.g., summit ~150 m)
- 1 mark: Slope description (e.g., steep where lines close)
Sample answer: The contour lines form concentric circles with values increasing towards the centre, showing a hill. The summit is about 150 m high. Slopes are steep on the east where contours are close together.
Q5. (3 marks)
Mark breakdown: 1 mark per valid pattern with evidence.
- Pattern 1: Distance from Sun increases from Mercury (58) to Mars (228) million km.
- Pattern 2: Earth has the largest diameter among the four (12,742 km) while Mercury is smallest (4,879 km).
Teaching note: Describe trends using comparative language and figures, not just single points.
Q6. (2 marks)
Answer: Site A (27.5°C) is cooler. (1 mark) Reason: It may be shaded by trees or located upstream away from urban heat. (1 mark)
Teaching note: Lower temperature = cooler. Link to environment.
Q7. (2 marks)
Answer: 2363 (or nearest school/north feature; based on map, north of river = grid square 2363) (1 mark for correct ref, 1 mark for stating it is north of river)
Teaching note: Identify feature north of river, then give 4-figure reference.
Section B: Water and the Hydrological Cycle
Q8. (3 marks)
Answers: 1) Solid (ice) 2) Liquid (water) 3) Gas (water vapour) — 1 mark each.
Q9. (1 mark)
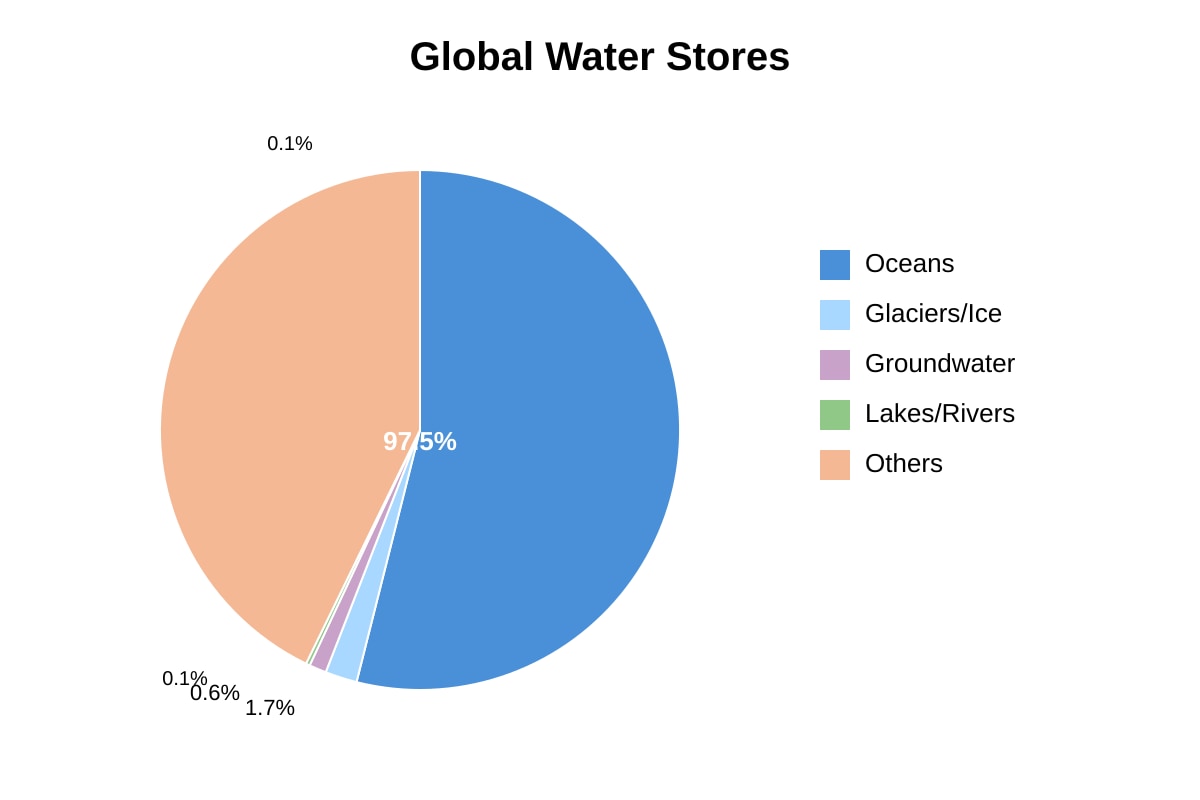
Answer: 97.5%
Teaching note: From pie chart, oceans slice is 97.5%.
Q10. (2 marks)
Mark breakdown: 1 mark definition, 1 mark renewable/finite link.
Sample: The hydrological cycle is the continuous movement of water between oceans, atmosphere, and land (1). It is driven by the sun and gravity, making water renewable but in fixed total amount (1).
Q11. (3 marks)
Mark breakdown: 1 mark oceans dominate, 1 mark freshwater small %, 1 mark difficulty for humans.
Sample: Oceans hold 97.5% of water (1). Only 0.1% is in lakes/rivers and 0.6% groundwater (1). This means very little is easily accessible freshwater for drinking and farming (1).
Q12. (2 marks)
Any two: drinking/washing, agriculture/irrigation, industry, recreation. 1 mark each.
Q13. (2 marks)
Working: Water budget = rainfall − evaporation = 1200 mm − 400 mm = 800 mm (1 mark method, 1 mark answer).
Teaching note: Budget shows surplus water in catchment.
Q14. (3 marks)
Mark breakdown: 1 mark action, 1 mark pollution mechanism, 1 mark example.
Sample: Factories discharge chemicals into rivers (1), contaminating water and harming organisms (1). Example: oil spill from ships (1).
Section C: Tropical Rainforests and Mangroves
Q15. (3 marks)
Answers: 1) Emergent layer 2) Canopy 3) Understory/Undergrowth — 1 mark each.
Q16. (3 marks)
Mark breakdown: 1 mark adaptation named, 2 marks explanation.
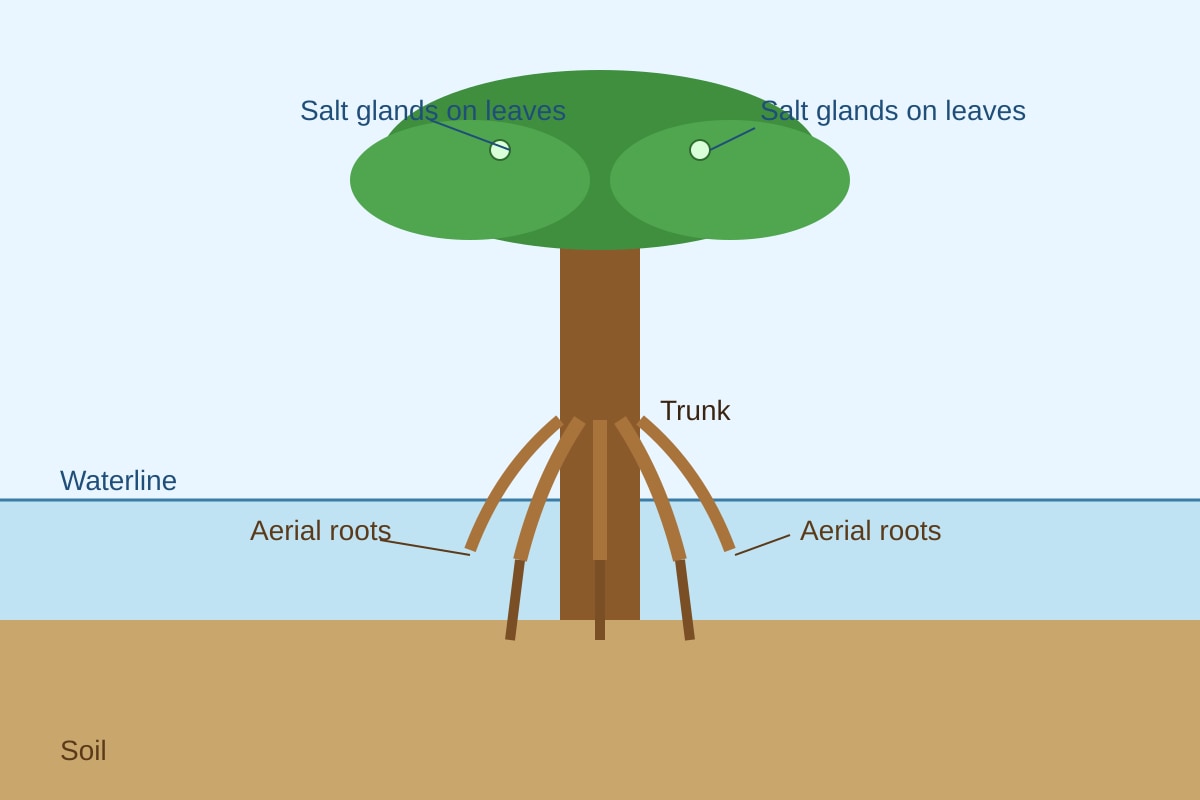
Sample: Aerial roots (1) help the tree breathe in waterlogged soil by taking in oxygen above ground (2).
Q17. (2 marks)
Any two: habitat for biodiversity, carbon storage, oxygen production, erosion prevention. 1 mark each.
Q18. (3 marks)
Mark breakdown: 1 mark trees store carbon, 1 mark cutting releases CO₂, 1 mark enhanced greenhouse.
Sample: Trees store carbon (1). Deforestation releases it as CO₂ (1), trapping more heat and enhancing greenhouse effect (1).
Q19. (2 marks)
Answer: Mangroves reduce wave impact and prevent coastal erosion (2 marks for clear reason).
Teaching note: Root systems bind soil.
Q20. (3 marks)
Mark breakdown: 1 mark strategy, 2 marks evaluation.
Sample: Selective logging (1) allows timber harvest while keeping forest cover, maintaining habitat and carbon storage (2).
Teaching note: Evaluation should weigh benefit vs limitation.