AI Generated Quiz
Secondary 1 Geography Map Graph Data Skills Quiz
Free Sec 1 Geography Map Graph Data Skills quiz, HY3 AI version, with questions, answers, and syllabus-aligned practice for Singapore students.
These static practice materials are generated from the site's syllabus and paper-generation workflow, with source and model context shown so students and parents can evaluate the material before use.
Questions
Free quiz and exam paper access
Enter your details to view this paper
Your access is remembered on this device.
Answers
Secondary 1 Geography Quiz - Answer Key (Map Graph Data Skills)
Total Marks: 40
Topic: Map, Graph & Data Skills
Section A: Map Reading
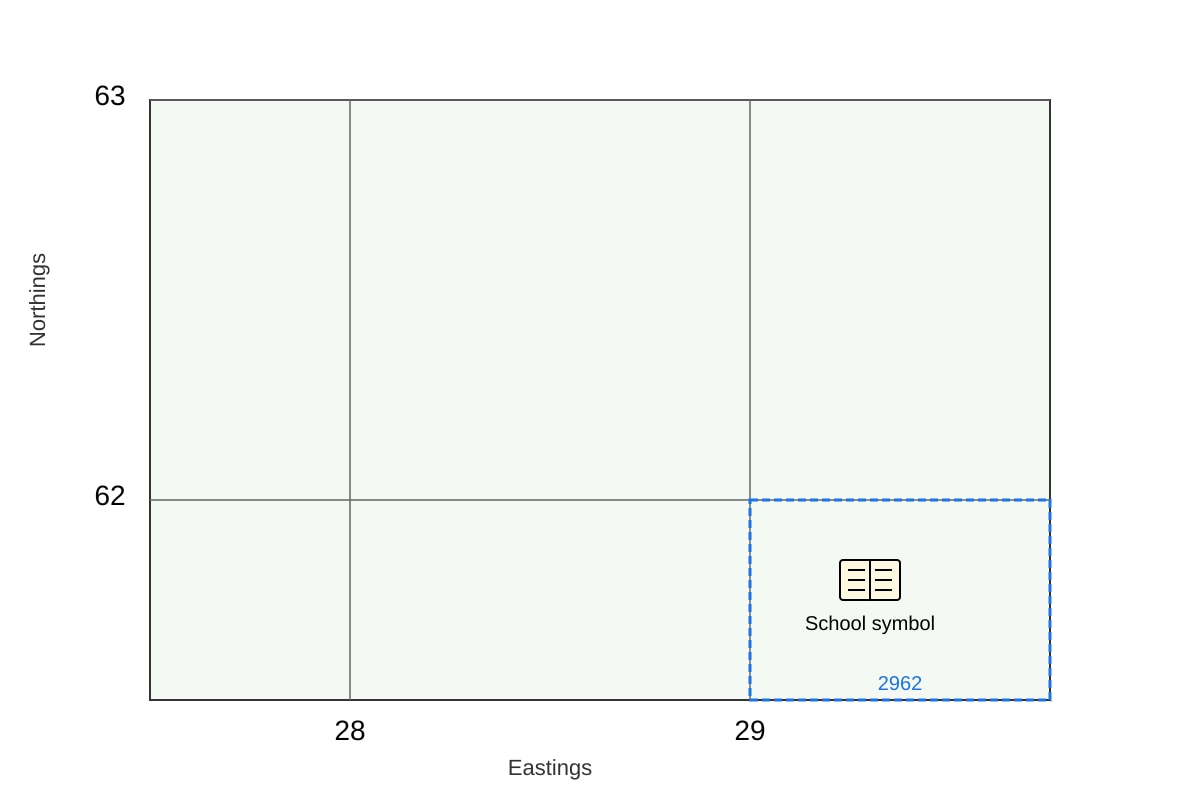
Q1. [1 mark]
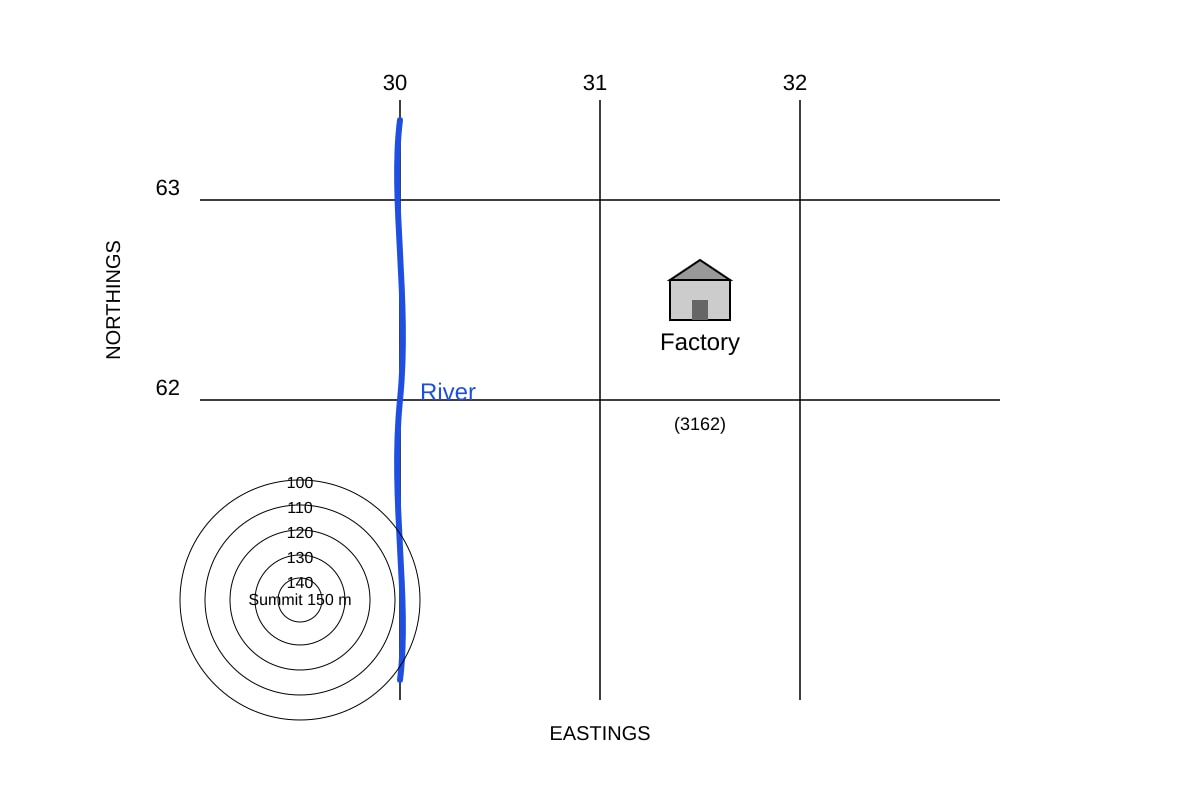
Answer: 2962
Teaching note: A 4-figure grid reference gives the square. Read easting (across, 29) first, then northing (up, 62). The school is inside the square with bottom-left corner at 29 east, 62 north.
Common mistake: Reversing to 6229.
Q2. [1 mark]
Answer: 2862 (assuming temple shown there on map extract)
Teaching note: From the map, the temple south of school is in square 2862 (easting 28, northing 62). Always read easting then northing.
Marking: 1 mark for correct 4-figure reference.
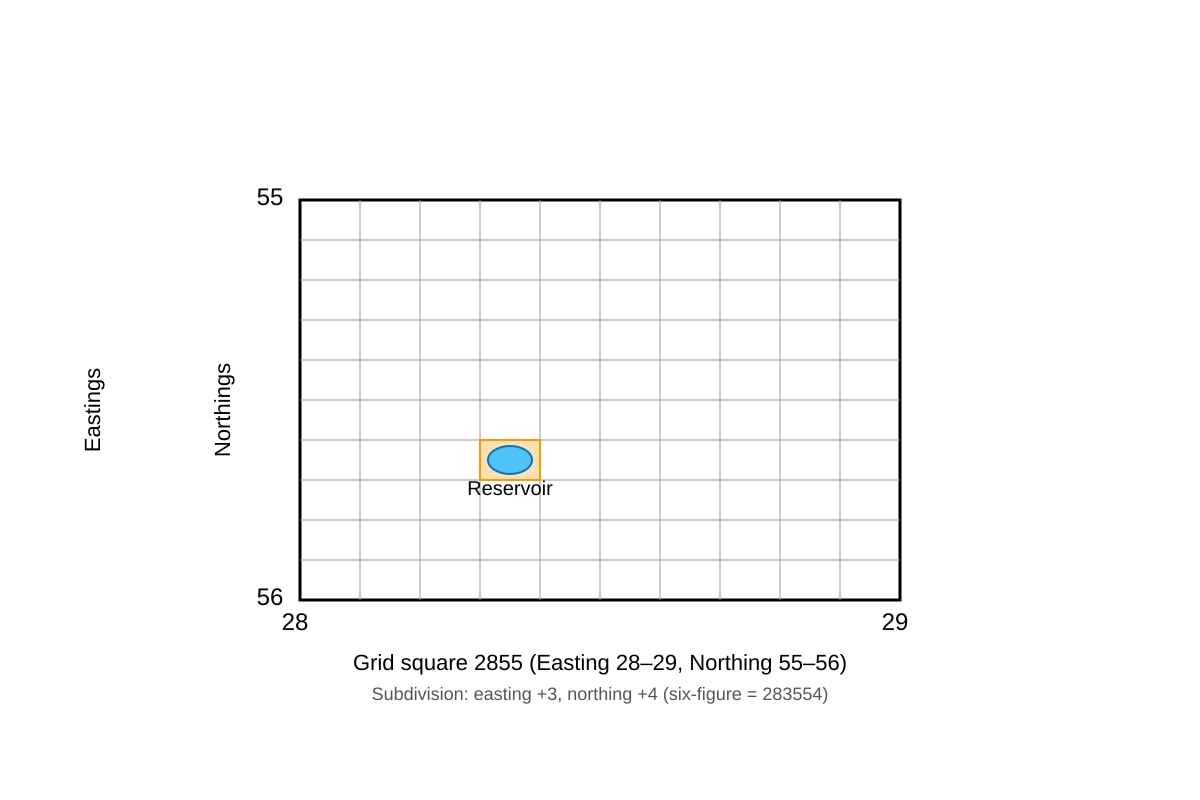
Q3. [1 mark]
Answer: 285534 (or 285533–285535 acceptable)
Teaching note: 4-figure base = 2855. Reservoir is 3/10 across (easting +3) and 4/10 up (northing +4) → 285534. Six-figure splits each square into 10.
Common mistake: Giving only 4 figures.
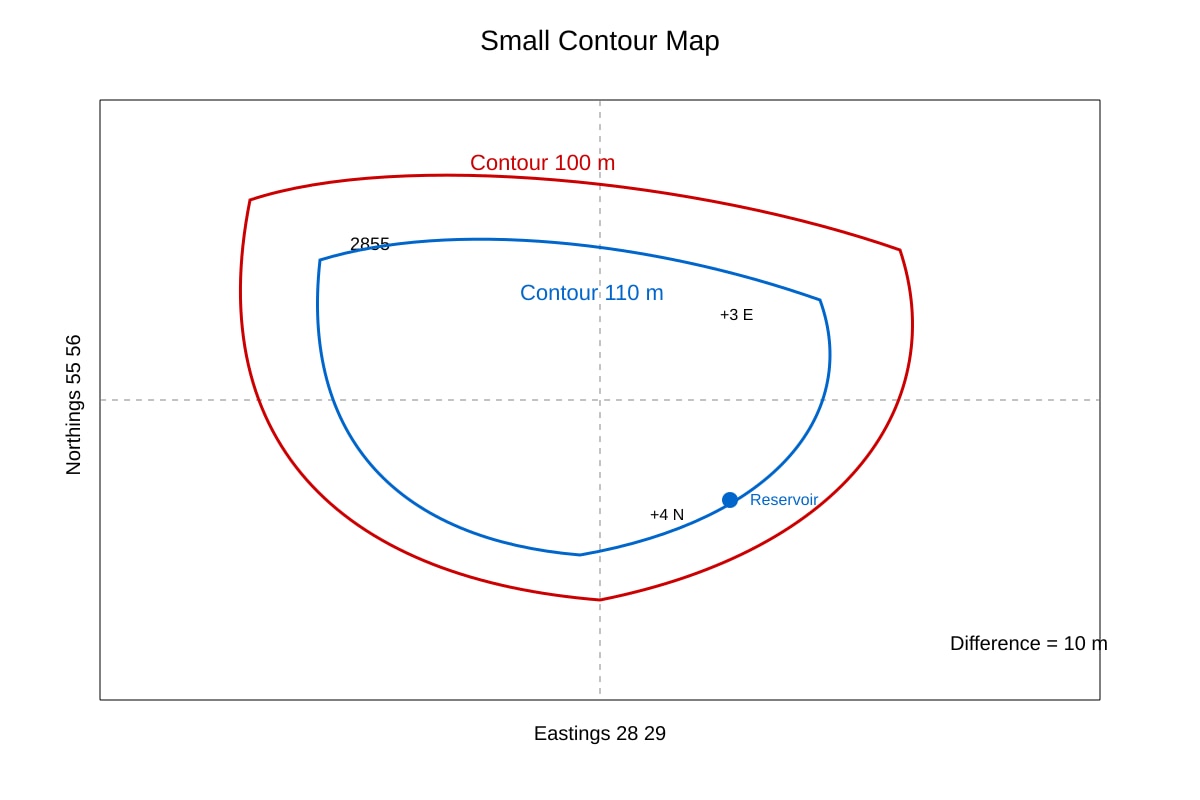
Q4. [1 mark]
Answer: 10 m
Teaching note: Contour interval = difference between adjacent contours = 110 − 100 = 10 m.
Marking: 1 mark for 10 m.
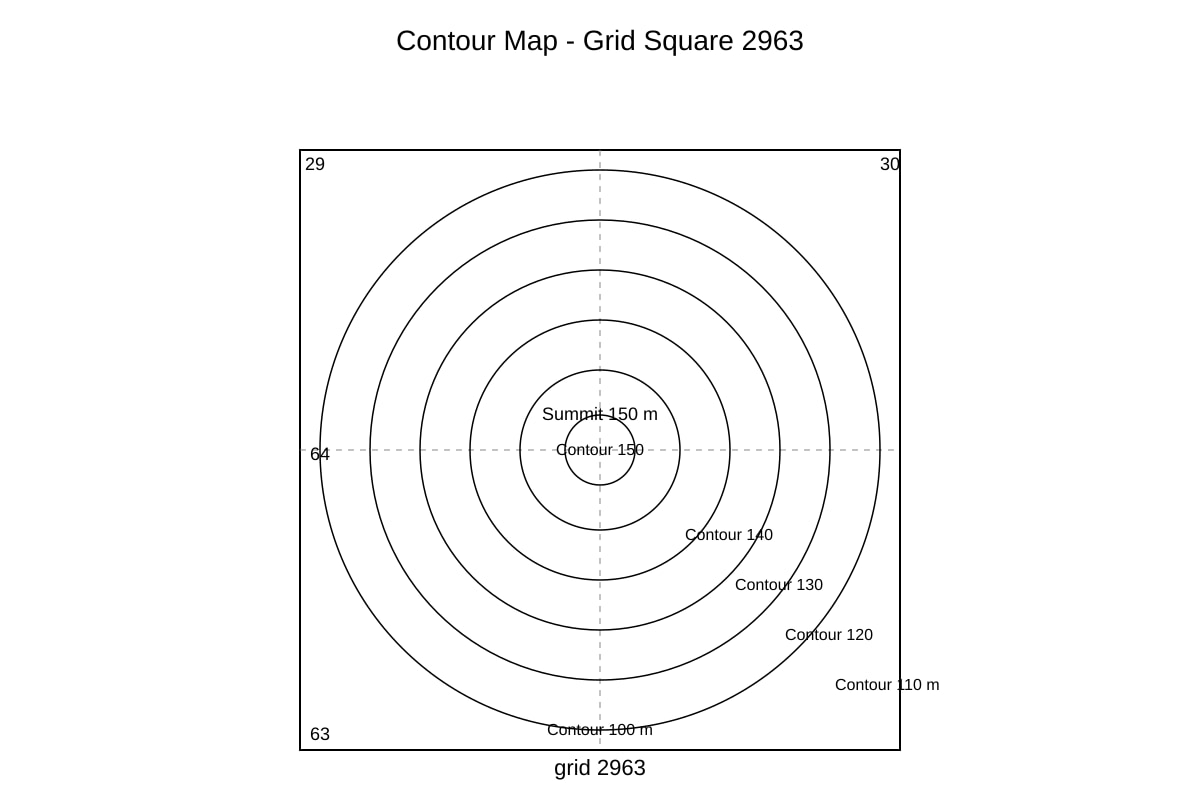
Q5. [2 marks]
Answer: A hill; concentric contours increasing inward to 150 m summit.
Marking: 1 mark for landform type (hill), 1 mark for description (concentric, increasing height).
Teaching note: Closed loops with higher values inside show a hill. Steepness judged by spacing.
Q6. [1 mark]
Answer: 3162
Teaching note: Factory east of river (easting 31, northing 62). Read easting then northing.
Q7. [2 marks]
Answer: 4 km
Working:
Map scale 1:50 000 → 1 cm = 50 000 cm = 0.5 km.
Distance = 8 cm × 0.5 km/cm = 4 km.
Marking: 1 mark for correct conversion (0.5 km/cm), 1 mark for final answer.
Teaching note: Scale shows map distance to ground distance.
Section B: Graph Skills
Q8. [1 mark]
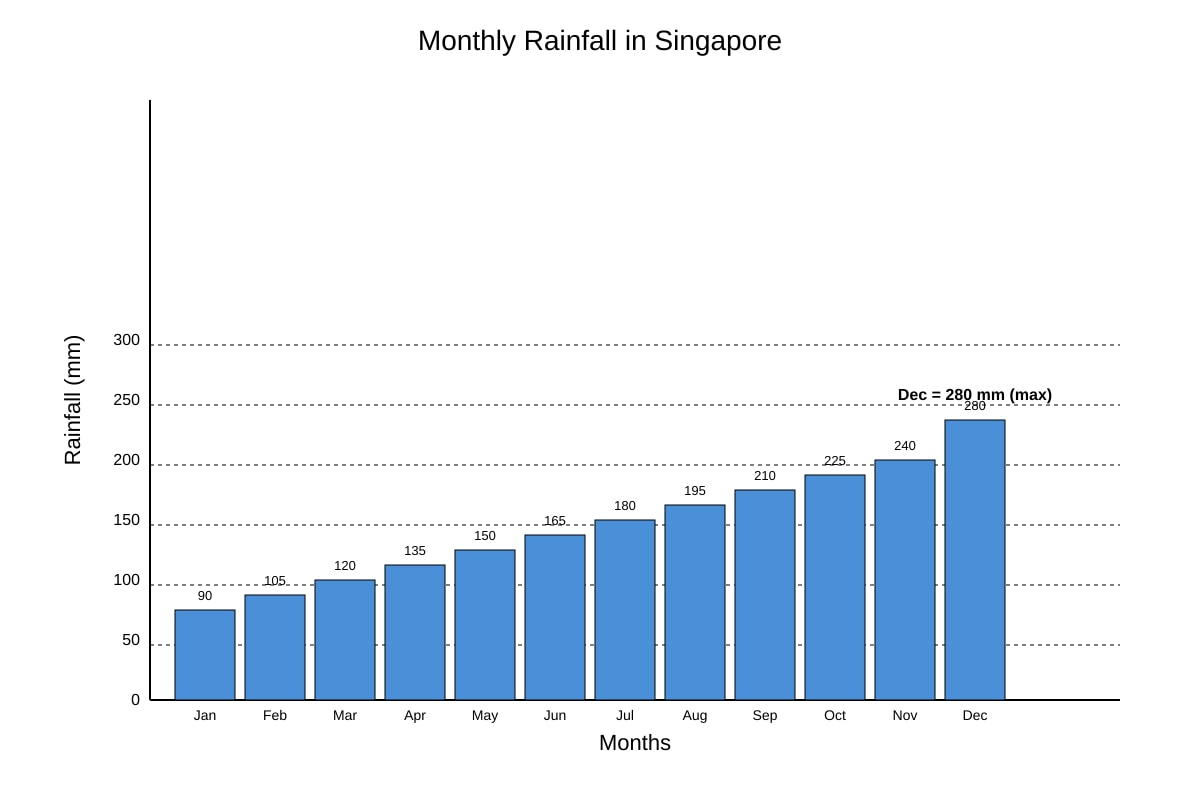
Answer: 280 mm
Teaching note: Read tallest bar = December 280 mm.
Q9. [2 marks]
Answer: Rainfall decreases from Jan to June (e.g., from about 240 mm to 120 mm).
Marking: 1 mark trend (decrease), 1 mark use of values.
Teaching note: Describe pattern with figures, not just “goes down”.
Q10. [1 mark]
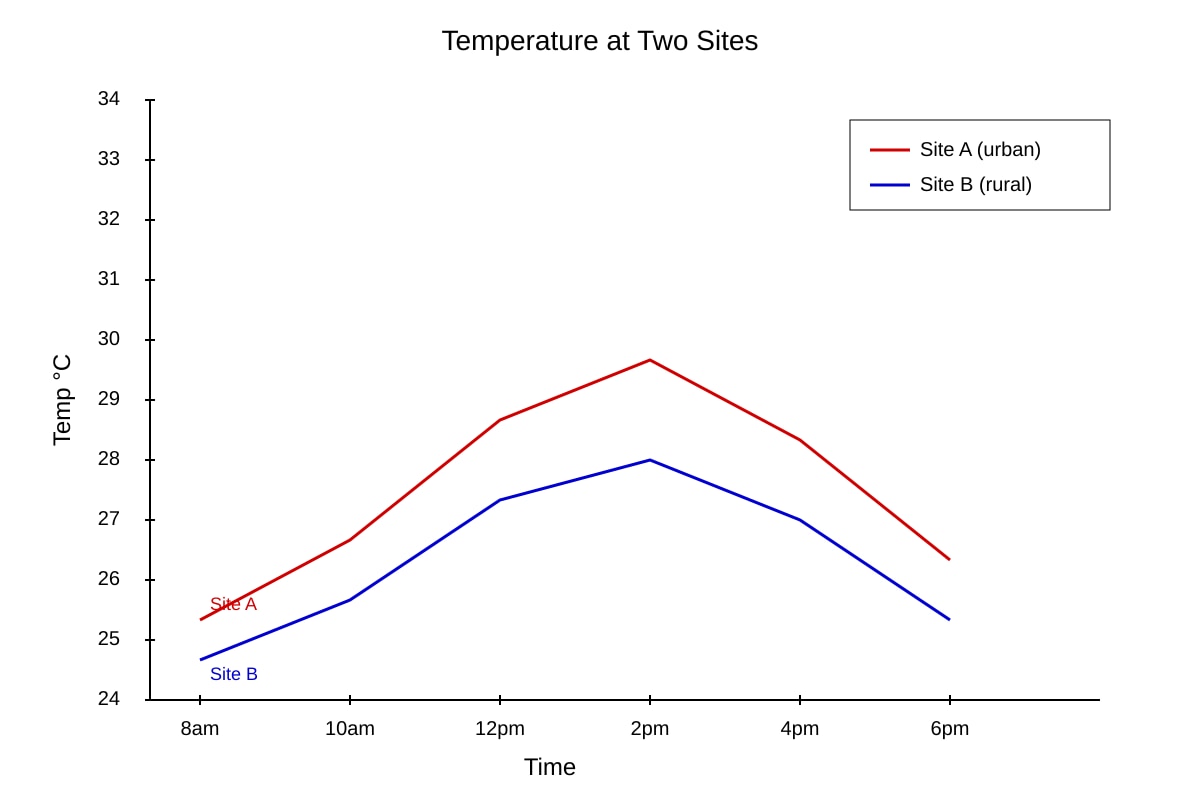
Answer: Site A
Teaching note: Line for Site A is above Site B at all times.
Q11. [2 marks]
Answer: 4 °C (example: Site A 32 °C, Site B 28 °C)
Working: Difference = 32 − 28 = 4 °C.
Marking: 1 mark reading values, 1 mark subtraction.
(Values from graph: accept based on plotted lines.)
Q12. [1 mark]
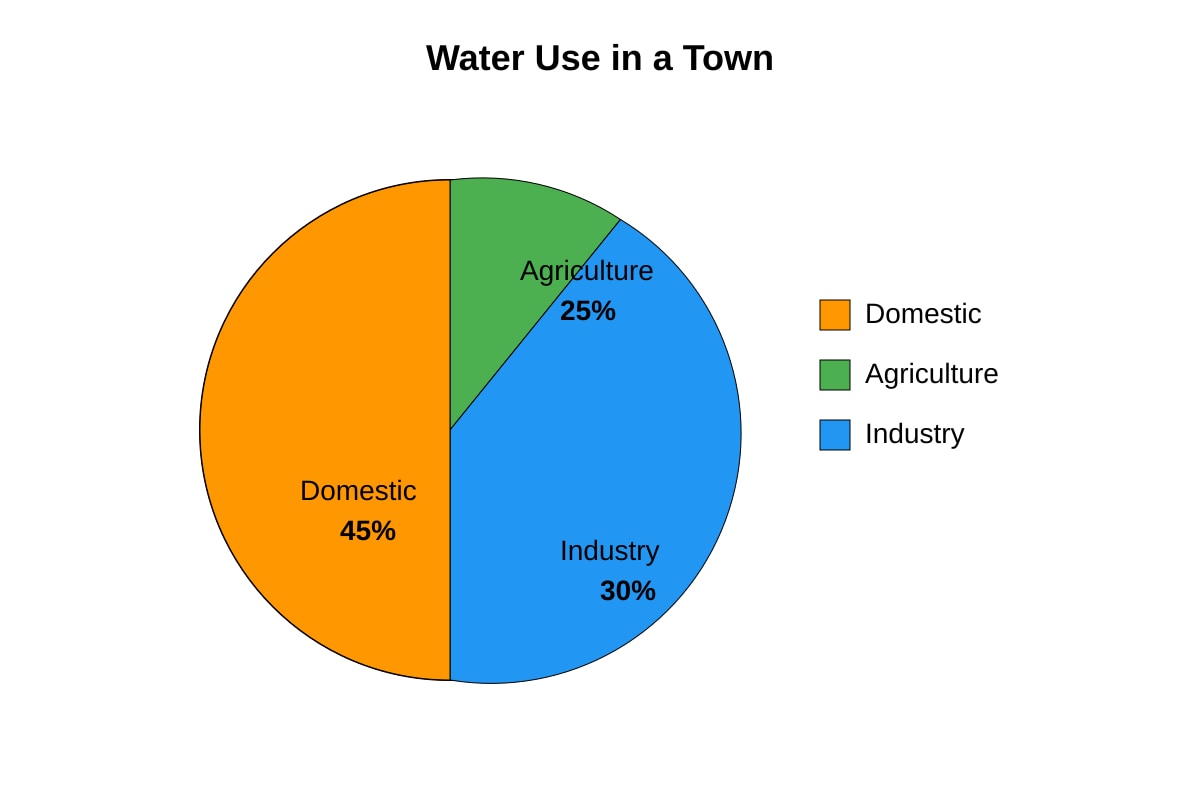
Answer: 30%
Teaching note: Read labelled slice for Industry.
Q13. [2 marks]
Answer: Domestic use is largest (45%) because households need water daily for drinking, bathing, cooking.
Marking: 1 mark link to percentage, 1 mark reason.
Teaching note: Explain using daily needs.
Section C: Data Tables
Q14. [1 mark]
Answer: Mars
Teaching note: Mars has 2 moons, more than others.
Q15. [2 marks]
Answer: No clear relationship; Mercury/Venus close have 0, Earth further has 1, Mars furthest has 2.
Marking: 1 mark observation, 1 mark use of data.
Teaching note: Describe pattern across given data only.
Q16. [1 mark]
Answer: Site X
Teaching note: Higher dissolved oxygen, lower turbidity = healthier.
Q17. [2 marks]
Answer: Site X has DO 7.2 > 4.1 and turbidity 3 < 12.
Marking: 1 mark per evidence point.
Teaching note: Use table values to support.
Q18. [2 marks]
Answer: Decreased from 165 to 143 L/person/day.
Marking: 1 mark decrease, 1 mark values.
Q19. [3 marks]
Answer: Population rose 4.0→5.7m (+1.7m) while water use fell 165→143 L. So total use rose but per-person fell.
Marking: 1 mark pop trend, 1 mark water trend, 1 mark comparison.
Teaching note: Use both columns.
Q20. [3 marks]
Answer: 8 mm
Working: Total = 10+0+5+15+10 = 40 mm. Mean = 40 ÷ 5 = 8 mm.
Marking: 1 mark sum, 1 mark divide, 1 mark answer.
Teaching note: Mean = sum ÷ count.