AI Generated Quiz
Secondary 1 Geography Map Graph Data Skills Quiz
Free Sec 1 Geography Map Graph Data Skills quiz, Claude AI version, with questions, answers, and syllabus-aligned practice for Singapore students.
These static practice materials are generated from the site's syllabus and paper-generation workflow, with source and model context shown so students and parents can evaluate the material before use.
Questions
Secondary 1 Geography Quiz - Map Graph Data Skills
Name: _________________ Class: _________________ Date: _________________
Score: _____ / 50 Duration: 45 minutes Total Marks: 50
Instructions
- Answer ALL questions in the spaces provided
- Use the figures and data provided to support your answers
- Show your working for calculation questions
- Write clearly and use geographical terminology where appropriate
Section A: Map Skills [12.5 marks]
Study Figure 1 (Topographic Map Extract) for Questions 1-5
- State the 4-figure grid reference of the temple shown on the map. [1 mark]
Answer: ________________
- What is the contour interval shown on this map? [1 mark]
Answer: ________________
- Give the 6-figure grid reference of the school that is located east of the main road. [2 marks]
Answer: ________________
- Describe the relief features shown in grid square 2863. [3 marks]
- A geography class wants to conduct fieldwork comparing two sites on this map - Site A (grid reference 2762) and Site B (grid reference 2965). Suggest TWO geographical factors that make these sites suitable for comparison and explain why it is important to collect data at multiple sites rather than just one location. [5.5 marks]
Factor 1: _________________________________________________
Factor 2: _________________________________________________
Importance of multiple sites: ________________________________
Section B: Data Interpretation [12.5 marks]
Study Figure 2 (Water Quality Data Table) for Questions 6-10
| Site | Location | pH | Dissolved Oxygen (mg/L) | Temperature (°C) | Turbidity (NTU) |
|---|---|---|---|---|---|
| A | Forest stream | 7.2 | 8.5 | 24 | 2 |
| B | Urban stream | 6.8 | 5.2 | 28 | 15 |
| C | Industrial area | 6.1 | 3.8 | 31 | 25 |
| D | Residential area | 7.0 | 6.1 | 26 | 8 |
- Which site has the best water quality? Use evidence from the table to support your answer. [2 marks]
Site: _______
Evidence: ___________________________________________________
- Describe the pattern of water temperature across the four sites. [2.5 marks]
- Explain why Site C has the poorest water quality compared to the other sites. [3 marks]
- Suggest THREE factors that could explain why Site A has higher dissolved oxygen levels than the other sites. [3 marks]
Factor 1: ___________________________________________________
Factor 2: ___________________________________________________
Factor 3: ___________________________________________________
- State a hypothesis students could test about the relationship between human activities and water quality using this data. [2 marks]
Section C: Graph Analysis [12.5 marks]
Study Figure 3 (Singapore's Daily Water Consumption Graph) for Questions 11-15
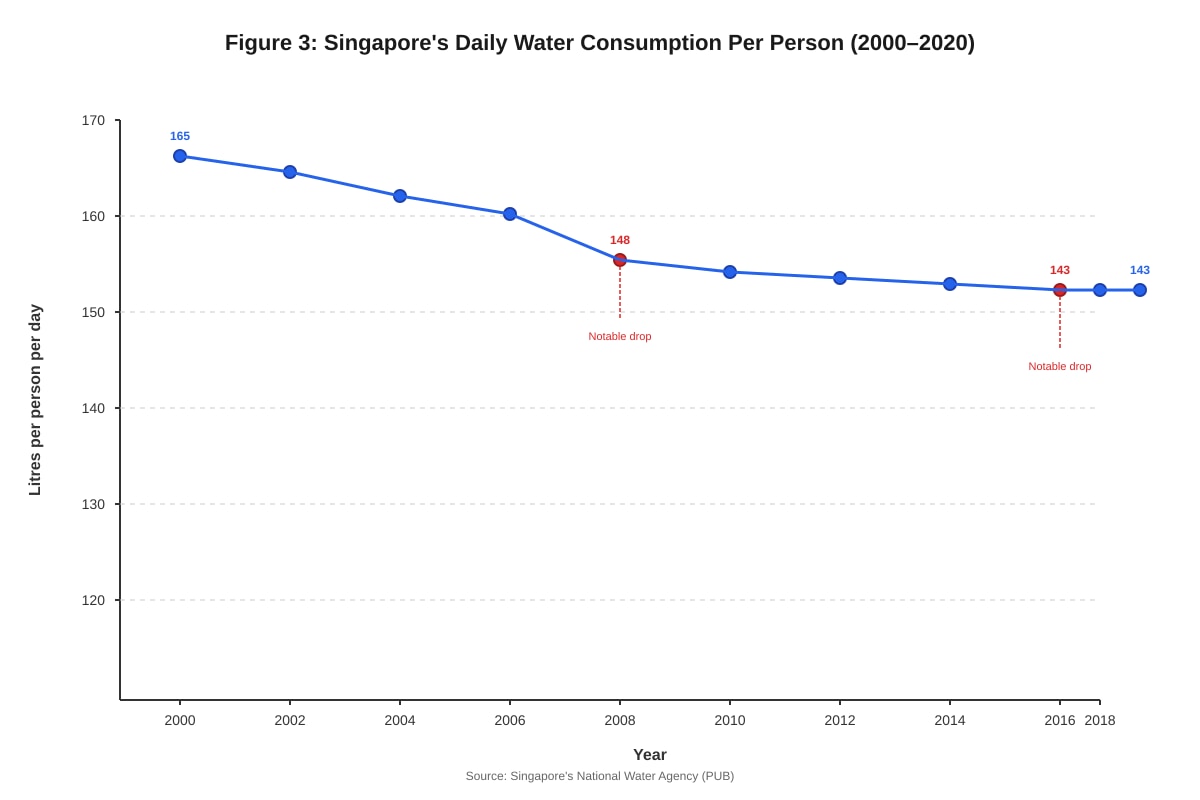
Generated graph for this question.
- Calculate the total decrease in daily water consumption per person from 2000 to 2020. [2 marks]
Working: ___________________________________________________
Answer: ________________ litres per person per day
- Describe the trend in Singapore's daily water consumption per person from 2000 to 2020. [2.5 marks]
- The graph shows sharp decreases in water consumption in 2008 and 2016. Suggest TWO possible reasons for these decreases. [3 marks]
Reason 1 (2008): ____________________________________________
Reason 2 (2016): ____________________________________________
- Explain why reducing water consumption per person is important for Singapore's water security. [2.5 marks]
- Suggest TWO strategies that could help Singapore further reduce daily water consumption per person. [2.5 marks]
Strategy 1: _________________________________________________
Strategy 2: _________________________________________________
Section D: Integrated Skills [12.5 marks]
Questions 16-20 use multiple data sources
- Define the term "primary data" and give ONE example of primary data that geography students might collect during fieldwork. [2.5 marks]
Definition: _________________________________________________
Example: __________________________________________________
- Explain the difference between qualitative and quantitative data in geographical investigations. [2.5 marks]
- State TWO advantages of using graphs to present geographical data rather than tables. [2.5 marks]
Advantage 1: _______________________________________________
Advantage 2: _______________________________________________
- Explain why geographers often collect data at regular intervals (e.g., every 50 metres along a transect) rather than at random locations. [2.5 marks]
- Suggest TWO ways that technology could help geography students collect more accurate data during fieldwork. [2.5 marks]
Way 1: ____________________________________________________
Way 2: ____________________________________________________
END OF QUIZ
Answers
Secondary 1 Geography Quiz - Map Graph Data Skills (Answer Key)
Total Marks: 50
Section A: Map Skills [12.5 marks]
1. State the 4-figure grid reference of the temple shown on the map. [1 mark]
Answer: 2863 Marking: 1 mark for correct 4-figure grid reference
2. What is the contour interval shown on this map? [1 mark]
Answer: 10 metres / 10m Marking: 1 mark for correct interval with or without units
3. Give the 6-figure grid reference of the school that is located east of the main road. [2 marks]
Answer: 295635 (accept 294634 or 296636 depending on exact position) Marking: 2 marks for correct 6-figure reference, 1 mark if only 4 figures given
4. Describe the relief features shown in grid square 2863. [3 marks]
Sample Answer: The area shows a hill with contour lines forming concentric circles. The highest point is approximately 120m above sea level. The slopes are steeper on the northern side where contour lines are closer together, and gentler on the southern side where lines are more widely spaced.
Marking Scheme:
- 1 mark: Identifies hill/elevated area
- 1 mark: References contour pattern (concentric circles/closed loops)
- 1 mark: Describes slope variation or height information
5. A geography class wants to conduct fieldwork comparing two sites on this map. Suggest TWO geographical factors that make these sites suitable for comparison and explain why it is important to collect data at multiple sites rather than just one location. [5.5 marks]
Sample Answers: Factors: Different land uses (rural vs urban), Different elevations/relief, Different distances from water bodies, Different accessibility levels, Different vegetation cover
Importance: Collecting data at multiple sites allows for comparison and helps identify patterns or differences between locations. It also increases the reliability of results by providing more evidence and reduces the risk of anomalous data from a single site affecting conclusions.
Marking: 1.5 marks per valid geographical factor (3 marks total), 2.5 marks for explanation of importance
Section B: Data Interpretation [12.5 marks]
6. Which site has the best water quality? Use evidence from the table to support your answer. [2 marks]
Answer: Site A Evidence: Site A has the highest pH (7.2), highest dissolved oxygen (8.5 mg/L), lowest temperature (24°C), and lowest turbidity (2 NTU), all indicating good water quality.
Marking: 1 mark for correct site, 1 mark for appropriate evidence
7. Describe the pattern of water temperature across the four sites. [2.5 marks]
Sample Answer: Water temperature is lowest at Site A (24°C) and increases towards more developed areas, reaching the highest temperature at Site C (31°C) in the industrial area. Site D (residential) has moderate temperature (26°C), while Site B (urban) shows elevated temperature (28°C).
Marking: 0.5 mark for identifying lowest value, 0.5 mark for highest value, 1 mark for pattern direction, 0.5 mark for use of specific data
8. Explain why Site C has the poorest water quality compared to the other sites. [3 marks]
Sample Answer: Site C is located in an industrial area where factories discharge heated water and chemical pollutants into the stream. This causes high temperature (31°C) and low dissolved oxygen (3.8 mg/L) as warm water holds less oxygen. Industrial waste increases turbidity (25 NTU) and lowers pH (6.1), creating acidic conditions harmful to aquatic life.
Marking: 1 mark for industrial pollution source, 1 mark for temperature/oxygen relationship, 1 mark for pH/turbidity impact
9. Suggest THREE factors that could explain why Site A has higher dissolved oxygen levels than the other sites. [3 marks]
Sample Answers:
- Lower temperature allows water to hold more dissolved oxygen
- Forest vegetation produces oxygen through photosynthesis
- Less pollution from human activities
- Faster flowing water increases oxygen mixing
- Shade from trees keeps water cool
Marking: 1 mark per valid factor (maximum 3)
10. State a hypothesis students could test about the relationship between human activities and water quality using this data. [2 marks]
Sample Answer: "Water quality decreases as the level of human development/activity increases" or "Areas with more human activities will have poorer water quality indicators."
Marking: 2 marks for testable hypothesis linking human activity to water quality
Section C: Graph Analysis [12.5 marks]
11. Calculate the total decrease in daily water consumption per person from 2000 to 2020. [2 marks]
Working: 165L - 143L = 22L Answer: 22 litres per person per day
Marking: 1 mark for correct working, 1 mark for correct answer with units
12. Describe the trend in Singapore's daily water consumption per person from 2000 to 2020. [2.5 marks]
Sample Answer: Singapore's daily water consumption per person shows an overall decreasing trend from 165L in 2000 to 143L in 2020. The decline was not steady, with notable sharp decreases in 2008 and 2016, followed by periods of more gradual reduction.
Marking: 1 mark for overall trend, 0.5 mark for specific values, 1 mark for pattern details
13. The graph shows sharp decreases in water consumption in 2008 and 2016. Suggest TWO possible reasons for these decreases. [3 marks]
Sample Answers:
- Reason 1 (2008): Global financial crisis led to reduced industrial activity and economic conservation measures
- Reason 2 (2016): Introduction of new water conservation policies or pricing structures / Launch of major water-saving campaigns
Marking: 1.5 marks per reason (0.5 for identifying plausible cause, 1 for linking to the specific year/context)
14. Explain why reducing water consumption per person is important for Singapore's water security. [2.5 marks]
Sample Answer: Singapore has limited natural water resources and relies heavily on imported water from Malaysia. Reducing consumption per person helps ensure adequate supply for a growing population, reduces dependency on external sources, and helps maintain water sustainability for future generations.
Marking: 1 mark for limited resources, 1 mark for population/supply relationship, 0.5 mark for sustainability aspect
15. Suggest TWO strategies that could help Singapore further reduce daily water consumption per person. [2.5 marks]
Sample Answers:
- Water-efficient appliances and fixtures in homes and buildings
- Public education campaigns about water conservation
- Water recycling and rainwater harvesting systems
- Smart water meters to monitor usage
- Pricing policies that encourage conservation
Marking: 1.25 marks per valid strategy
Section D: Integrated Skills [12.5 marks]
16. Define the term "primary data" and give ONE example of primary data that geography students might collect during fieldwork. [2.5 marks]
Definition: Primary data is information collected directly by the researcher through their own observations, measurements, or surveys. Example: Water temperature measurements, traffic counts, questionnaire responses, photographs taken during fieldwork
Marking: 1.5 marks for definition, 1 mark for appropriate example
17. Explain the difference between qualitative and quantitative data in geographical investigations. [2.5 marks]
Sample Answer: Quantitative data consists of numerical measurements that can be counted or measured (e.g., temperature, population numbers). Qualitative data describes characteristics or qualities that cannot be easily measured numerically (e.g., land use types, descriptions of landscape features).
Marking: 1.25 marks for quantitative explanation with example, 1.25 marks for qualitative explanation with example
18. State TWO advantages of using graphs to present geographical data rather than tables. [2.5 marks]
Sample Answers:
- Graphs make patterns and trends easier to identify visually
- Graphs allow for quick comparison between different data sets
- Graphs are more engaging and easier to understand for audiences
- Graphs can show relationships between variables more clearly
Marking: 1.25 marks per valid advantage
19. Explain why geographers often collect data at regular intervals (e.g., every 50 metres along a transect) rather than at random locations. [2.5 marks]
Sample Answer: Regular intervals ensure systematic sampling that provides representative data across the study area. This method reduces bias in data collection and allows for clear analysis of spatial patterns and changes. It also makes the study replicable and ensures adequate coverage of the area being investigated.
Marking: 1 mark for systematic/representative sampling, 1 mark for reducing bias, 0.5 mark for replicability/coverage
20. Suggest TWO ways that technology could help geography students collect more accurate data during fieldwork. [2.5 marks]
Sample Answers:
- GPS devices for precise location recording and mapping
- Digital sensors for accurate environmental measurements (temperature, pH, noise levels)
- Smartphone apps for data recording and instant calculations
- Digital cameras for systematic photographic evidence
- Online mapping tools for real-time data plotting
Marking: 1.25 marks per valid technology application with explanation
Free quiz and exam paper access
Enter your details to view this paper
Your access is remembered on this device.