AI Generated Quiz
Secondary 1 Geography Human Geography Quiz
Free Sec 1 Geography Human Geography quiz, Qwen3.7 AI version, with questions, answers, and syllabus-aligned practice for Singapore students.
These static practice materials are generated from the site's syllabus and paper-generation workflow, with source and model context shown so students and parents can evaluate the material before use.
Questions
Secondary 1 Geography Quiz - Human Geography
Name: __________________________
Class: __________________________
Date: __________________________
Score: _______ / 40
Duration: 45 minutes
Total Marks: 40
Instructions:
- Answer all questions.
- Write your answers in the spaces provided.
- The number of marks for each question or part is given in brackets [ ].
- This quiz focuses on Human Geography, specifically population distribution, migration, and urbanisation.
Section A: Population Concepts and Distribution (Questions 1-5)
1. Which of the following best defines "population density"? A. The total number of people living in a country. B. The number of people living per unit area of land (e.g., per km²). C. The rate at which the population is increasing each year. D. The number of births minus the number of deaths.
Answer: [ ] [1]
2. Which region typically has a sparse (low) population density? A. The Nile Delta in Egypt. B. The Amazon Rainforest in Brazil. C. The North European Plain. D. The island of Java, Indonesia.
Answer: [ ] [1]
3. Why are river valleys often densely populated? A. They are prone to frequent flooding. B. They have flat land suitable for farming and transport. C. They are usually located in cold polar regions. D. They have poor soil quality for agriculture.
Answer: [ ] [1]
4. Which of the following is a physical factor affecting population distribution? A. Availability of jobs. B. Quality of schools. C. Climate and temperature. D. Political stability.
Answer: [ ] [1]
5. "Brain Drain" refers to: A. The movement of unskilled workers to cities. B. The emigration of highly trained or intelligent people from a particular country. C. The increase in birth rates in developing countries. D. The government policy to limit population growth.
Answer: [ ] [1]
Section B: Migration and Population Change (Questions 6-10)
6. Which factor is considered a "pull factor" for migration? A. High crime rates in the home country. B. Lack of job opportunities in the rural area. C. Better healthcare and education facilities in the city. D. Political instability and war.
Answer: [ ] [1]
7. What is the main reason for the growth of megacities in Less Economically Developed Countries (LEDCs)? A. Natural increase and rural-to-urban migration. B. Government policies forcing people to move. C. High levels of international immigration. D. Expansion of agricultural land into cities.
Answer: [ ] [1]
8. Which statement best describes an "aging population"? A. A population where the majority are under 15 years old. B. A population where the proportion of elderly people (65+) is increasing. C. A population that is shrinking due to war. D. A population with a very high birth rate.
Answer: [ ] [1]
9. Why might a government introduce pro-natalist policies (encouraging births)? A. To reduce overcrowding in cities. B. To address a shrinking workforce and support the elderly. C. To decrease the demand for housing. D. To lower the cost of education.
Answer: [ ] [1]
10. Define "migration".
_________________________________________________________________________ [1]
Section C: Data Analysis and Structured Questions (Questions 11-15)
11. Study the table below showing population data for Country A and Country B.
| Indicator | Country A | Country B |
|---|---|---|
| Birth Rate (per 1000) | 35 | 8 |
| Death Rate (per 1000) | 10 | 9 |
| Natural Increase Rate | High | Low |
| Life Expectancy | 65 years | 82 years |
(a) Calculate the Natural Increase Rate (per 1000) for Country A. [1]
(b) Based on the data, suggest one reason why Country B has a higher life expectancy than Country A. [2]
(c) Country A is likely to have a "young population." State one challenge this creates for the government. [2]
12. Study the diagram below representing the Push-Pull Model of migration.
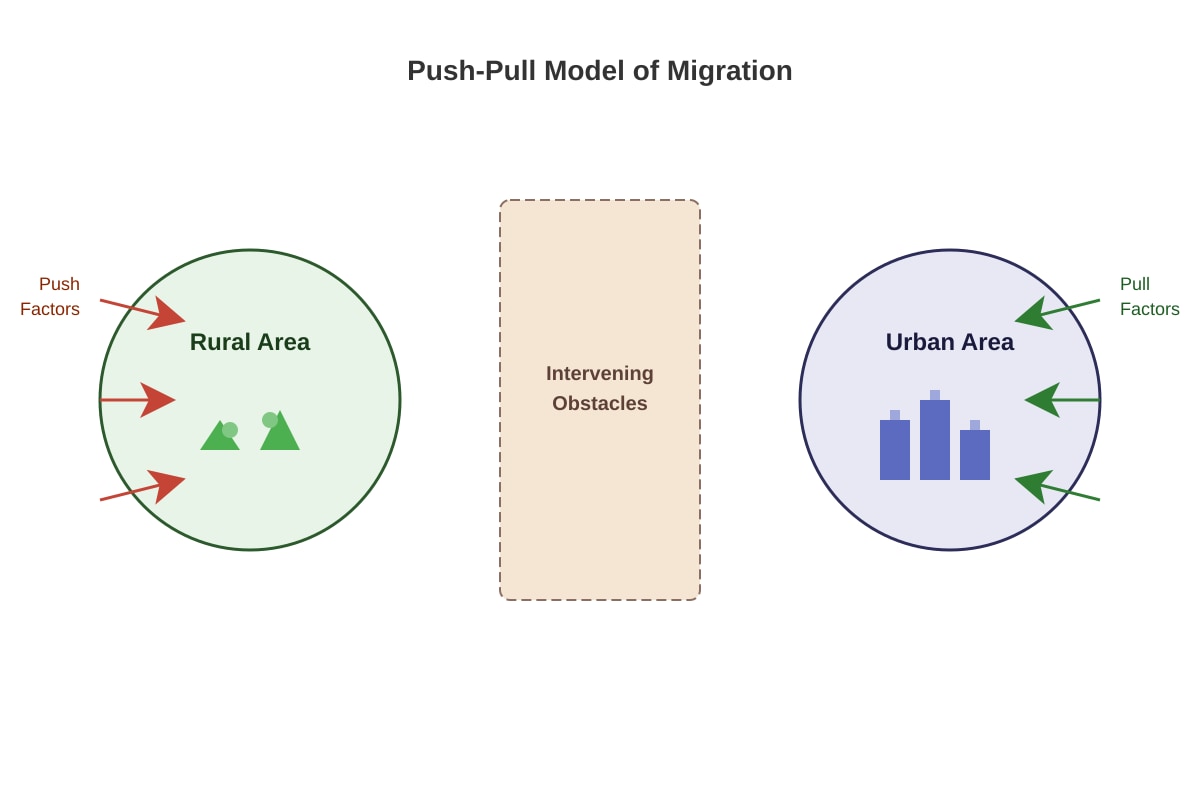
Generated diagram for Q12.
(a) Identify two push factors that might cause people to leave a rural area. [2]
(b) Explain how "intervening obstacles" can affect migration. [2]
13. Read the case study excerpt below about Singapore.
"Singapore is a small island nation with limited land area. To accommodate its growing population and economic needs, the government has focused on vertical urbanisation. This includes building high-rise public housing (HDB flats) and reclaiming land from the sea. However, this rapid development has led to concerns about the loss of green spaces and increased traffic congestion."
(a) What is "urbanisation"? [1]
(b) Based on the excerpt, state two strategies Singapore uses to manage its limited land space. [2]
(c) Explain one negative impact of rapid urbanisation mentioned in the text. [2]
(d) Suggest one way the government can balance urban development with environmental concerns. [2]
14. Look at the map extract description below.
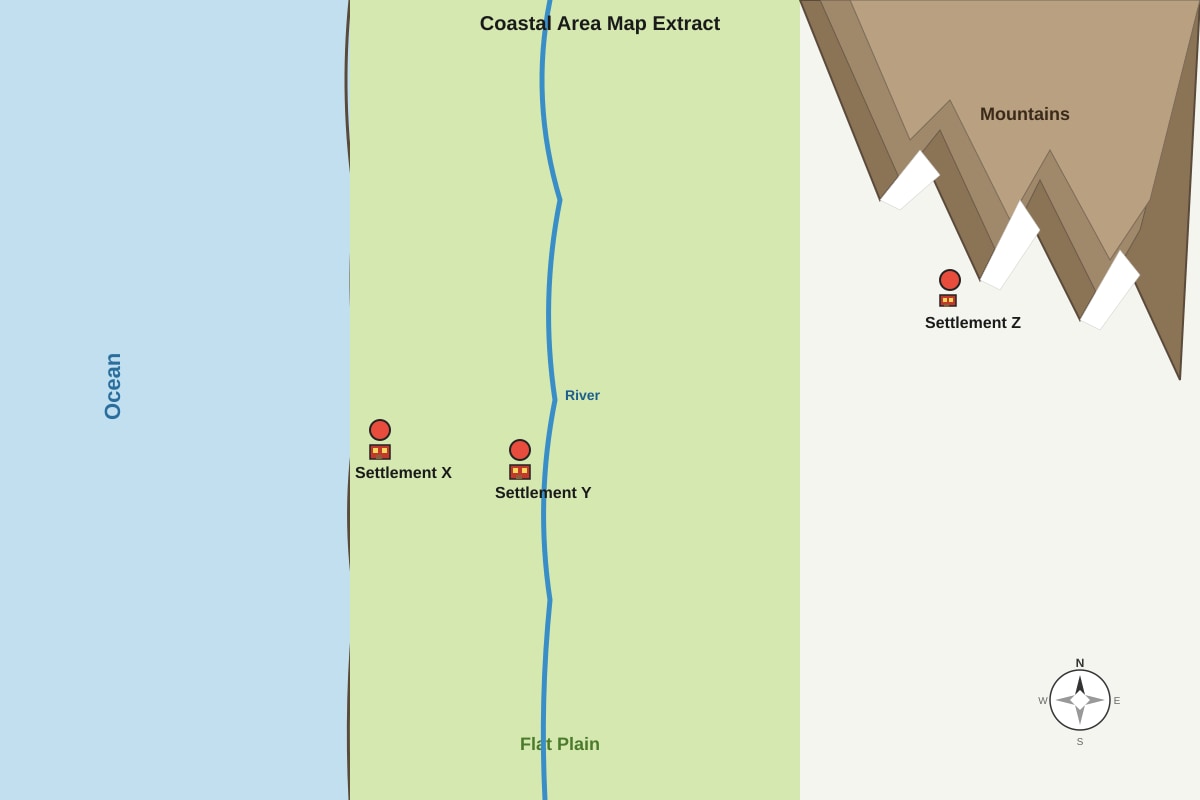
Generated map for Q14.
(a) Which settlement (X, Y, or Z) is most likely to have the highest population density? Give a reason for your answer. [2]
Settlement: _________ Reason: __________________________________________________________________
(b) Why is Settlement Z likely to have a sparse population? [2]
15. "Overpopulation is the biggest threat to sustainable development."
Do you agree with this statement? Explain your answer with reference to:
- The strain on resources (water, food, energy).
- The impact on the environment (pollution, habitat loss).
- Possible solutions (technology, family planning, sustainable practices).
[10]
Section D: Application and Critical Thinking (Questions 16-20)
16. Which of the following is a direct consequence of a high dependency ratio in an aging population? A. Increased demand for primary schools. B. Higher tax burden on the working-age population. C. Surplus of available housing. D. Decreased demand for healthcare services.
Answer: [ ] [1]
17. What is the primary difference between "internal migration" and "international migration"? A. Internal migration is permanent, while international migration is temporary. B. Internal migration occurs within the same country, while international migration crosses national borders. C. Internal migration is always rural-to-urban, while international migration is urban-to-rural. D. There is no significant difference; both involve moving for better jobs.
Answer: [ ] [1]
18. Which of the following best describes "sustainable urban planning"? A. Building as many high-rise buildings as possible to maximize profit. B. Expanding city boundaries into protected forest reserves. C. Designing cities to meet current needs without compromising future generations' ability to meet theirs. D. Prioritizing private car ownership over public transport systems.
Answer: [ ] [1]
19. Study the following scenario: Country X has a birth rate of 10 per 1000 and a death rate of 12 per 1000.
What is the likely trend for Country X's total population size, assuming no migration? A. Rapid growth. B. Slow growth. C. Stable (no change). D. Decline.
Answer: [ ] [1]
20. Explain why "carrying capacity" is an important concept when discussing population distribution.
_________________________________________________________________________ [2]
[End of Quiz]
Answers
Secondary 1 Geography Quiz - Human Geography (Answer Key)
Section A: Population Concepts and Distribution (Questions 1-5)
1. B [1]
- Explanation: Population density is calculated as Total Population ÷ Total Land Area. It measures how crowded a place is.
- Common Mistake: Confusing density with total population size (A).
2. B [1]
- Explanation: The Amazon Rainforest has a hot, wet climate, dense vegetation, and poor soil, making it difficult for large-scale human settlement.
- Common Mistake: Choosing A, C, or D, which are all examples of densely populated areas due to fertile soil or economic opportunities.
3. B [1]
- Explanation: River valleys provide flat land for building and farming, water for irrigation/drinking, and transport routes.
- Common Mistake: Thinking flooding (A) is a benefit; it is actually a hazard, though people accept the risk for the fertile soil.
4. C [1]
- Explanation: Climate is a physical (natural) factor. Jobs, schools, and politics are human (social/economic) factors.
5. B [1]
- Explanation: Brain Drain is the loss of skilled professionals (doctors, engineers, etc.) to other countries, often harming the home country's development.
Section B: Migration and Population Change (Questions 6-10)
6. C [1]
- Explanation: Pull factors are positive attributes of the destination that attract migrants. Better healthcare and education are classic pull factors.
- Common Mistake: Choosing A, B, or D, which are push factors (negative reasons to leave).
7. A [1]
- Explanation: In LEDCs, urban growth is driven mainly by people moving from rural areas to cities (rural-urban migration) and high natural increase rates.
8. B [1]
- Explanation: An aging population means the median age is rising, and the percentage of people over 65 is growing relative to the working-age population.
9. B [1]
- Explanation: Pro-natalist policies (e.g., baby bonuses) are used when the workforce is shrinking and there are too few young people to support the elderly (high dependency ratio).
10. The movement of people from one place to another with the intention of settling, permanently or temporarily, in a new location. [1]
- Note: Key concepts are "movement" and "change of residence/settlement".
Section C: Data Analysis and Structured Questions (Questions 11-15)
11. (a) 25 per 1000 [1]
- Working: Birth Rate (35) - Death Rate (10) = 25.
- Note: Units (per 1000) are good practice but the number is the key mark.
11. (b) Any one valid reason: [2]
- Better healthcare system / access to doctors and hospitals.
- Better sanitation and clean water supply.
- Higher standard of living / better nutrition.
- Advanced medical technology.
- Marking: 1 mark for the factor, 1 mark for brief elaboration or context.
11. (c) Any one valid challenge: [2]
- High demand for schools and education facilities.
- Need for more paediatric healthcare services.
- Future pressure on the job market when they enter the workforce.
- Marking: 1 mark for identifying the challenge, 1 mark for explanation.
12. (a) Any two push factors: [2]
- Lack of jobs / unemployment.
- Poor healthcare or education.
- Natural disasters (droughts, floods).
- War or political instability.
- Marking: 1 mark for each correct factor.
12. (b) Intervening obstacles are barriers that make migration difficult. [1] They can reduce the number of migrants or change the destination. Examples include distance, cost of travel, immigration laws, or language barriers. [1]
13. (a) The increase in the proportion of people living in urban areas (cities/towns). [1]
13. (b) Any two strategies from the text: [2]
- Building high-rise public housing (vertical urbanisation).
- Land reclamation from the sea.
13. (c) Any one negative impact from the text: [2]
- Loss of green spaces / natural habitats.
- Increased traffic congestion.
- Marking: 1 mark for identification, 1 mark for brief explanation of why it is negative (e.g., loss of biodiversity, longer commute times).
13. (d) Any one valid suggestion: [2]
- Create more parks and vertical gardens (green roofs) to replace lost greenery.
- Invest in efficient public transport to reduce traffic congestion.
- Implement strict environmental regulations for new buildings.
- Marking: 1 mark for the suggestion, 1 mark for how it helps.
14. (a) Settlement X [1].
- Reason: It is located on the coast with a deep-water harbour, facilitating trade and jobs. Coastal plains are also usually flat and easy to build on. [1]
14. (b) Any two reasons: [2]
- Steep relief/mountains make construction difficult and expensive.
- Poor accessibility / transport links.
- Harsher climate at high altitudes.
- Lack of flat land for agriculture.
15. Marking Rubric:
- Level 3 (7-10 marks): Clear stance (agree/disagree/partially agree). Detailed explanation of strain on resources AND environmental impact. Discusses solutions. Uses specific examples (e.g., water scarcity in Singapore, deforestation in Amazon). Logical structure.
- Level 2 (4-6 marks): Addresses the prompt but may lack depth. Mentions resource strain or environmental impact but not both in detail. Solutions are generic. Limited examples.
- Level 1 (1-3 marks): Simple statements. Lists points without explanation. No clear argument.
Suggested Answer Points:
- Agreement (Strain on Resources): Overpopulation leads to high demand for fresh water, food, and energy. In many LEDCs, infrastructure cannot keep up, leading to shortages. Example: Water rationing in Cape Town or Chennai.
- Agreement (Environmental Impact): More people mean more waste, pollution, and need for housing, leading to deforestation and loss of biodiversity. Example: Air pollution in Delhi or Beijing.
- Disagreement/Nuance (Consumption vs. Numbers): It is not just the number of people, but how they consume. A smaller population with high consumption (MEDCs) can have a larger footprint than a larger population with low consumption.
- Solutions: Technology (desalination, vertical farming), Family Planning (education for women, access to contraception), Sustainable Urban Planning (green buildings, public transport).
Conclusion: A balanced view is often best. Overpopulation is a major threat, but it must be managed through sustainable practices and technology, not just population control.
Section D: Application and Critical Thinking (Questions 16-20)
16. B [1]
- Explanation: A high dependency ratio means there are fewer working-age people supporting a larger number of dependents (young or old). This requires higher taxes or social contributions from the workforce to fund pensions and healthcare.
- Common Mistake: Choosing A, which applies to a young population, not an aging one.
17. B [1]
- Explanation: The defining characteristic is the border. Internal migration stays within national boundaries (e.g., rural to urban within Singapore), while international migration crosses them.
18. C [1]
- Explanation: This is the standard definition of sustainability: meeting present needs without compromising the future. It balances economic, social, and environmental needs.
19. D [1]
- Explanation: Natural Increase = Birth Rate - Death Rate. Here, 10 - 12 = -2. A negative natural increase leads to population decline (assuming net migration is zero or not enough to offset it).
20. Carrying capacity is the maximum population size that an environment can sustain indefinitely given the available resources. [1]
- Explanation/Importance: It is important because if a population exceeds the carrying capacity, it leads to resource depletion, environmental degradation, and a potential drop in quality of life or population collapse. Understanding it helps in planning for sustainable resource use. [1]
Free quiz and exam paper access
Enter your details to view this paper
Your access is remembered on this device.