AI Generated Quiz
Secondary 1 Geography Human Geography Quiz
Free Sec 1 Geography Human Geography quiz, Nemo3 AI version, with questions, answers, and syllabus-aligned practice for Singapore students.
These static practice materials are generated from the site's syllabus and paper-generation workflow, with source and model context shown so students and parents can evaluate the material before use.
Questions
Secondary 1 Geography Quiz - Human Geography
Name: ___________________________
Class: ___________________________
Date: ___________________________
Score: _____ / 40
Duration: 45 minutes
Total Marks: 40
Instructions:
- Answer all questions in the spaces provided.
- Write your answers clearly and legibly.
- The number of marks is given in brackets [ ] at the end of each question or part question.
- For questions requiring extended responses, use the space provided and continue on the back if needed.
Section A: Multiple Choice Questions (10 marks)
Choose the most appropriate answer for each question. Write the letter (A, B, C, or D) in the box provided.
1. Which of the following best describes the term "urbanisation"? [1]
- A. The movement of people from urban to rural areas
- B. The increase in the proportion of people living in urban areas
- C. The decrease in population density in cities
- D. The conversion of agricultural land to industrial use only
☐
2. What is a "push factor" in the context of rural-urban migration? [1]
- A. Better job opportunities in the city
- B. Improved healthcare facilities in urban areas
- C. Lack of educational facilities in rural areas
- D. Higher wages in urban factories
☐
3. Which of the following is a characteristic of a squatter settlement? [1]
- A. Well-planned layout with proper sanitation
- B. Legal land tenure and permanent building materials
- C. Overcrowding and lack of basic services
- D. High-rise apartments with modern amenities
☐
4. In the Burgess Concentric Zone Model, which zone is known as the "Zone of Transition"? [1]
- A. Zone 1: Central Business District (CBD)
- B. Zone 2: Zone of Transition
- C. Zone 3: Low-class Residential
- D. Zone 4: Middle-class Residential
☐
5. Which of the following best defines "sustainable urban development"? [1]
- A. Maximising economic growth without considering environmental impact
- B. Meeting present urban needs without compromising future generations' needs
- C. Building as many high-rise buildings as possible to house growing populations
- D. Converting all green spaces into residential and commercial areas
☐
6. What is the main function of a Central Business District (CBD)? [1]
- A. Residential housing for low-income families
- B. Commercial and business activities
- C. Industrial manufacturing and warehousing
- D. Agricultural production and farming
☐
7. Which of the following is a "pull factor" attracting people to cities? [1]
- A. Natural disasters in rural areas
- B. Crop failure and famine
- C. Better employment opportunities
- D. Lack of healthcare in villages
☐
8. In the Hoyt Sector Model, urban growth occurs in which pattern? [1]
- A. Concentric circles around the CBD
- B. Sectors or wedges radiating from the CBD
- C. Multiple nuclei scattered across the city
- D. Random distribution with no clear pattern
☐
9. What does "counter-urbanisation" refer to? [1]
- A. Movement of people from cities to rural areas
- B. Movement of people from rural areas to cities
- C. Movement of people between cities
- D. Movement of people within the same city
☐
10. Which of the following is a strategy for managing urban waste sustainably? [1]
- A. Dumping all waste in landfills without treatment
- B. Burning waste in open pits
- C. Implementing the 3Rs: Reduce, Reuse, Recycle
- D. Discharging untreated waste into rivers
☐
Section B: Structured Questions (18 marks)
Answer all questions in the spaces provided.
11. Study the photograph below showing a squatter settlement in a developing country.
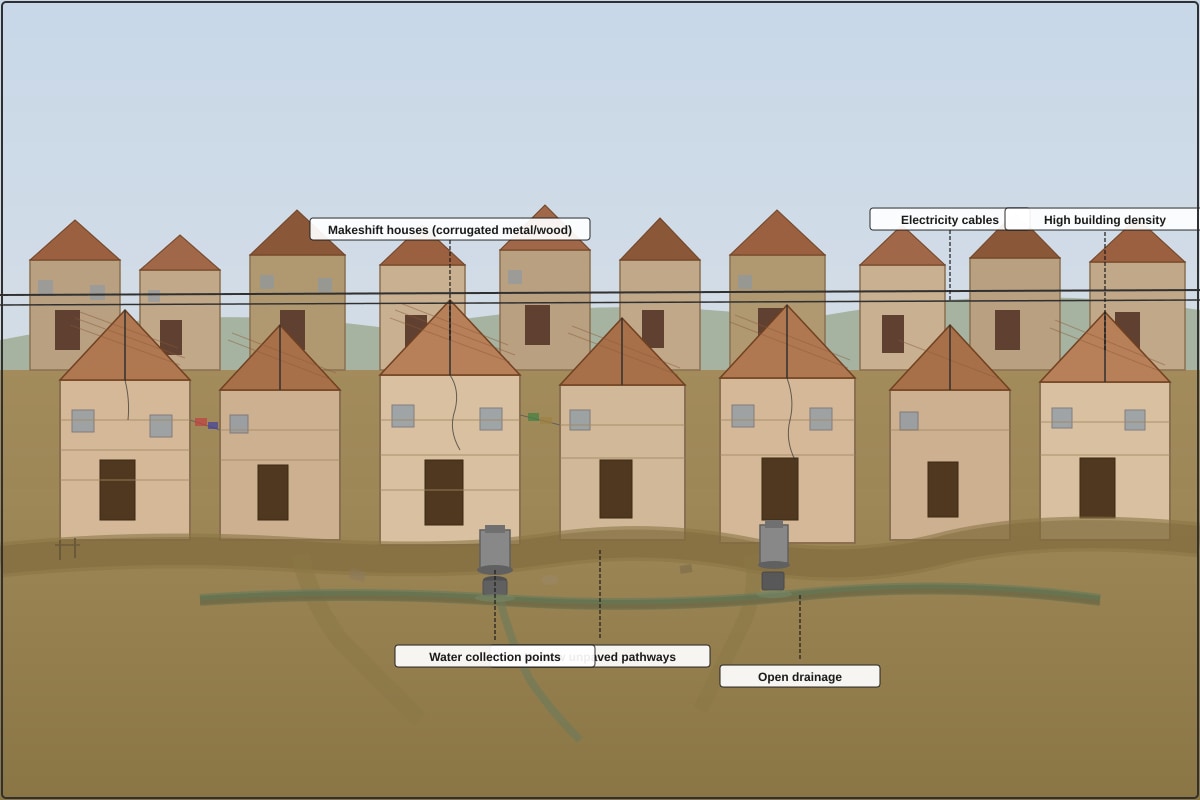
Generated source_image for Q11.
(a) Describe two visible characteristics of the squatter settlement shown in the photograph. [2]
(b) Explain two reasons why squatter settlements develop in cities of developing countries. [4]
(c) Suggest one strategy the government could use to improve living conditions in this settlement. [2]
12. The table below shows the percentage of urban population in selected countries in 1990 and 2020.
| Country | % Urban Population (1990) | % Urban Population (2020) |
|---|---|---|
| Singapore | 100% | 100% |
| Malaysia | 50% | 77% |
| Indonesia | 31% | 57% |
| Thailand | 29% | 52% |
| Vietnam | 20% | 38% |
(a) Which country had the greatest increase in urban population percentage between 1990 and 2020? [1]
(b) Calculate the increase in urban population percentage for Malaysia between 1990 and 2020. [1]
(c) Suggest two reasons for the rapid urbanisation in Southeast Asian countries like Malaysia and Indonesia. [4]
(d) Explain one challenge that rapid urbanisation poses for city planners in these countries. [2]
13. The diagram below shows the Burgess Concentric Zone Model of urban land use.
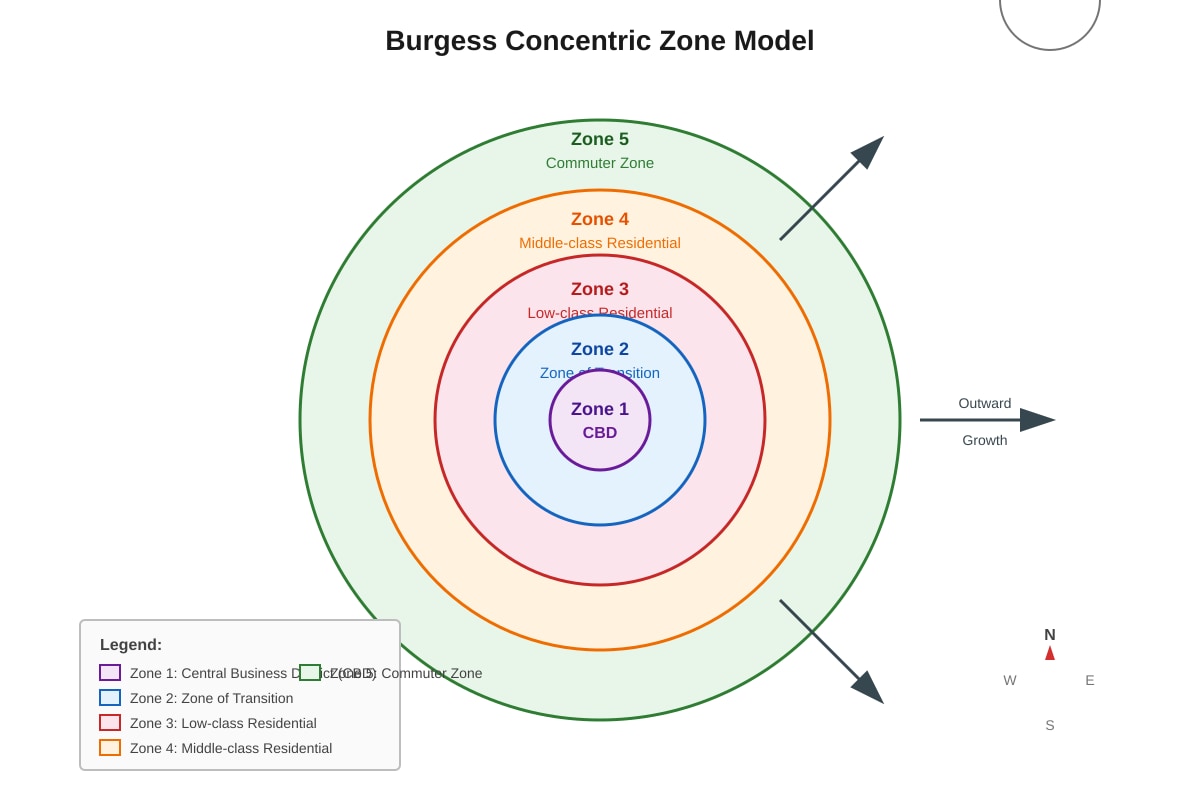
Generated diagram for Q13.
(a) Name the land use found in Zone 1. [1]
(b) Describe the typical characteristics of housing in Zone 3 (Low-class Residential). [2]
(c) Explain one limitation of the Burgess Model when applied to modern cities. [2]
14. Read the following extract about Singapore's public housing policy.
"Singapore's public housing programme, managed by the Housing and Development Board (HDB), has housed over 80% of the resident population in well-planned towns. Each town is designed to be self-contained with amenities such as schools, clinics, shopping centres, parks, and public transport nodes. The Ethnic Integration Policy ensures a balanced mix of ethnic groups in each precinct, promoting social cohesion. Recent initiatives include the Green Towns Programme, which aims to reduce energy consumption in HDB towns by 15% by 2030 through solar panels, smart LED lighting, and urban greenery."
(a) State two amenities provided in HDB towns to make them self-contained. [2]
(b) Explain the purpose of the Ethnic Integration Policy in public housing. [2]
(c) Describe one way the Green Towns Programme contributes to sustainable urban development. [2]
Section C: Extended Response Questions (12 marks)
Answer all questions. Write your answers in the spaces provided.
15. "Urbanisation brings more benefits than problems to a country."
How far do you agree with this statement? Support your answer with examples. [6]
16. Study the map extract below showing a rapidly growing city in a developing country.
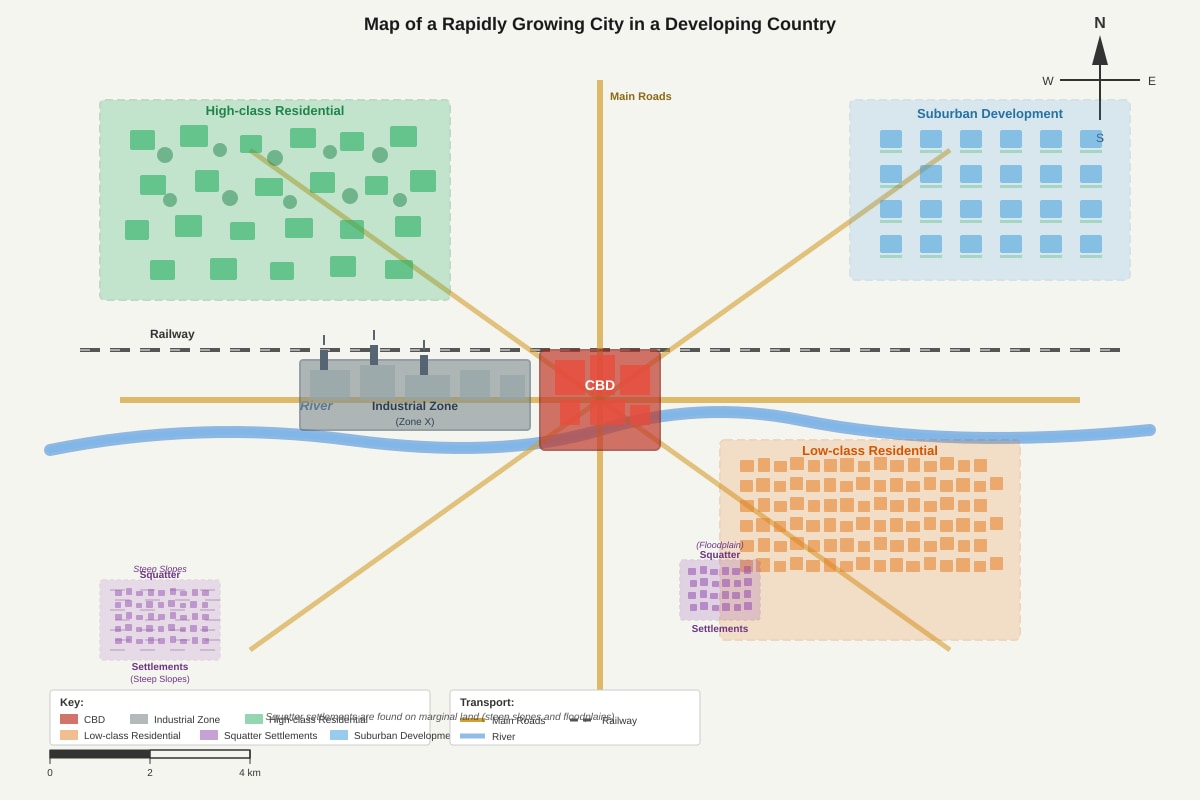
Generated map for Q16.
(a) Identify the land use zone labelled X on the map (industrial zone along the river). [1]
(b) Explain why industries are often located along rivers and railway lines. [3]
(c) The squatter settlements are located on steep slopes and floodplains. Explain two risks faced by residents living in these locations. [4]
17. The graph below shows the urban population growth rate (%) for World, More Developed Regions, and Less Developed Regions from 1950 to 2050 (projected).
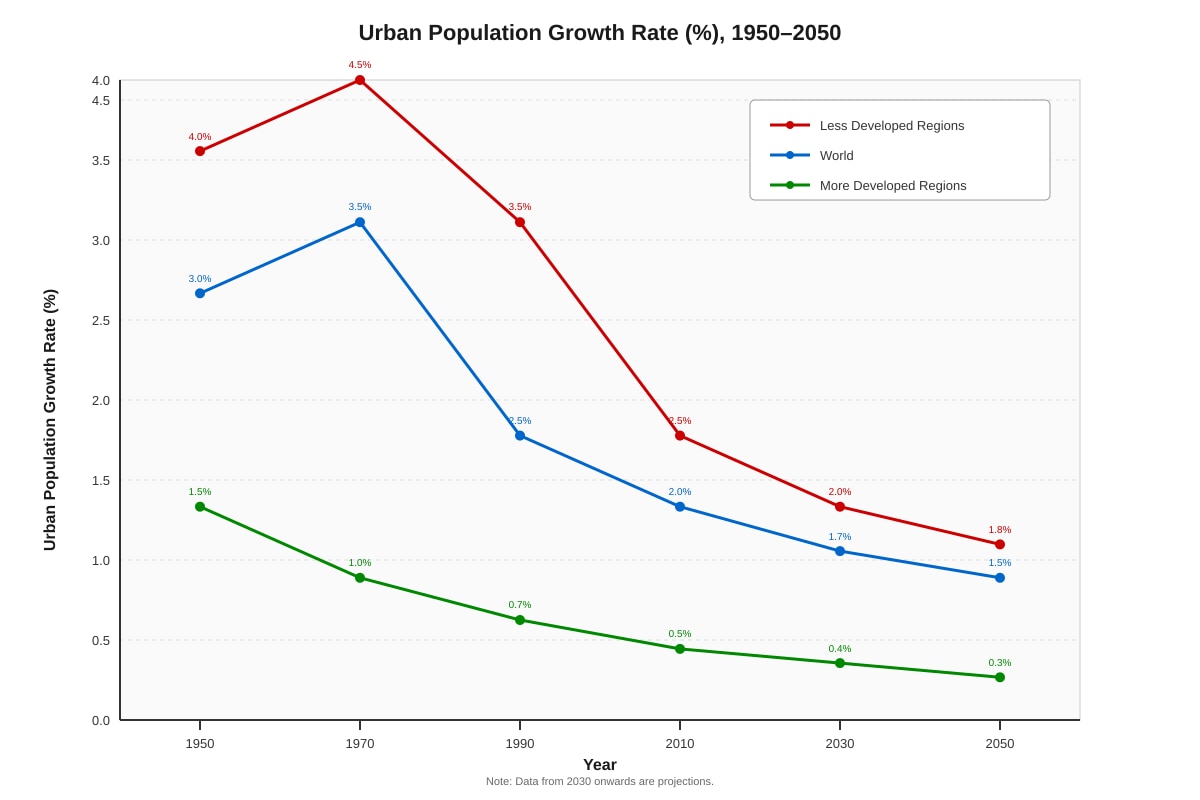
Generated graph for Q17.
(a) Describe the trend in urban population growth rate for Less Developed Regions from 1950 to 2050. [2]
(b) Suggest two reasons why urban population growth rates are higher in Less Developed Regions than in More Developed Regions. [4]
(c) Explain one consequence of high urban growth rates for cities in Less Developed Regions. [2]
18. "Sustainable urban development requires balancing economic, social, and environmental needs."
Using examples, explain how a city can achieve sustainable urban development. [6]
19. The table below shows the modal split (percentage of trips by transport mode) for two cities.
| Transport Mode | City A (European City) | City B (Asian Megacity) |
|---|---|---|
| Public Transport (MRT/Bus) | 45% | 60% |
| Private Car | 35% | 25% |
| Walking | 12% | 10% |
| Cycling | 8% | 3% |
| Others (Taxi, Motorcycle) | 0% | 2% |
(a) Which city has a higher percentage of trips made by public transport? [1]
(b) Calculate the difference in percentage of trips made by private car between the two cities. [1]
(c) Explain two benefits of a high public transport usage for urban sustainability. [4]
20. Explain the difference between site and situation of a settlement. Use a named example to illustrate your answer. [4]
End of Quiz
Answers
Secondary 1 Geography Quiz - Human Geography (Answer Key)
Total Marks: 40
Section A: Multiple Choice Questions (10 marks)
1. B — Urbanisation is the increase in the proportion of a country's population living in urban areas. It involves both rural-urban migration and natural increase in urban populations. [1]
2. C — Push factors are negative conditions that drive people away from rural areas (e.g., lack of educational facilities, poor healthcare, crop failure). Options A, B, and D are pull factors (positive attractions of cities). [1]
3. C — Squatter settlements are characterised by overcrowding, makeshift housing, lack of basic services (water, sanitation, electricity), and illegal land occupation. [1]
4. B — In the Burgess Model, Zone 2 is the "Zone of Transition" — a mixed-use area with light industry, older housing, and often slums/squatter settlements. [1]
5. B — Sustainable development meets present needs without compromising the ability of future generations to meet their own needs (Brundtland definition). [1]
6. B — The CBD is the commercial heart of the city with high land values, offices, shops, and financial institutions. [1]
7. C — Pull factors attract people to cities; better employment opportunities is a classic pull factor. Options A, B, D are push factors. [1]
8. B — The Hoyt Sector Model (1939) proposes that cities grow in sectors/wedges radiating from the CBD along transport routes, not concentric circles. [1]
9. A — Counter-urbanisation is the movement of people from urban areas to rural areas/smaller towns, often for better quality of life. [1]
10. C — The 3Rs (Reduce, Reuse, Recycle) is a core sustainable waste management strategy. Options A, B, D are unsustainable practices. [1]
Section B: Structured Questions (18 marks)
11. (a) Any two of the following (1 mark each, max 2):
- Makeshift housing constructed from corrugated metal, wood, plastic sheets, or other scavenged materials
- High building density / overcrowding with very little space between dwellings
- Narrow, unpaved pathways instead of proper roads
- Lack of formal sanitation infrastructure (open drainage, no sewerage system)
- Informal/illegal electricity connections (tangled overhead cables)
- Communal water collection points rather than piped water to each home
- Location on marginal land (steep slopes, flood-prone areas) [2]
(b) Any two explained reasons (2 marks each, max 4):
- Rapid rural-urban migration: People move to cities faster than housing can be built, leading to housing shortages and forcing migrants to build illegal shelters on vacant land.
- Poverty and unemployment: Low-income migrants cannot afford formal housing rent or purchase prices, so they resort to squatting on unused land.
- Lack of affordable housing supply: Governments in developing countries often lack resources to build sufficient low-cost public housing for the urban poor.
- High cost of land in cities: Formal housing land is expensive, pushing the poor to occupy marginal land (steep slopes, swamps, road reserves) that no one else wants. [4]
(c) Any one strategy with brief explanation (2 marks):
- In-situ upgrading: Improve infrastructure (paved roads, piped water, sanitation, electricity) and provide secure land tenure so residents invest in better housing.
- Sites-and-services schemes: Provide serviced plots (with water, sanitation, roads) at low cost where residents can build their own homes incrementally.
- Public housing construction: Build low-cost flats with subsidies for squatter households, coupled with relocation assistance.
- Community participation: Involve residents in planning upgrades to ensure solutions meet their needs and are maintained. [2]
12. (a) Malaysia — Increase of 27 percentage points (77% – 50% = 27%), which is the largest among the listed countries. [1]
(b) 27% — 77% – 50% = 27 percentage points increase. [1]
(c) Any two reasons with explanation (2 marks each, max 4):
- Industrialisation and economic growth: Manufacturing and service sectors concentrated in cities create jobs, attracting rural migrants (e.g., Malaysia's electronics industry, Indonesia's manufacturing in Jakarta).
- Rural push factors: Mechanisation of agriculture reduces farm labour needs; land fragmentation, poverty, and lack of rural services push people to cities.
- Better urban services and amenities: Cities offer better education, healthcare, entertainment, and infrastructure, acting as pull factors.
- Government policies: Some countries actively promote urbanisation as a development strategy (e.g., Indonesia's transmigration, Vietnam's Doi Moi reforms). [4]
(d) Any one challenge with explanation (2 marks):
- Housing shortage and slum formation: Rapid population growth outpaces housing supply, leading to overcrowding and squatter settlements.
- Infrastructure strain: Transport, water, sanitation, and waste systems cannot cope with sudden population increases.
- Traffic congestion and pollution: More vehicles and industrial activity degrade air quality and reduce mobility.
- Social inequality: Uneven development creates stark contrasts between wealthy and poor areas.
- Environmental degradation: Loss of green space, water pollution, and urban heat island effect. [2]
13. (a) Central Business District (CBD) / Commercial centre [1]
(b) Any two characteristics (1 mark each, max 2):
- High-density, low-cost housing (often terraced houses or older apartments)
- Occupied by lower-income groups / working-class families
- Older housing stock, often in poor condition
- Close to Zone 2 (industry/transition zone) — residents work in nearby factories
- Limited open space and amenities
- Narrow streets, high population density [2]
(c) Any one limitation with explanation (2 marks):
- Based on 1920s American cities: Does not account for modern transport (cars, highways) enabling suburbanisation and edge cities.
- Assumes flat terrain: Ignores physical constraints (rivers, hills, coastlines) that distort concentric patterns.
- Single CBD assumption: Modern cities often have multiple nuclei (polycentric) — e.g., Singapore's regional centres (Jurong, Tampines, Woodlands).
- Ignores gentrification: Inner-city areas (Zone 2) can be redeveloped into high-value residential/commercial, not just low-class housing.
- Cultural differences: Land use patterns vary by culture; e.g., in some Asian cities, wealthy live near CBD, not in outer suburbs. [2]
14. (a) Any two amenities (1 mark each, max 2):
- Schools (primary/secondary)
- Clinics / polyclinics / healthcare facilities
- Shopping centres / markets / hawker centres
- Parks / playgrounds / recreational facilities
- Public transport nodes (MRT stations, bus interchanges)
- Community centres / libraries [2]
(b) Purpose of Ethnic Integration Policy (2 marks):
- Ensures a balanced mix of Chinese, Malay, Indian, and other ethnic groups in each HDB precinct/block by setting proportional limits.
- Prevents the formation of racial enclaves/ghettos.
- Promotes daily interaction and mutual understanding among different races.
- Strengthens social cohesion and racial harmony in Singapore's multi-ethnic society. [2]
(c) Any one way with explanation (2 marks):
- Solar panels on HDB rooftops: Generate clean renewable energy, reducing reliance on fossil fuels and lowering carbon emissions.
- Smart LED lighting: Motion-sensor LED lights in common areas reduce electricity consumption significantly.
- Urban greenery (vertical greening, rooftop gardens): Reduces urban heat island effect, improves air quality, lowers cooling energy needs.
- Pneumatic waste conveyance system: Reduces truck trips for waste collection, lowering emissions and traffic. [2]
Section C: Extended Response Questions (12 marks)
15. Level-marked response (6 marks)
Level 3 (5–6 marks): Balanced argument with developed points on both benefits and problems, supported by specific examples. Clear conclusion weighing the statement.
Level 2 (3–4 marks): Some valid points on benefits and/or problems, but may be one-sided or lack examples. Limited evaluation.
Level 1 (1–2 marks): Simple statements, generalisations, or only one side considered. No real evaluation.
Indicative content:
Benefits of urbanisation:
- Economic growth: Cities are engines of growth — agglomeration economies, innovation, higher productivity (e.g., Singapore, Shanghai).
- Economies of scale: Efficient provision of services (transport, healthcare, education) due to population concentration.
- Social opportunities: Better access to education, healthcare, jobs, cultural activities, social mobility.
- Environmental efficiency: Compact cities can have lower per-capita carbon footprints than sprawling rural settlements (public transport, district cooling).
Problems of urbanisation:
- Housing shortages & slums: Rapid growth leads to informal settlements (e.g., Dharavi in Mumbai, favelas in Rio).
- Traffic congestion & pollution: Air/noise pollution, lost productivity (e.g., Jakarta, Manila).
- Infrastructure strain: Water scarcity, waste management crises, flooding (e.g., Chennai floods, Cape Town water crisis).
- Social inequality: Spatial segregation, urban poverty, crime.
- Environmental degradation: Loss of biodiversity, urban heat island, water pollution.
Evaluation: Urbanisation brings significant benefits if managed well (e.g., Singapore, Curitiba). Unmanaged rapid urbanisation creates severe problems. The net outcome depends on governance, planning, and investment. [6]
16. (a) Industrial Zone / Industrial Area [1]
(b) Three reasons (1 mark each, max 3):
- Transport access: Rivers provide cheap water transport for heavy/bulky raw materials and finished goods; railways enable efficient long-distance freight movement.
- Water supply: Industries need large volumes of water for cooling, processing, cleaning (e.g., petrochemical, food processing, textiles).
- Waste disposal: Historically, rivers were used to discharge industrial wastewater (though now regulated).
- Flat land: River valleys often provide flat, expansive land suitable for large factory buildings.
- Proximity to port: Rivers often lead to ports, facilitating import/export. [3]
(c) Two risks with explanation (2 marks each, max 4):
- Steep slopes — Landslides: Heavy rain saturates soil, causing slope failure. Makeshift houses lack foundations/retaining walls. High risk of injury/death and property loss (e.g., Rio de Janeiro, Hong Kong).
- Steep slopes — Soil erosion: Removal of vegetation for housing exposes soil to rain, washing/blowing away topsoil, destabilising slopes further.
- Floodplains — Flooding: River overflow during monsoon/heavy rain inundates low-lying settlements. Contaminated floodwater spreads waterborne diseases (cholera, dengue). Homes and possessions destroyed.
- Floodplains — Health hazards: Stagnant floodwater breeds mosquitoes (malaria, dengue); sewage contamination causes diarrhoeal diseases. [4]
17. (a) Trend description (2 marks):
- Urban population growth rate in Less Developed Regions was high throughout (around 4–4.5% in 1950–1970s).
- It peaked in the 1970s at approximately 4.5%.
- Since then, it has been declining steadily to about 2% by 2050 (projected).
- Despite the decline, rates remain significantly higher than More Developed Regions throughout the period. [2]
(b) Two reasons with explanation (2 marks each, max 4):
- High rural-urban migration: Large rural populations in developing countries move to cities for jobs (industrialisation, services), while developed countries are already highly urbanised (limited rural pool).
- High natural increase in cities: Younger migrant populations have higher birth rates; improved urban healthcare lowers death rates, causing rapid natural increase.
- Earlier stage of urbanisation: Less Developed Regions are in the "acceleration phase" of urbanisation curve; More Developed Regions are in "terminal phase" (over 70–80% urban).
- Economic restructuring: Shift from agriculture to manufacturing/services in developing countries drives urban job creation. [4]
(c) One consequence with explanation (2 marks):
- Housing crisis and slum proliferation: Cities cannot build formal housing fast enough, leading to massive informal settlements (e.g., Lagos, Kinshasa, Dhaka).
- Infrastructure collapse: Water, sanitation, transport, electricity systems overwhelmed; frequent breakdowns and unequal access.
- Unemployment and informal economy: Job creation lags behind labour force growth; most work in low-paid, insecure informal sector.
- Environmental degradation: Air/water pollution, waste mountains, loss of peri-urban agricultural land. [2]
18. Level-marked response (6 marks)
Level 3 (5–6 marks): Clear explanation of all three pillars (economic, social, environmental) with specific strategies/examples. Shows integration/balance.
Level 2 (3–4 marks): Covers at least two pillars with some examples. Limited integration.
Level 1 (1–2 marks): Vague statements, only one pillar, or generic sustainability talk without urban context.
Indicative content:
Economic sustainability:
- Diversified economy (not reliant on single industry) — e.g., Singapore's finance, tech, biomedical, tourism.
- Support innovation/entrepreneurship — incubators, R&D investment.
- Efficient transport/logistics — reduces business costs (e.g., MRT, port connectivity).
- Job creation matching skills — lifelong learning (SkillsFuture).
Social sustainability:
- Inclusive housing — mixed-income, mixed-ethnicity (Singapore's HDB, Ethnic Integration Policy).
- Accessible services — healthcare, education, community spaces within 15-minute neighbourhoods.
- Public participation — residents involved in planning (e.g., Singapore's "Remaking Our Heartland").
- Ageing-friendly design — barrier-free access, active ageing hubs.
Environmental sustainability:
- Green transport — prioritise public transport, cycling, walking (Copenhagen, Singapore's car-lite).
- Energy efficiency — green buildings (BCA Green Mark), district cooling, solar (HDB Green Towns).
- Urban greenery — "City in Nature" (Singapore), parks, park connectors, biodiversity corridors.
- Circular economy — waste-to-energy (Tuas Nexus), recycling, water circularity (NEWater).
- Climate resilience — coastal protection, flood management (ABC Waters).
Integration: Policies must work together — e.g., green transport reduces emissions (environmental), improves accessibility for low-income (social), reduces congestion costs (economic). [6]
19. (a) City B — 60% vs 45% [1]
(b) 10% — 35% – 25% = 10 percentage points [1]
(c) Two benefits with explanation (2 marks each, max 4):
- Reduced carbon emissions / air pollution: Fewer private cars mean lower per-capita transport emissions. Public transport (especially electric rail) moves many people efficiently. Improves air quality and mitigates climate change.
- Reduced traffic congestion: High public transport usage frees road space, reducing travel time and economic losses from congestion. Supports economic productivity.
- Social equity / accessibility: Affordable public transport provides mobility for all income groups (elderly, students, low-income), enabling access to jobs, education, healthcare.
- Land use efficiency: Less space needed for roads/parking; land can be used for housing, parks, community facilities. Supports compact, liveable cities.
- Energy efficiency: Public transport uses less energy per passenger-km than private cars. Reduces national energy demand and import dependence. [4]
20. Site vs Situation (4 marks):
Site (1 mark): The physical characteristics of the actual land on which a settlement is built — e.g., flat land, dry point, defensive site, water supply, fertile soil, shelter, building materials.
Situation (1 mark): The location of a settlement relative to surrounding features — e.g., proximity to resources, transport routes, other settlements, markets, ports, bridging point, route centre.
Named example (1 mark): Singapore (or any valid city).
Illustration (1 mark):
- Site: Singapore originally grew on a small island at the mouth of the Singapore River — sheltered deep-water harbour (natural port), fresh water from river, relatively flat coastal land, strategic defensive position.
- Situation: Located at the southern tip of the Malay Peninsula, straddling the Strait of Malacca — key maritime trade route between East Asia (China, Japan) and South Asia/Middle East/Europe. This situation made it a natural entrepôt and global trading hub, driving its growth far beyond what its small site alone would suggest. [4]
End of Answer Key
Free quiz and exam paper access
Enter your details to view this paper
Your access is remembered on this device.