AI Generated Quiz
Secondary 1 Geography Human Geography Quiz
Free Sec 1 Geography Human Geography quiz, Kimi2.6 AI version, with questions, answers, and syllabus-aligned practice for Singapore students.
These static practice materials are generated from the site's syllabus and paper-generation workflow, with source and model context shown so students and parents can evaluate the material before use.
Questions
Secondary 1 Geography Quiz - Human Geography
Name: _________________________ Class: _________________________
Date: _________________________ Score: ________/40
Duration: 50 minutes
Total Marks: 40
Instructions:
- Answer ALL questions.
- Write your answers in the spaces provided.
- For questions requiring explanation, use complete sentences and geographical terms.
- Read each question carefully before answering.
Section A: Population and Settlement (Questions 1–7) — 14 marks
Answer all questions in this section.
1. Define the term "population density." [1]
2. State TWO factors that can cause a country's population to increase naturally. [2]
3. The table below shows the population data for two countries in 2023.
| Feature | Country A | Country B |
|---|---|---|
| Birth rate (per 1,000) | 12 | 38 |
| Death rate (per 1,000) | 9 | 12 |
| Infant mortality rate (per 1,000 births) | 4 | 65 |
| Life expectancy (years) | 82 | 54 |
(a) Calculate the natural increase rate for Country B. Show your working. [2]
(b) Identify which country is likely to be a More Economically Developed Country (MEDC). Give ONE reason for your answer. [2]
4. Explain why many people in developing countries move from rural areas to cities. [3]
5. The diagram below shows a model of settlement hierarchy.
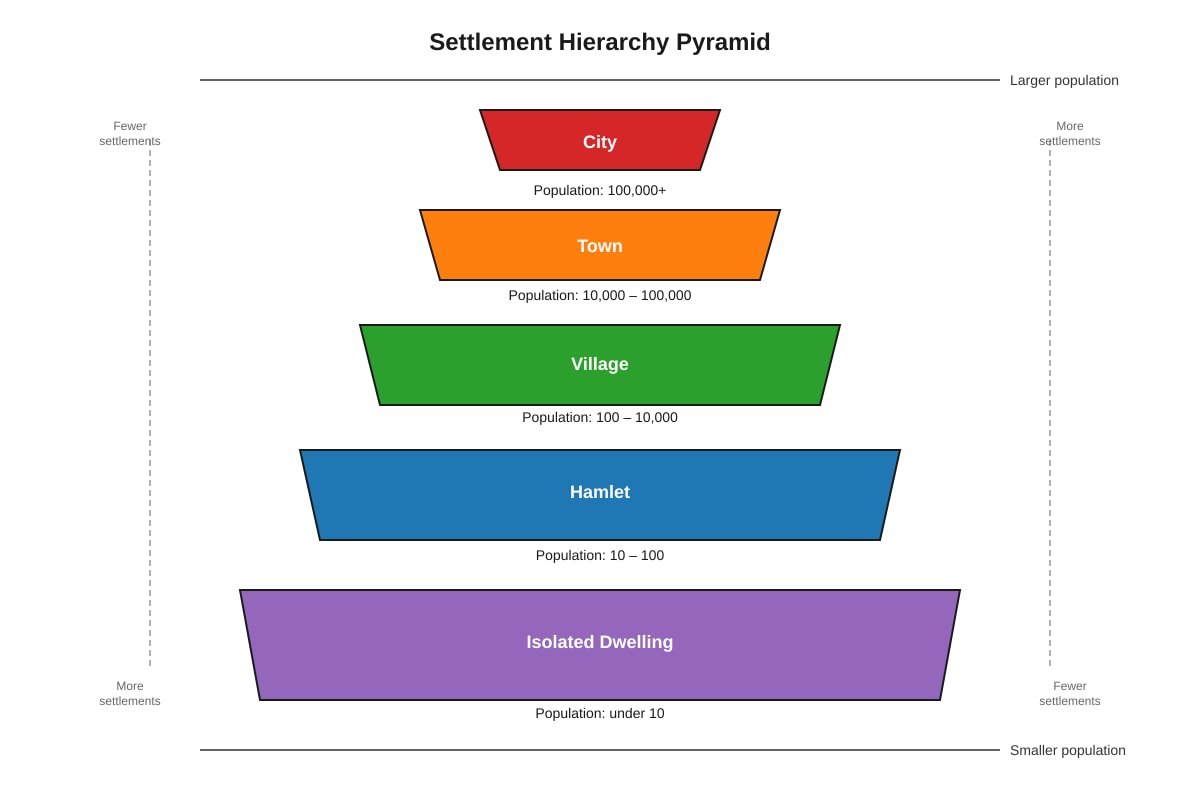
Generated diagram for Q5.
(a) Name the smallest type of settlement shown in the diagram. [1]
(b) Suggest ONE reason why a city offers more services than a hamlet. [1]
6. Define the term "urbanisation." [1]
7. Explain ONE push factor and ONE pull factor that might cause rural-urban migration in a developing country. [3]
Section B: Economic Activities and Resources (Questions 8–14) — 14 marks
Answer all questions in this section.
8. State the difference between "primary economic activities" and "secondary economic activities." Give ONE example of each. [2]
9. The graph below shows the percentage of people employed in different economic sectors in Country X and Country Y.
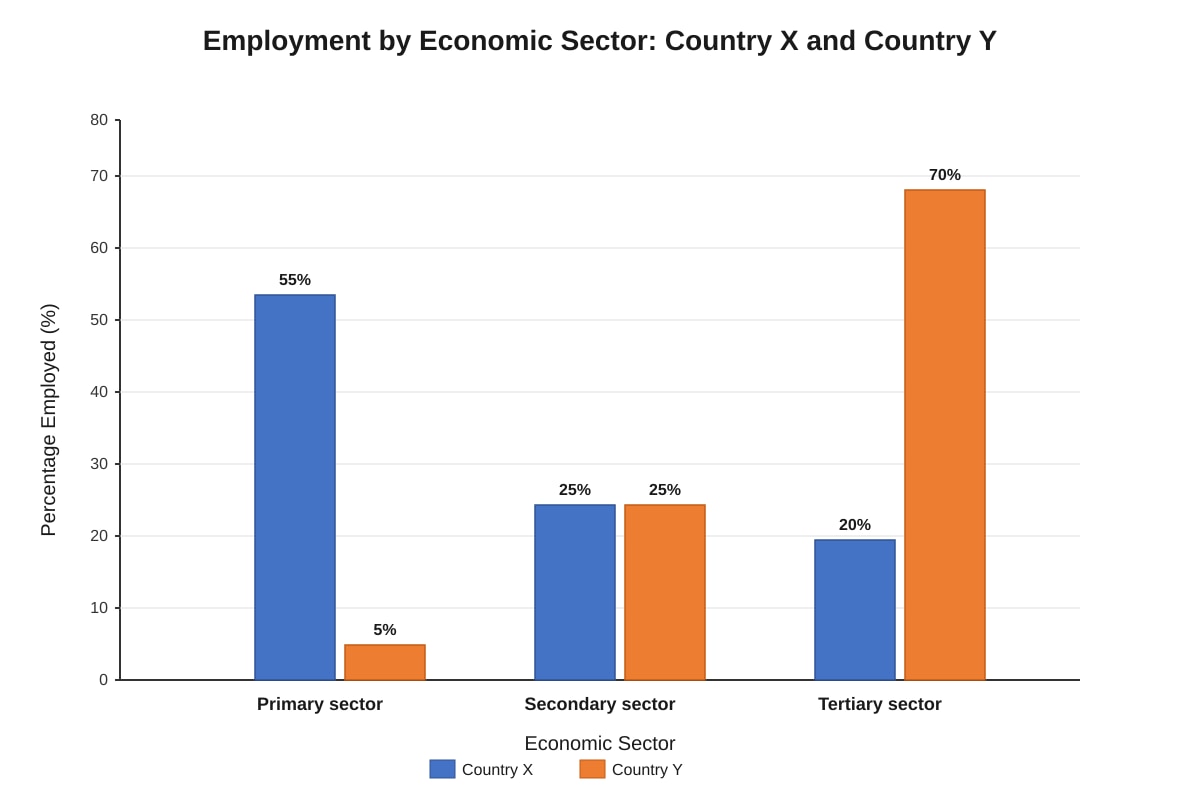
Generated graph for Q9.
(a) Identify which country has a higher percentage of people working in the tertiary sector. [1]
(b) Suggest whether Country X is likely to be a developed or developing country. Explain your answer using evidence from the graph. [2]
10. Explain why the location of a factory might be influenced by the availability of raw materials. [2]
11. The passage below describes changes in employment in Singapore.
"In 1960, over 80% of Singapore's workforce was employed in manufacturing and port-related jobs. By 2023, over 80% worked in services such as finance, tourism, and information technology. Manufacturing now employs less than 15% of workers."
(a) Describe the change in Singapore's economic structure shown in the passage. [1]
(b) Explain TWO reasons why Singapore's economy has shifted towards tertiary activities. [4]
12. Define the term "sustainable development." [1]
13. State ONE way that mining for minerals can damage the environment. [1]
14. Suggest TWO strategies a country could use to manage its forest resources more sustainably. [3]
Section C: Fieldwork Skills and Application (Questions 15–20) — 12 marks
Answer all questions in this section.
15. A group of Secondary 1 students is planning fieldwork to investigate land use in a local neighbourhood. They decide to use a land use survey.
(a) State ONE other data collection method the students could use to investigate land use. [1]
(b) Explain why it is important for the students to work in pairs during their fieldwork. [2]
16. The map extract below shows part of a town centre.
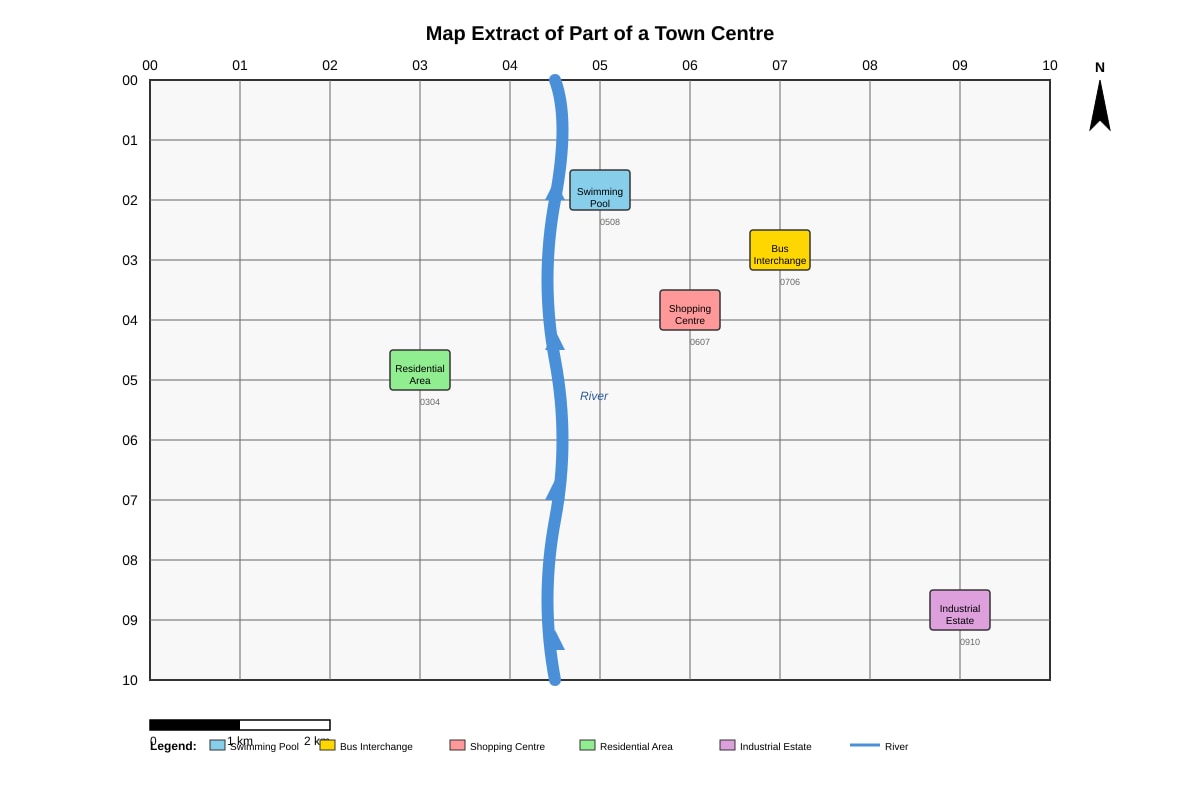
Generated map for Q16.
(a) State the 4-figure grid reference of the bus interchange. [1]
(b) In which direction is the shopping centre from the swimming pool? [1]
(c) Measure the straight-line distance from the swimming pool (0508) to the industrial estate (0910). Give your answer in kilometers. [2]
17. The data below shows the number of passengers using a train station each month.
| Month | Passengers (thousands) |
|---|---|
| January | 45 |
| February | 42 |
| March | 48 |
| April | 55 |
| May | 62 |
| June | 85 |
| July | 92 |
| August | 88 |
(a) Calculate the range of the passenger data. [1]
(b) Suggest ONE reason why passenger numbers are higher in June, July, and August. [1]
18. Explain why it is important to collect both primary data and secondary data when conducting geographical research. [2]
19. The photograph below shows a street scene in a residential area.
Image pending generation: source_image for Q19.
Identify TWO features shown in the photograph that suggest this is a planned housing area in Singapore. [2]
20. A student wants to investigate whether people in different age groups have different opinions about recycling. Design a simple questionnaire that could be used. Your answer should include:
- ONE question to find out the respondent's age group
- ONE question about attitudes to recycling
- ONE closed question about recycling behaviour [3]
END OF QUIZ
Answers
Secondary 1 Geography Quiz - Human Geography (Answer Key)
Total Marks: 40
Section A: Population and Settlement
1. Population density is the number of people living in a specific area, usually measured as people per square kilometre (persons/km²). [1]
Teaching note: This measures how crowded an area is. Singapore has a very high population density of over 7,000 people per km².
2. Any two from: [2]
- High birth rate / more births than deaths
- Improved healthcare leading to lower death rate
- Better nutrition and living conditions
- Immigration (people moving into the country)
Marking: 1 mark for each correct factor; maximum 2 marks. Accept any valid factor.
3.
(a) Natural increase rate = Birth rate − Death rate [1] = 38 − 12 = 26 per 1,000 [1]
Method: Natural increase rate is always calculated as births minus deaths, expressed as a rate per 1,000 population. For Country B: 38 births per 1,000 minus 12 deaths per 1,000 = 26 more people per 1,000 each year.
Common error: Students sometimes add the rates or divide incorrectly. The formula is always subtraction only.
(b) Country A [1]; it has low birth and death rates, low infant mortality, and high life expectancy. [1]
Teaching note: MEDCs typically have low population growth, advanced healthcare (low infant mortality, high life expectancy), and aging populations. Country B's high birth rate, high infant mortality, and lower life expectancy are characteristic of Less Economically Developed Countries (LEDCs).
4. Any three points from: [3]
- Limited job opportunities in rural areas / more jobs available in cities
- Better wages and income in urban areas
- Better access to services (healthcare, education, entertainment)
- Mechanisation reducing need for farm labour
- Drought or land degradation making farming difficult
- "Bright lights" attraction of city life
Marking: 1 mark for each valid, explained point; maximum 3 marks. Explanations must show why the factor causes movement, not just list it.
5.
(a) Isolated dwelling [1]
(b) A city has a larger population / more customers, so it can support more specialised services (hospitals, universities, shopping malls) that need many people to be profitable. [1]
Teaching note: This relates to the threshold population concept—larger settlements support more services because they have enough customers.
6. Urbanisation is the increase in the proportion of people living in towns and cities. [1]
Teaching note: It can be caused by rural-urban migration and natural increase in urban areas. Singapore is highly urbanised with 100% of its population in urban areas.
7. Any one push factor and any one pull factor, each with explanation:
Push factor (from rural area): [1]
- Poor harvests / drought / flooding making farming difficult
- Lack of jobs / low wages in rural areas
- Limited access to education or healthcare
- Landlessness or inheritance problems
Pull factor (to urban area): [1]
- Better job opportunities and higher wages
- Better education and healthcare facilities
- More entertainment and lifestyle attractions
- Perception of improved quality of life
Explanation of why each causes movement: [1]
Marking: 1 mark for valid push factor, 1 mark for valid pull factor, 1 mark for explaining how each factor causes movement from rural to urban.
Section B: Economic Activities and Resources
8. Primary economic activities involve extracting raw materials from the earth [1], for example fishing, farming, mining, forestry (any one). [1] Secondary economic activities involve processing raw materials into manufactured goods [1], for example car manufacturing, textile production, food processing (any one). [0.5 each for examples, but max 1 for both examples]
Teaching note: Primary = first stage (direct from nature); Secondary = second stage (making things). Tertiary = providing services.
9.
(a) Country Y [1]
(b) Country X is likely a developing country [1] because it has a high percentage (55%) of workers in the primary sector, which is typical of countries where most people work in agriculture and extractive industries. [1]
Teaching note: Developed countries typically have most workers in tertiary services (70%+), while developing countries have more in primary sector. The pattern shown is classic economic structure transition.
10. Factories need to be near raw materials to reduce transport costs [1], as bulky or heavy raw materials are expensive to move over long distances. Some raw materials also perish or are difficult to transport. [1]
Marking: 1 mark for identifying cost/transport issue, 1 mark for developing the explanation.
11.
(a) Singapore's economy has shifted from secondary/manufacturing dominance to tertiary/service sector dominance. [1] Or: Manufacturing employment has fallen while service employment has risen dramatically.
(b) Any two reasons, each with explanation: [4]
- Singapore has limited land and raw materials, so manufacturing is constrained; services need less land and resources [2]
- Singapore invested in education to develop a skilled workforce suited to high-value services like finance and technology [2]
- Global competition made low-cost manufacturing difficult; Singapore moved to higher-value activities [2]
- Government policy deliberately promoted financial services, tourism, and technology sectors [2]
- Singapore's strategic location as a port and communications hub supports service industries [2]
Marking: 2 marks per reason (1 for identifying factor, 1 for explaining why it caused the shift). Maximum 4 marks.
12. Sustainable development is development that meets the needs of the present without compromising the ability of future generations to meet their own needs. [1]
Teaching note: This Brundtland Commission definition emphasises intergenerational equity—using resources now in ways that don't deplete them for our children and grandchildren.
13. Any one from: [1]
- Deforestation and habitat destruction
- Water pollution from mine waste
- Air pollution from dust and processing
- Land degradation and subsidence
- Noise pollution affecting nearby communities
14. Any two strategies with development: [3]
- Selective logging (cutting only mature trees, leaving young trees to grow) [1]; allows forest to regenerate and maintains ecosystem [0.5]
- Reforestation (planting trees to replace those cut) [1]; ensures long-term timber supply and carbon storage [0.5]
- Establishing national parks / protected areas [1]; preserves biodiversity and ecosystem services [0.5]
- Certification schemes (e.g., FSC) to ensure sustainable sourcing [1]; creates market incentives for sustainable practices [0.5]
- Community forestry involving local people in management decisions [1]; ensures local needs are met and encourages stewardship [0.5]
Marking: 1 mark for strategy, 0.5 mark for explanation of how it promotes sustainability. Two strategies with explanations = 3 marks. If only strategies given without explanation: 2 marks maximum.
Section C: Fieldwork Skills and Application
15.
(a) Any one from: [1]
- Photographs / photo analysis
- Questionnaires / surveys
- Interviews with local residents
- Traffic count
- Environmental quality survey
- Observation checklists
(b) Working in pairs improves safety [1], especially in unfamiliar areas or near roads [0.5]. It also allows one person to record data while the other observes, improving accuracy [0.5]. Or: Partners can discuss and verify observations, reducing bias.
Marking: 1 mark for safety reason with development, 1 mark for data quality reason.
16.
(a) 0706 [1]
Method: 4-figure grid references are always given as eastings (left to right) followed by northings (bottom to top). The bus interchange is in the grid square where easting 07 crosses northing 06.
(b) Southeast [1]
Method: From swimming pool (0508), shopping centre (0607) is to the right (higher easting = east) and down (lower northing = south).
(c) Using Pythagoras or measuring:
- Horizontal distance: 09 − 05 = 4 km [0.5]
- Vertical distance: 10 − 08 = 2 km [0.5]
- Straight-line distance = √(4² + 2²) = √(16 + 4) = √20 ≈ 4.47 km, or approximately 4.5 km [1]
Accept: Answers between 4.4–4.5 km. Accept scale measurement method if described.
Common error: Simply adding 4 + 2 = 6 km is incorrect—this gives the distance along the sides, not the diagonal.
17.
(a) Range = Highest value − Lowest value = 92 − 42 = 50 thousand passengers [1]
(b) These are school holiday months in Singapore / June and July are holiday season / families travel more during vacations [1]
18. Primary data is collected firsthand by the researcher, so it is specific to the study and up-to-date [1]. Secondary data already exists (e.g., government statistics), so it saves time and allows comparison with larger areas or historical trends [1]. Using both checks reliability and fills gaps.
19. Any two from: [2]
- High-rise apartment blocks (HDB flats) indicating planned public housing
- Ground floor shops (mixed-use zoning) showing integrated planning
- Playground/recreational facilities provided by the Housing Board
- Covered walkways connecting buildings
- Organised parking areas
- Landscaped greenery and trees
- Rubbish chute system for waste management
Marking: 1 mark per valid feature. Must be visible in the described image.
20. Any valid questionnaire design including:
Age group question (closed): [1]
- "Which age group do you belong to? □ Under 18 □ 18–30 □ 31–50 □ 51–65 □ Over 65"
Attitude question (Likert scale or opinion): [1]
- "Do you think recycling is important? □ Strongly agree □ Agree □ Neutral □ Disagree □ Strongly disagree"
Behaviour question (closed, specific): [1]
- "How often do you recycle? □ Daily □ Weekly □ Monthly □ Rarely □ Never"
- "Do you separate your waste for recycling? □ Yes □ No"
Marking: 1 mark for clear age classification; 1 mark for attitude/opinion question; 1 mark for closed behavioural question. Must be distinct question types.
END OF ANSWER KEY
Free quiz and exam paper access
Enter your details to view this paper
Your access is remembered on this device.