AI Generated Quiz
Secondary 1 Geography Fieldwork Quiz
Free Sec 1 Geography Fieldwork quiz, Nemo3 AI version, with questions, answers, and syllabus-aligned practice for Singapore students.
These static practice materials are generated from the site's syllabus and paper-generation workflow, with source and model context shown so students and parents can evaluate the material before use.
Questions
Secondary 1 Geography Quiz - Fieldwork
Name: ___________________________
Class: ___________________________
Date: ___________________________
Score: _____ / 30
Duration: 45 minutes
Total Marks: 30
Instructions:
- Answer all questions.
- Write your answers in the spaces provided.
- For questions requiring diagrams or maps, refer to the image placeholders provided.
- The number of marks is given in brackets [ ] at the end of each question or part question.
Section A: Fieldwork Inquiry Process (10 marks)
1. State the first step in the geographical inquiry process when conducting fieldwork. [1]
2. A group of students wants to investigate "How does the amount of vegetation cover affect surface temperature in our school compound?"
(a) Write a suitable hypothesis for this investigation. [1]
(b) Identify the independent variable and dependent variable in this investigation. [2]
Independent variable: ________________________________________________________
Dependent variable: _________________________________________________________
3. Explain why it is important to conduct a pilot study before the main data collection in fieldwork. [2]
4. During fieldwork, students measure the noise level at 10 different locations around the school at 8:00 am and again at 12:00 pm.
(a) Name the data collection method used. [1]
(b) State one advantage and one limitation of this method. [2]
Advantage: _________________________________________________________________
Limitation: _________________________________________________________________
5. A student records the following data for wind speed (in km/h) at five locations: 12, 8, 15, 10, 5.
Calculate the mean wind speed. Show your working. [2]
Section B: Data Collection Techniques & Equipment (10 marks)
6. Match each fieldwork equipment to its correct use. Draw lines to connect them. [3]
| Equipment | Use |
|---|---|
| Anemometer | A. Measuring light intensity |
| Lux meter | B. Measuring wind speed |
| Infrared thermometer | C. Measuring surface temperature |
| Soil pH meter | D. Measuring soil acidity/alkalinity |
7. Students are investigating infiltration rates on different surfaces (grass, concrete, bare soil).
(a) Name the equipment used to measure infiltration rate. [1]
(b) Describe how to use this equipment to collect reliable data. [3]
8. When measuring air temperature using a digital thermometer during fieldwork, state two precautions students should take to ensure accurate readings. [2]
9. A student uses a quadrat to estimate the percentage of vegetation cover in a 10 m × 10 m field.
(a) Explain why the student should take multiple quadrat samples instead of just one. [2]
(b) If the student places the quadrat at 5 random locations and records vegetation cover as 80%, 60%, 90%, 70%, and 50%, calculate the average percentage vegetation cover. [1]
10. State one reason why systematic sampling (e.g., measuring every 10 metres along a transect) might be more appropriate than random sampling for a study on how temperature changes from the school building to the field. [1]
Section C: Data Presentation, Analysis & Evaluation (10 marks)
11. Students collected data on the number of vehicles passing the school gate every hour from 7 am to 6 pm.
(a) Name the most appropriate graph to present this data. [1]
(b) Explain why this graph is suitable. [1]
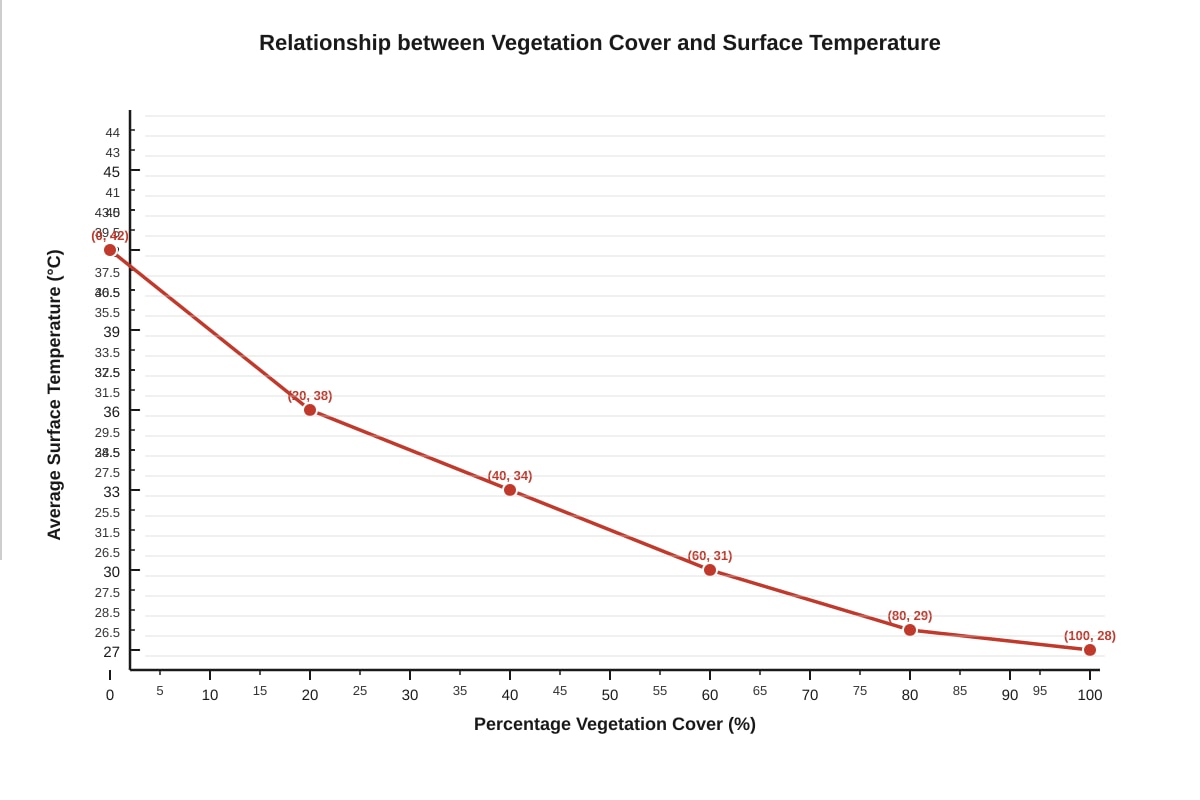
Generated graph for Q12.
12. Refer to the graph in the image placeholder above, which shows the relationship between vegetation cover and surface temperature.
(a) Describe the relationship shown by the graph. [2]
(b) Using geographical knowledge, explain this relationship. [2]
13. A student concludes: "Areas with more trees have lower surface temperatures, so planting more trees will definitely cool down the entire school."
Evaluate this conclusion. State one strength and one limitation of the conclusion based on fieldwork evidence. [2]
Strength: ___________________________________________________________________
Limitation: _________________________________________________________________
14. During a fieldwork investigation on soil moisture, a student records the following data at three sites:
| Site | Soil Moisture (%) | Vegetation Cover (%) |
|---|---|---|
| A | 15 | 20 |
| B | 25 | 50 |
| C | 35 | 80 |
(a) Plot the data on the scatter graph axes provided in the image placeholder below. [2]
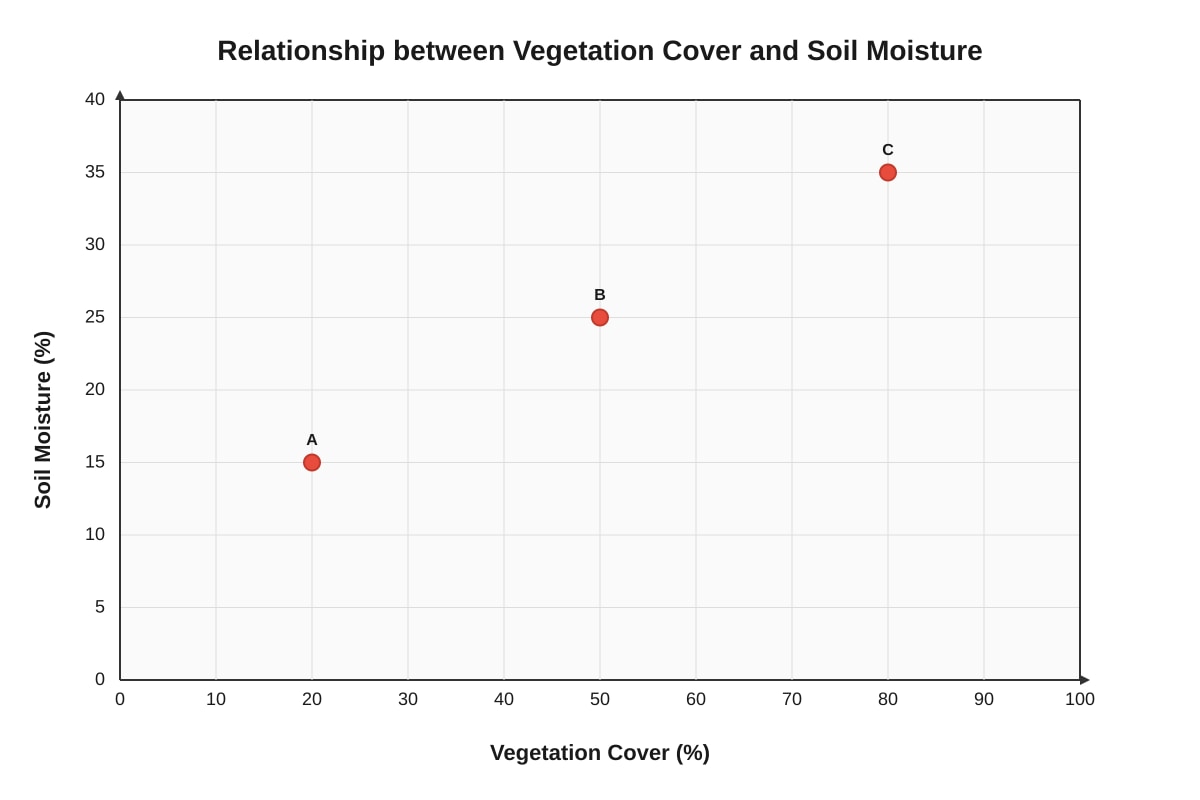
Generated graph for Q14.
(b) Draw a line of best fit and describe the trend. [2]
15. State two ways students can improve the reliability of their fieldwork data collection. [2]
16. A group of students presents their fieldwork findings using a choropleth map showing noise levels around the school.
(a) Explain what a choropleth map shows. [1]
(b) State one advantage of using a choropleth map for this data. [1]
17. In the evaluation stage of geographical inquiry, students reflect on their investigation.
State two questions a student should ask when evaluating the validity of their conclusions. [2]
18. A student writes the following conclusion: "The hypothesis that 'vegetation cover reduces surface temperature' is supported because the graph shows a negative correlation."
Identify one missing element that would make this a stronger geographical conclusion. [1]
19. During fieldwork, a student accidentally records a wind speed reading of 250 km/h (likely a typo; actual should be 25 km/h).
(a) What term describes this type of error? [1]
(b) State one way to identify such errors during data checking. [1]
20. Fieldwork often involves ethical considerations. State two ethical guidelines students should follow when conducting fieldwork in a public park. [2]
End of Quiz
Answers
Secondary 1 Geography Quiz - Fieldwork (Answer Key)
Total Marks: 30
Section A: Fieldwork Inquiry Process (10 marks)
1. State the first step in the geographical inquiry process when conducting fieldwork. [1]
Answer: Identifying the geographical question / Asking a geographical question / Defining the research question.
Marking Note: Accept any phrasing that indicates the starting point is formulating a question.
Teaching Note: The geographical inquiry process follows: Question → Plan → Collect → Present → Analyse → Conclude → Evaluate → Reflect. The first step is always asking a focused geographical question.
2. (a) Write a suitable hypothesis for this investigation. [1]
Answer: "The higher the vegetation cover, the lower the surface temperature." OR "As vegetation cover increases, surface temperature decreases."
Marking Note: Must show a clear predicted relationship between the two variables (directional hypothesis).
Teaching Note: A hypothesis is a testable statement predicting the relationship between variables. It should be specific and directional.
(b) Identify the independent variable and dependent variable. [2]
Answer:
Independent variable: Vegetation cover (percentage / amount)
Dependent variable: Surface temperature (°C)
Marking Note: 1 mark each. Variables must be correctly identified with units/context.
Teaching Note: The independent variable is what you change/measure as the cause; the dependent variable is what you measure as the effect.
3. Explain why it is important to conduct a pilot study before the main data collection. [2]
Answer:
- To test if the data collection methods/equipment work effectively. (1)
- To identify and fix problems (e.g., unclear recording sheets, faulty equipment, unsafe sites) before the main study. (1)
Marking Note: Any two valid reasons. Accept: "check feasibility", "practice using equipment", "refine methodology", "estimate time needed".
Teaching Note: A pilot study is a small-scale trial run. It saves time and improves data quality by catching issues early.
4. (a) Name the data collection method used. [1]
Answer: Field measurement / Direct measurement / Primary data collection using instruments.
Marking Note: Accept "field measurement" or "direct observation with instruments".
Teaching Note: Students are using instruments (sound meter) to measure noise directly at the site — this is primary data collection through field measurement.
(b) State one advantage and one limitation of this method. [2]
Answer:
Advantage: Data is accurate / reliable / first-hand / specific to the exact location and time.
Limitation: Time-consuming / only shows conditions at that moment (not representative of whole day) / weather can affect readings / human error in reading instruments.
Marking Note: 1 mark each. Must be specific to field measurement.
Teaching Note: Primary data is tailored to the investigation but limited by time, weather, and sample size.
5. Calculate the mean wind speed. Show your working. [2]
Working:
Sum = 12 + 8 + 15 + 10 + 5 = 50 km/h
Number of readings = 5
Mean = 50 ÷ 5 = 10 km/h
Answer: 10 km/h
Marking Note: 1 mark for correct working (sum and division), 1 mark for correct answer with unit.
Teaching Note: Mean = Sum of all values ÷ Number of values. Always include units in the final answer.
Section B: Data Collection Techniques & Equipment (10 marks)
6. Match each fieldwork equipment to its correct use. [3]
Answer:
- Anemometer → B. Measuring wind speed
- Lux meter → A. Measuring light intensity
- Infrared thermometer → C. Measuring surface temperature
- Soil pH meter → D. Measuring soil acidity/alkalinity
Marking Note: 1 mark per correct match (3 marks total).
Teaching Note: Know the key instruments: anemometer (wind), lux meter (light), infrared thermometer (surface temp), soil pH meter (soil pH), hygrometer (humidity), rain gauge (rainfall).
7. (a) Name the equipment used to measure infiltration rate. [1]
Answer: Infiltration ring / Infiltrometer / Double-ring infiltrometer.
Marking Note: Accept "infiltration ring" or "infiltrometer".
Teaching Note: An infiltration ring is a metal cylinder hammered into the ground; water is poured in and the rate of drop is measured.
(b) Describe how to use this equipment to collect reliable data. [3]
Answer:
- Hammer the infiltration ring firmly into the ground to a consistent depth (e.g., 5 cm) at each test site. (1)
- Pour a known volume of water into the ring and start the stopwatch. (1)
- Measure the time taken for the water to infiltrate (drop to a certain level) / measure the drop in water level at regular intervals. (1)
Marking Note: 1 mark per step. Must mention: consistent depth, known water volume, timing/measuring drop.
Teaching Note: Reliability comes from controlling variables: same ring depth, same water volume, same measurement method at each site.
8. State two precautions when measuring air temperature using a digital thermometer. [2]
Answer:
- Hold the thermometer in the shade / avoid direct sunlight on the sensor.
- Hold it at a standard height (e.g., 1.2 m above ground) / avoid body heat influencing the reading / wait for reading to stabilise.
Marking Note: 1 mark each. Accept: "don't hold the bulb", "keep away from buildings/heat sources", "calibrate before use".
Teaching Note: Air temperature must be measured in shade, at standard height (Stevenson screen standard), away from heat sources, and allowed to equilibrate.
9. (a) Explain why the student should take multiple quadrat samples. [2]
Answer:
- To get a representative average / reduce the effect of anomalies or unusual patches. (1)
- Vegetation cover varies across the field; one quadrat may not reflect the overall cover. (1)
Marking Note: 1 mark for "representative/reliable average", 1 mark for "variation across area".
Teaching Note: Single samples can be biased. Multiple samples (random or systematic) give a more reliable estimate of the whole area.
(b) Calculate the average percentage vegetation cover. [1]
Working: (80 + 60 + 90 + 70 + 50) ÷ 5 = 350 ÷ 5 = 70%
Answer: 70%
Marking Note: 1 mark for correct answer with % sign.
Teaching Note: Mean = Sum ÷ Count. Always include % for percentage data.
10. State one reason why systematic sampling might be more appropriate than random sampling for a study on how temperature changes from the school building to the field. [1]
Answer: Systematic sampling (e.g., every 10 m along a transect) shows the spatial pattern / gradient / change over distance clearly, which is the focus of the investigation.
Marking Note: 1 mark. Must mention showing pattern/change over distance/transect.
Teaching Note: Systematic sampling along a transect is ideal for studying environmental gradients (e.g., temperature, vegetation change across a zone). Random sampling would miss the spatial pattern.
Section C: Data Presentation, Analysis & Evaluation (10 marks)
11. (a) Name the most appropriate graph to present this data. [1]
Answer: Line graph.
Marking Note: 1 mark. Accept "line graph" only. Bar graph is less suitable for continuous time-series data.
(b) Explain why this graph is suitable. [1]
Answer: It shows changes/trends over time (continuous data) clearly / allows easy identification of peak hours and patterns.
Marking Note: 1 mark. Must mention "change over time" or "trend" or "continuous data".
Teaching Note: Line graphs are for continuous variables (time, distance). Bar graphs are for discrete categories.
12. (a) Describe the relationship shown by the graph. [2]
Answer:
- As vegetation cover increases, surface temperature decreases. (1)
- It is a negative correlation / inverse relationship. (1)
Marking Note: 1 mark for direction (increase → decrease), 1 mark for naming it as negative correlation/inverse.
Teaching Note: Always describe relationships using: "As X increases, Y increases/decreases" and name the correlation type (positive/negative).
(b) Explain this relationship using geographical knowledge. [2]
Answer:
- Vegetation provides shade, reducing direct solar radiation reaching the ground. (1)
- Plants transpire, releasing water vapour which cools the surrounding air through latent heat loss. (1)
Marking Note: 1 mark for shading, 1 mark for transpiration/evapotranspiration cooling.
Teaching Note: Two key cooling mechanisms: (1) Shade blocks shortwave radiation; (2) Transpiration uses latent heat, lowering surface and air temperature.
13. Evaluate the conclusion. State one strength and one limitation. [2]
Answer:
Strength: The conclusion is supported by the fieldwork data (graph shows negative correlation).
Limitation: Correlation does not prove causation / other factors (e.g., building shade, wind, surface material) may also affect temperature / "definitely" is too certain / small sample size / only one time of day.
Marking Note: 1 mark for strength (data-supported), 1 mark for valid limitation (causation, certainty, other factors, sample).
Teaching Note: Good evaluation acknowledges what the data shows AND what it cannot prove. Avoid absolute words like "definitely" in conclusions.
14. (a) Plot the data on the scatter graph. [2]
Answer: Three points plotted accurately at: (20, 15), (50, 25), (80, 35).
Marking Note: 1 mark per correctly plotted point (2 marks for all 3 correct; 1 mark for 1–2 correct). Points must be visible (cross or dot).
Teaching Note: Plot x (vegetation) on horizontal axis, y (soil moisture) on vertical axis. Use a sharp pencil; mark as small crosses.
(b) Draw a line of best fit and describe the trend. [2]
Answer:
- Line of best fit: Straight line passing through or near all three points, showing upward trend.
- Trend: Positive correlation — as vegetation cover increases, soil moisture increases.
Marking Note: 1 mark for reasonable line of best fit (straight, balanced points), 1 mark for "positive correlation" or "as vegetation increases, soil moisture increases".
Teaching Note: Line of best fit should have roughly equal points above/below. Describe trend using both variables.
15. State two ways to improve reliability of fieldwork data collection. [2]
Answer:
- Take repeated measurements at each site and calculate the average.
- Use calibrated / well-maintained equipment / standardised methods across all sites / same time of day / same observers.
Marking Note: 1 mark each. Accept: larger sample size, consistent technique, multiple observers, pilot study.
Teaching Note: Reliability = consistency. Repeat measurements, control variables, use good equipment, standardise procedures.
16. (a) Explain what a choropleth map shows. [1]
Answer: It uses different shades/colours to show variations in data values across defined areas/regions (e.g., noise levels in different zones).
Marking Note: 1 mark. Must mention shading/colour and areas/regions.
Teaching Note: Choropleth maps = shaded areas representing data ranges. Good for showing spatial patterns of density/rate/intensity.
(b) State one advantage of using a choropleth map for this data. [1]
Answer: Easy to see spatial patterns / hotspots / variations across the school area at a glance.
Marking Note: 1 mark. Accept: "visual comparison", "identify noisiest/quietest zones", "shows distribution".
Teaching Note: Choropleth maps excel at revealing geographic patterns — where values are high/low spatially.
17. State two questions to ask when evaluating validity of conclusions. [2]
Answer:
- Does the data actually answer the original geographical question / test the hypothesis?
- Were the methods and equipment appropriate for measuring what we intended to measure?
Marking Note: 1 mark each. Accept: "Is the sample representative?", "Are there confounding variables?", "Could other factors explain the results?", "Was the data collected at the right time/place?"
Teaching Note: Validity = "Did we measure what we set out to measure, and does the conclusion follow from the evidence?"
18. Identify one missing element for a stronger geographical conclusion. [1]
Answer: Geographical explanation / reasoning (e.g., explaining why vegetation reduces temperature using concepts like shade and transpiration) / Reference to specific data values from the graph / Limitations of the study.
Marking Note: 1 mark. Must identify a missing component: explanation, evidence, or evaluation.
Teaching Note: A strong geographical conclusion: (1) States if hypothesis supported, (2) Cites specific data, (3) Explains using geographical concepts, (4) Acknowledges limitations.
19. (a) What term describes this type of error? [1]
Answer: Anomaly / Outlier / Recording error / Human error.
Marking Note: 1 mark. "Anomaly" or "outlier" preferred.
Teaching Note: An anomaly is a value that doesn't fit the pattern, often due to measurement or recording mistakes.
(b) State one way to identify such errors during data checking. [1]
Answer: Check for values that are extremely different from the rest / do not fit the pattern / compare with other groups' data / repeat the measurement.
Marking Note: 1 mark. Must describe a checking strategy.
Teaching Note: Spot anomalies by: comparing repeats, checking against expected range, comparing with peers, visual inspection of graphs.
20. State two ethical guidelines for fieldwork in a public park. [2]
Answer:
- Do not damage plants, wildlife, or park property / leave no litter / take only measurements.
- Respect other park users — do not block paths, ask permission if interviewing, keep noise down.
Marking Note: 1 mark each. Accept: "get permission if needed", "follow park rules", "stay safe", "don't disturb animals", "return equipment".
Teaching Note: Ethical fieldwork: minimise environmental impact, respect people, follow laws/rules, ensure safety, be honest in reporting.
End of Answer Key
Free quiz and exam paper access
Enter your details to view this paper
Your access is remembered on this device.