AI Generated Quiz
Secondary 1 Geography Fieldwork Quiz
Free Sec 1 Geography Fieldwork quiz, Kimi2.6 AI version, with questions, answers, and syllabus-aligned practice for Singapore students.
These static practice materials are generated from the site's syllabus and paper-generation workflow, with source and model context shown so students and parents can evaluate the material before use.
Questions
Secondary 1 Geography Quiz - Fieldwork
Name: _________________________________ Class: ______________ Date: ______________
Score: ______ / 40 marks
Duration: 35 minutes
Instructions: Answer all questions. Write your answers in the spaces provided. Marks are shown in brackets [ ]. Read each question carefully before answering.
Section A: Fieldwork Skills and Methods [10 marks]
Questions 1–5
1. State two reasons why geographers carry out fieldwork rather than only studying maps and textbooks in the classroom.
_________________________________________________________________ [2]
2. A group of Secondary 1 students plan to investigate water quality at different points along a river. Identify one piece of equipment they would need to measure the temperature of the river water, and state one reason why temperature is an important variable to measure.
Equipment: _________________________________________________________
Reason: ___________________________________________________________
_________________________________________________________________ [2]
3. The students collect water samples at three sites: Site A (near the river source in a forested area), Site B (near a construction site), and Site C (near a residential area with a drain outflow).
(a) Predict which site would most likely have the highest turbidity (cloudiness). Explain your answer.
_________________________________________________________________ [2]
(b) Apart from turbidity and temperature, name one other water quality indicator the students could measure in the field.
_________________________________________________________________ [1]
4. Explain why it is important for students to repeat their measurements at least three times at each site during fieldwork.
_________________________________________________________________ [2]
5. Before starting fieldwork, students write a hypothesis. Define what a hypothesis is in the context of geographical investigation.
_________________________________________________________________ [1]
Section B: Data Collection and Presentation [10 marks]
Questions 6–10
6. A student collected the following data on river width and depth during fieldwork:
| Site | River Width (m) | Maximum Depth (cm) |
|---|---|---|
| 1 | 3.2 | 45 |
| 2 | 5.8 | 72 |
| 3 | 8.4 | 95 |
(a) Calculate the cross-sectional area of the river at Site 2, assuming a roughly rectangular shape. Show your working. Round your answer to one decimal place.
_________________________________________________________________ [2]
(b) Describe the relationship between river width and depth shown in the data.
_________________________________________________________________ [2]
7. Students collected data on the types of litter found along a 100-metre stretch of beach. Their results were: plastic bottles (42), food wrappers (28), plastic bags (15), metal cans (10), other items (5).
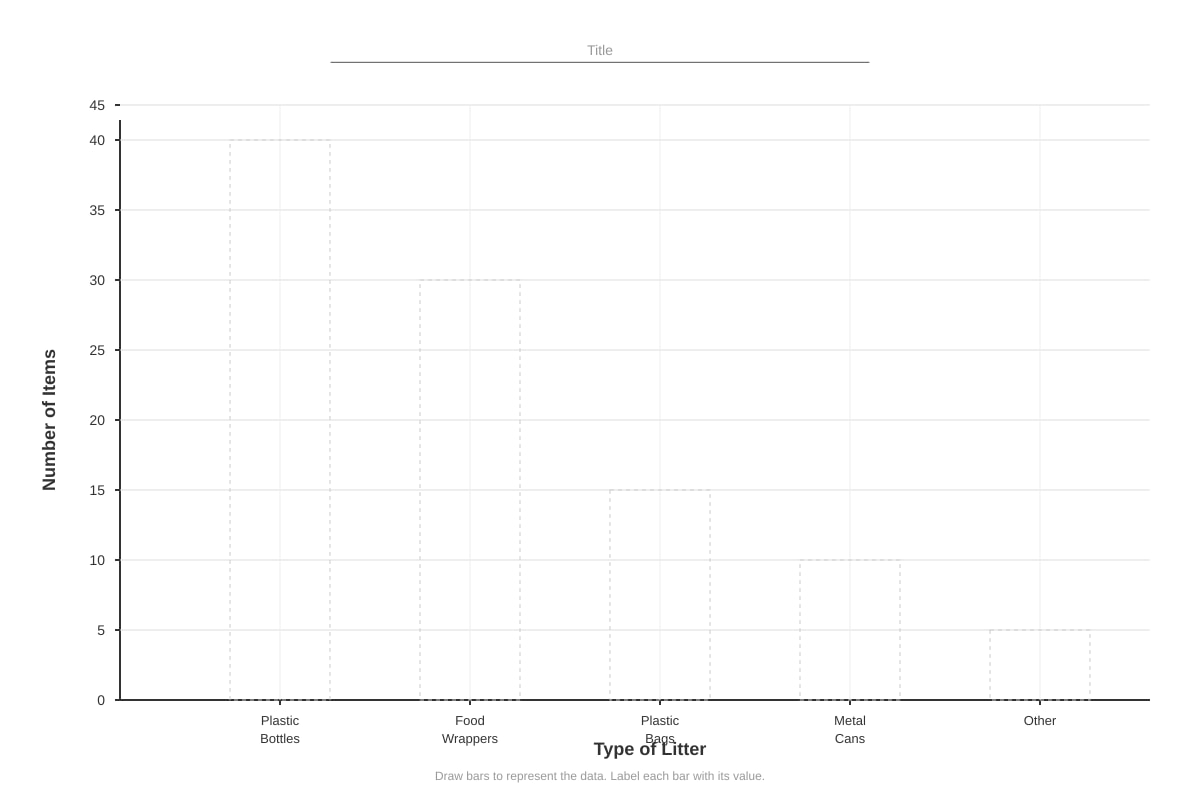
Generated graph for Q7.
Choose and draw a suitable graph to present this data in the space above or describe what suitable graph you would draw. Label all axes and give your graph a title. [3]
8. During a traffic count survey, two students count vehicles passing a point for 10 minutes. Student A counts 47 vehicles. Student B counts 52 vehicles.
(a) Calculate the mean (average) number of vehicles per minute based on both students' counts. Show your working and round to one decimal place.
_________________________________________________________________ [2]
(b) Suggest one reason why the two students obtained different counts, and explain how this affects the reliability of the data.
_________________________________________________________________ [2]
9. A group of students measures the pH of water at five sites along a stream using universal indicator paper. Their results are: pH 6.8, pH 7.2, pH 7.0, pH 3.5, pH 7.1.
One result is identified as an anomaly.
(a) Identify which result is the anomaly.
_________________________________________________________________ [1]
(b) Explain what students should do when they find an anomalous result during fieldwork.
_________________________________________________________________ [2]
10. Name one method of presenting qualitative data collected during fieldwork, other than a graph or table.
_________________________________________________________________ [1]
Section C: Fieldwork Analysis and Evaluation [10 marks]
Questions 11–15
11. Students conducted a questionnaire survey about recycling habits in their neighbourhood. They interviewed 20 people outside a supermarket on a Tuesday morning.
(a) Identify two weaknesses in their sampling method that could make their results unrepresentative.
_________________________________________________________________ [2]
(b) Suggest two ways they could improve their sampling method to obtain more representative data.
_________________________________________________________________ [2]
12. The table below shows temperature readings taken by students at different times of day:
| Time | Temperature (°C) |
|---|---|
| 07:00 | 24.5 |
| 10:00 | 28.3 |
| 13:00 | 32.1 |
| 16:00 | 30.8 |
| 19:00 | 27.6 |
Describe the pattern shown in the data and suggest one geographical explanation for this pattern.
_________________________________________________________________ [3]
13. After collecting fieldwork data, students need to write a conclusion. Explain what a conclusion should do in a geographical investigation.
_________________________________________________________________ [2]
14. Students measured the angle of slope at five points along a transect using a clinometer. Their readings were: 5°, 8°, 12°, 15°, 3°.
Describe how the angle of slope changes along the transect and suggest what this tells us about the shape of the land.
_________________________________________________________________ [2]
15. A student group concludes that "Building more recycling bins will definitely reduce littering in HDB estates" based on their one-day fieldwork study in a single estate.
Evaluate this conclusion. Is it fully supported by their evidence? Justify your answer.
_________________________________________________________________ [3]
Section D: Applying Fieldwork Concepts [10 marks]
Questions 16–20
16. Students want to investigate whether there is a relationship between distance from the MRT station and footfall (number of pedestrians) along a shopping street in Tampines.
(a) State the independent variable in this investigation.
_________________________________________________________________ [1]
(b) State the dependent variable in this investigation.
_________________________________________________________________ [1]
(c) Describe one method the students could use to collect data on footfall at different points along the street.
_________________________________________________________________ [2]
17. During a weather fieldwork exercise, students record these observations: clouds are dark grey and thick, wind speed increases, air pressure drops, temperature falls.
(a) Predict what type of weather is likely to occur. Explain your reasoning.
_________________________________________________________________ [2]
(b) Suggest one limitation of using only one day of weather observations to draw conclusions about the local climate.
_________________________________________________________________ [1]
18. A class investigates the impact of tourism at a local park by using environmental quality surveys. They score different locations from 1 (poor) to 5 (excellent) for factors including litter, noise, and vegetation condition.
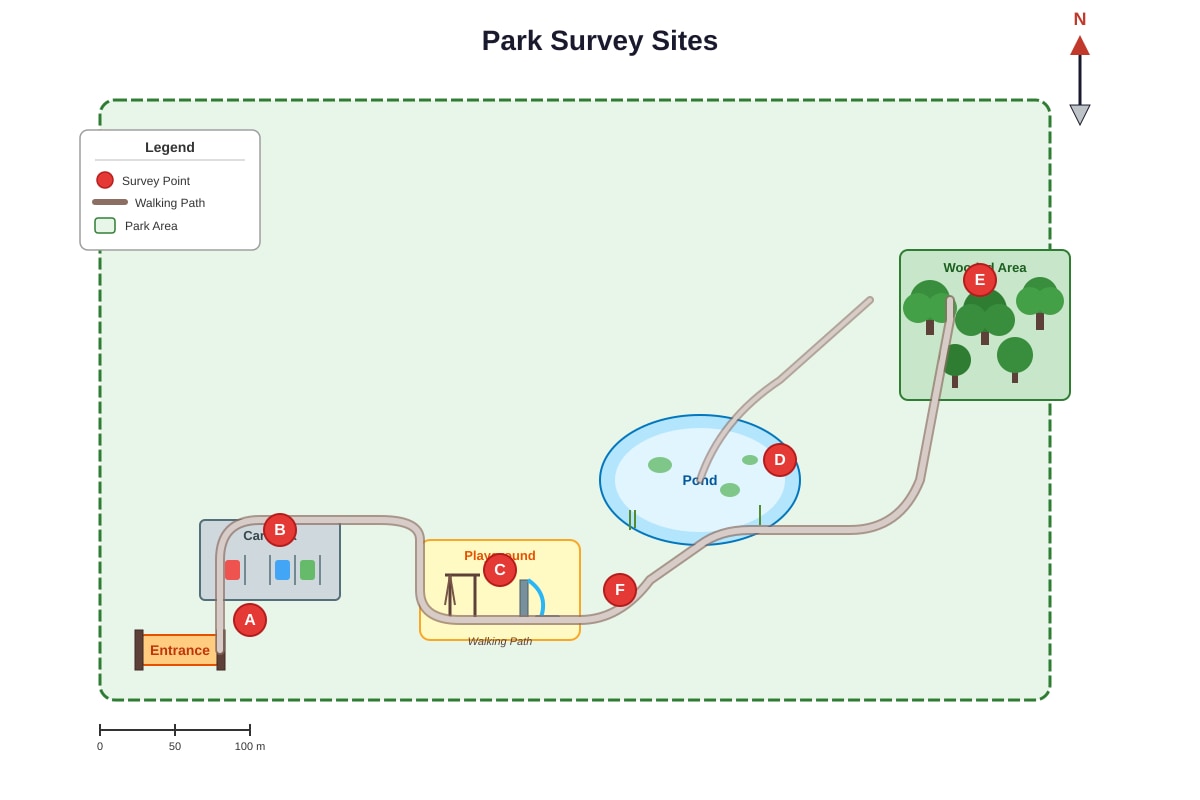
Generated diagram for Q18.
Using the map above, explain why it would be important to choose survey sites at different locations (such as near the playground and in the wooded area) rather than only surveying near the entrance.
_________________________________________________________________ [3]
19. Students are planning a fieldwork investigation to compare microclimates (the climate of a small, specific area) in their school grounds. They plan to measure temperature, humidity, and wind speed in three locations: an open field, under a large tree, and beside the school building.
(a) Suggest one hypothesis they could test in this investigation.
_________________________________________________________________ [2]
(b) Identify two variables they must keep constant (control) to make this a fair comparison.
_________________________________________________________________ [2]
20. Reflecting on a completed fieldwork project about water conservation in their neighbourhood, students are asked to suggest how their findings could be used to improve local water management.
(a) Explain why it is important to share fieldwork findings with the local community or relevant authorities.
_________________________________________________________________ [2]
(b) Suggest one specific action that could be taken by the town council based on the students' findings about water wastage from leaking taps in public areas.
_________________________________________________________________ [1]
END OF QUIZ
[Total: 40 marks]
Answers
Secondary 1 Geography Quiz - Fieldwork: ANSWER KEY
Total Marks: 40
Section A: Fieldwork Skills and Methods
1. [2 marks]
Answer: Any two from:
- Fieldwork allows geographers to collect primary data (data collected firsthand) rather than only using secondary data from books/maps [1]
- It enables study of real, current conditions in the local environment rather than outdated or generalised information [1]
- Students can test hypotheses and see geographical concepts in action [1]
- It develops practical skills in using equipment and working scientifically [1]
- Allows observation of actual human-environment interactions and spatial patterns [1]
Teaching note: Primary data is data you collect yourself; secondary data comes from existing sources. Fieldwork's value is in direct observation and measurement of real places.
2. [2 marks]
Answer:
- Equipment: thermometer (or temperature probe/data logger) [1]
- Reason: Temperature affects dissolved oxygen levels (warmer water holds less oxygen, affecting aquatic life) [1] OR temperature indicates possible thermal pollution from human activities [1] OR different organisms survive in different temperature ranges [1]
Teaching note: Water temperature is a key water quality indicator. Most aquatic organisms need specific temperature ranges. Human activities like construction or industry can warm water through runoff.
3. [3 marks total]
(a) [2 marks]
Answer: Site B (near construction site) [1]. Construction activities disturb soil and release sediment into water, increasing turbidity [1]. OR Site C [1] if well-reasoned: residential drain outflow may carry suspended solids [1].
(b) [1 mark]
Answer: Any one from: pH / dissolved oxygen / nitrate levels / phosphate levels / biological oxygen demand (BOD) / conductivity
Teaching note: Turbidity measures water clarity. Construction sites typically produce the highest sediment load. Multiple indicators give a fuller picture of water health.
4. [2 marks]
Answer:
- Measurements vary due to human error, timing differences, or natural fluctuations in the environment [1]
- Repeating allows checking for consistency and calculating a more reliable average/mean [1]
- Reduces impact of anomalous results or momentary changes in conditions [1]
- Up to 3 marks for two developed points
Teaching note: Replication is a fundamental scientific principle. Three repeats allow identification of outliers and more robust conclusions.
5. [1 mark]
Answer: A testable statement predicting a relationship between variables [1] OR an educated guess about what the investigation will find, based on geographical knowledge [1]
Teaching note: A good hypothesis should be specific, testable, and based on prior knowledge, e.g., "Water quality decreases as distance from the city centre increases."
Section B: Data Collection and Presentation
6. [4 marks total]
(a) [2 marks]
Answer: Cross-sectional area = width × depth (converting to consistent units) [1]
Method: 5.8 m × (72 ÷ 100) m = 5.8 × 0.72 = 4.2 m² (or 4.176 m² → 4.2 m² rounded) [1]
Or using cm: 580 cm × 72 cm = 41,760 cm² / 10,000 = 4.176 ≈ 4.2 m²
Marking: [1] for correct method shown, [1] for correct answer with unit (m²)
(b) [2 marks]
Answer:
- Both width and depth increase downstream [1]
- The relationship is positive/direct: as width increases, depth also increases [1]
- This pattern is typical as rivers gain tributaries and erode their channels downstream [1]
Teaching note: Cross-sectional area matters for calculating discharge (volume of water flowing). River morphology typically changes predictably downstream.
7. [3 marks]
Answer: Students should draw a bar chart (or pie chart, though bar is better for comparison)
Required features for full marks:
- Title: e.g., "Types of Litter Found on 100m Beach Stretch" [1]
- Labeled y-axis: "Number of Items" with linear scale from 0 to at least 45 [0.5]
- Labeled x-axis: Five categories of litter [0.5]
- Bars drawn accurately to correct heights: Plastic bottles (42), Food wrappers (28), Plastic bags (15), Metal cans (10), Other (5) [1]
- Bars should be equal width with gaps between categories [0.5]
Teaching note: Bar charts allow easy comparison between categories. Pie charts show proportions but make small categories hard to read. Always select graphs that communicate your data clearly.
8. [4 marks total]
(a) [2 marks]
Answer: Total vehicles = 47 + 52 = 99 [0.5] Total time = 10 + 10 = 20 minutes [0.5] Mean per minute = 99 ÷ 20 = 5.0 vehicles/minute [0.5 for method, 0.5 for answer] Or: Mean of means = (4.7 + 5.2) ÷ 2 = 5.0 (or 4.95) vehicles/minute [equivalent marking]
Marking: [1] for correct method shown, [1] for correct answer
(b) [2 marks]
Answer:
- Reason: Human error in counting / started/stopped at slightly different times / one student missed some vehicles / distraction occurred [1]
- Effect on reliability: Data becomes less reliable [0.5] because we cannot be certain which count is accurate; increases uncertainty in results [0.5]
- OR if averaged, reliability improves because random errors tend to cancel out [1]
Teaching note: Reliability means consistency. Multiple observers introduce inter-observer variability, but averaging can reduce random errors.
9. [3 marks total]
(a) [1 mark]
Answer: pH 3.5 [1] (All others cluster around pH 7; this is strongly acidic)
(b) [2 marks]
Answer:
- Check the measurement was done correctly ( reused wrong indicator strip, misread colour chart, contaminated sample) [1]
- Repeat the test at that site to confirm [1]
- If confirmed, investigate source of acidity; if error found, discard and use repeated measurement [1]
- Do not simply ignore; determine if it's a true result or error [1]
Teaching note: pH 3.5 indicates acid conditions possibly from industrial discharge or acid rain. The anomaly needs investigation—randomly discarding data is unscientific; so is keeping errors.
10. [1 mark]
Answer: Any one from: photographs / sketch maps / field sketches / annotated diagrams / narrative descriptions / audio recordings / video
Teaching note: Qualitative data captures qualities and characteristics that numbers cannot, such as landscape appearance or people's opinions and experiences.
Section C: Fieldwork Analysis and Evaluation
11. [4 marks total]
(a) [2 marks]
Answer: Any two from:
- Small sample size (20 people is too few to represent a whole neighbourhood) [1]
- Convenience sampling (only people at supermarket, likely shoppers with particular characteristics) [1]
- Specific time bias (Tuesday morning misses working people, students, elderly at different times) [1]
- Location bias (supermarket attracts certain demographic; misses those who shop elsewhere) [1]
- Self-selection bias (those who refused not counted; willing participants may differ) [1]
(b) [2 marks]
Answer: Any two from:
- Increase sample size to at least 100+ for better representation [1]
- Random sampling or systematic sampling (every nth house) to reduce bias [1]
- Stratified sampling ensuring different age groups, housing types, times are represented [1]
- Survey at different times and days including weekends and evenings [1]
- Multiple locations across the neighbourhood [1]
Teaching note: Representative samples mirror population characteristics. The best fieldwork uses systematic random sampling with adequate size and considers where, when, and who.
12. [3 marks]
Answer:
- Pattern: Temperature rises from morning to afternoon, peaking at 13:00 (32.1°C), then falls toward evening [1]
- Shows diurnal (daily) temperature variation [0.5]
- Explanation: The sun's angle of incidence increases through morning, reaching maximum around noon [0.5], heating the ground and air [0.5]
- After noon, sun angle decreases, incoming solar radiation reduces, and heat loss exceeds gain [0.5]
- There is a lag effect: peak temperature occurs after solar noon due to time needed to heat the atmosphere [1]
Marking: [1] for pattern description, [2] for explanation with geographical reasoning
13. [2 marks]
Answer:
- A conclusion should state whether the hypothesis was supported or rejected based on the evidence [1]
- It should summarise the key findings without introducing new data [0.5]
- It should explain the geographical significance of findings, linking back to the original question [0.5]
- May acknowledge limitations and suggest areas for further investigation [0.5]
Teaching note: Conclusions must be evidence-based, not opinion-based. Avoid new information; synthesise what the data actually shows.
14. [2 marks]
Answer:
- Slope angle increases from 5° to 15°, then steeply decreases to 3° [1]
- This suggests a convex slope profile: gentler at bottom, steepest in middle/upper section, then gentling again [0.5]
- Possible landform: valley side or hill slope with varied erosion/transport processes [0.5]
- The peak slope angle (15°) may indicate a break of slope or change in rock type/land use [0.5]
15. [3 marks]
Answer:
- The conclusion is not fully supported [1]
- Problems: causation not proven (correlation ≠ causation) [0.5]; study was only one day [0.5]; only one estate [0.5]; no control comparison with estates that already have more bins; other factors influence littering (education, enforcement, culture) [0.5]
- To improve: longitudinal study over months, multiple estates comparison, before-and-after bin installation measurement [1]
- Better phrasing: "Building more recycling bins may help reduce littering, but further evidence is needed" [0.5]
Marking: [1] for evaluation judgment, [2] for reasoned critique with specific methodological weaknesses
Teaching note: Strong conclusions match evidence scope. Overclaiming is a common student error. Good geographers acknowledge uncertainty and suggest how to strengthen evidence.
Section D: Applying Fieldwork Concepts
16. [4 marks total]
(a) [1 mark]
Answer: Distance from MRT station [1]
(b) [1 mark]
Answer: Footfall (number of pedestrians) [1]
(c) [2 marks]
Answer:
- Systematic pedestrian count: count all people passing a fixed point for set time periods (e.g., 5 minutes) at each measured distance [1]
- Use tally counters or video recording for accuracy [0.5]
- Ensure same time of day (control variable) for fair comparison [0.5]
- Measure distance using tape measure or GPS/phone app [0.5]
Teaching note: Independent variable is what you change; dependent is what you measure. Footfall studies need consistent timing because pedestrian numbers vary hugely by hour.
17. [3 marks total]
(a) [2 marks]
Answer:
- Heavy rain / thunderstorm is likely [1]
- Reasons: dark grey thick clouds = cumulonimbus/nimbus clouds (rain clouds) [0.5]; increasing wind = weather system approaching [0.5]; falling pressure = air mass change, low pressure associated with precipitation [0.5]; falling temperature = cold front passage or evaporative cooling preceding rain [0.5]
(b) [1 mark]
Answer:
- Weather describes short-term conditions; climate requires long-term data (30+ years) [1]
- One day is not representative of typical patterns [0.5]
- Seasonal variation, unusual events, or daily variability could mislead [0.5]
18. [3 marks]
Answer:
- Different locations experience different levels and types of human activity [1]
- Playground area likely has higher noise, more litter, worn vegetation due to concentrated use [0.5]
- Wooded area likely has better environmental quality, less disturbance [0.5]
- Surveying only the entrance would give a biased, unrepresentative picture of the whole park [1]
- Multiple sites allow spatial comparison and identification of impact gradients related to specific facilities [1]
- This is stratified sampling by location type, improving validity of conclusions [0.5]
Visual check for answer: Map should show points A-F across varied micro-environments (active recreation, quiet natural, access/egress, water feature, parking, shade). Answer references this spatial distribution.
19. [4 marks total]
(a) [2 marks]
Answer: Any testable hypothesis linking location to microclimate, e.g.:
- "The temperature under the large tree will be lower than in the open field due to shade and transpiration" [2]
- "Humidity will be highest beside the school building due to reduced evaporation and reduced wind" [2]
- Must be specific (states what, where, and expected direction of difference) [1 if vague]
(b) [2 marks]
Answer: Any two from:
- Time of day (all measurements at same time) [1]
- Duration of measurement (same measurement period at each site) [1]
- Height of instruments (same height above ground) [1]
- Weather conditions (same day, within short time period) [1]
- Season/date [1]
Teaching note: Controls are variables kept constant so that only the independent variable (location) could cause measured differences.
20. [3 marks total]
(a) [2 marks]
Answer:
- Findings can inform decision-makers (town council, PUB) about actual problems [1]
- Increases community awareness and may change behaviour [0.5]
- Validates students' learning and contributes to citizen science [0.5]
- Data from students can supplement official monitoring or identify gaps [0.5]
- Promotes stakeholder engagement and democratic participation in local issues [0.5]
(b) [1 mark]
Answer: Any specific, actionable suggestion:
- Schedule immediate repair of identified leaking taps [1]
- Install drip sensors or water-efficient fixtures in high-wastage areas [1]
- Post efficiency ratings or feedback notices at problem locations [1]
- Adjust maintenance rounds to check public infrastructure more frequently [1]
Teaching note: Fieldwork should have real-world relevance. The best geographical education connects classroom learning to community improvement and sustainable resource management.
END OF ANSWER KEY
Free quiz and exam paper access
Enter your details to view this paper
Your access is remembered on this device.