AI Generated Quiz
Secondary 1 Geography Fieldwork Quiz
Free Sec 1 Geography Fieldwork quiz, HY3 AI version, with questions, answers, and syllabus-aligned practice for Singapore students.
These static practice materials are generated from the site's syllabus and paper-generation workflow, with source and model context shown so students and parents can evaluate the material before use.
Questions
Secondary 1 Geography Quiz - Fieldwork
Name: ___________________________
Class: ________
Date: ____________
Score: _______ / 40
Duration: 45 minutes
Total Marks: 40
Instructions:
- This quiz has 20 questions on the topic of Fieldwork.
- Section A: Multiple Choice (Questions 1–5)
- Section B: Short Structured Questions (Questions 6–13)
- Section C: Data-Based and Extended Response (Questions 14–20)
- Write your answers in the spaces provided.
- Use the figures and tables provided to answer the questions.
Section A: Multiple Choice (1 mark each)
1. What is the main purpose of fieldwork in Geography?
A. To memorise textbook facts
B. To collect first-hand data from the real world
C. To draw maps from the internet
D. To avoid using graphs
____ (1)
2. Which of the following is a primary data collection method used in fieldwork?
A. Reading a Wikipedia article
B. Measuring river temperature with a thermometer
C. Watching a documentary
D. Copying a friend's homework
____ (1)
3. A 4-figure grid reference is used to show:
A. The exact height of a hill
B. The grid square of a feature on a map
C. The population of a town
D. The direction of a river
____ (1)
4. Why should a geography class take water samples at two different sites?
A. To waste time
B. To compare conditions and identify differences
C. Because the teacher said so
D. To fill two bottles
____ (1)
5. Which instrument is most useful for measuring the pH of water during fieldwork?
A. Ruler
B. pH meter or pH paper
C. Compass
D. Stopwatch
____ (1)
Section B: Short Structured Questions (2 marks each unless stated)
6. State two things a student should record in a fieldwork notebook at a study site. (2)
7. Give one reason why fieldwork helps students understand Geography better than only reading a textbook. (2)
8. A class measured the temperature of a stream at Site X and Site Y.
Site X = 26.5°C, Site Y = 24.0°C.
Which site has cooler water? State the value. (2)
9. Explain why wearing a brightly coloured vest is important during outdoor fieldwork near a road. (2)
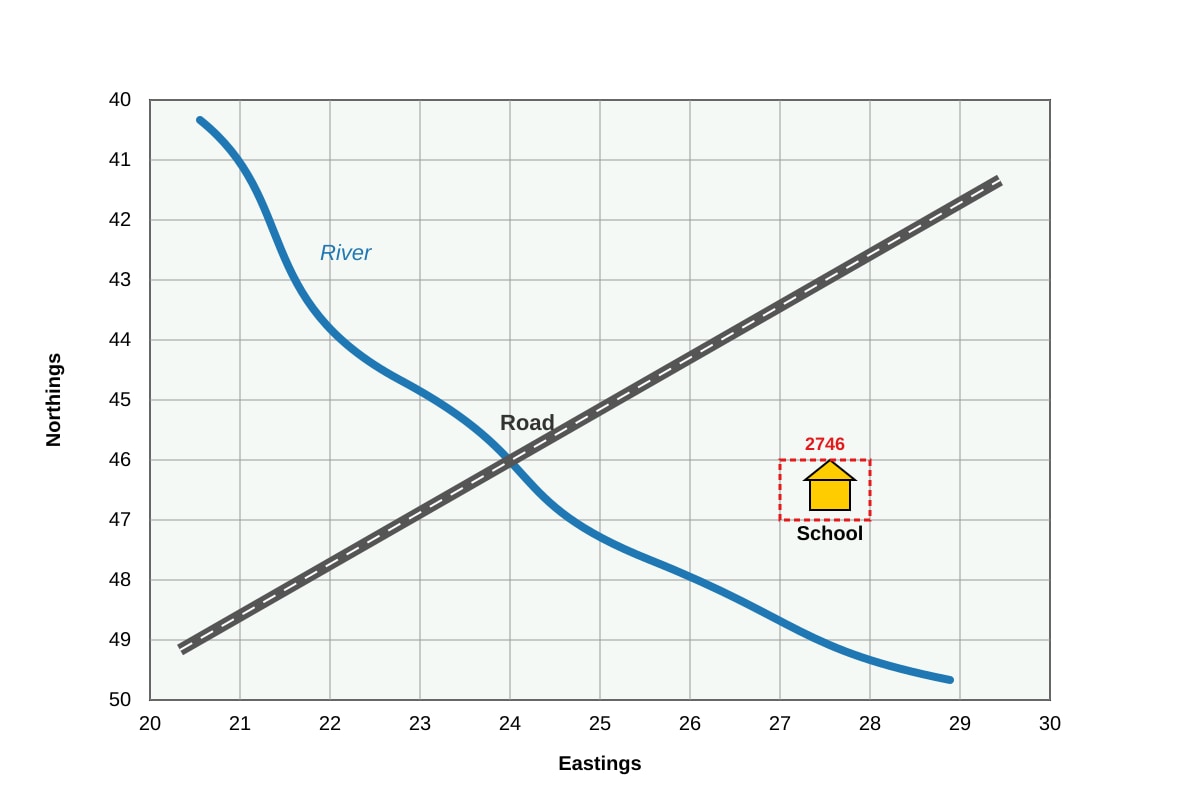
10. State the 4-figure grid reference of the school shown in the map below. (2)
Image pending generation: map for Q10.
Grid reference: ___________ (2)
11. Name one safety precaution to take before doing fieldwork in a forested area in Singapore. (2)
12. A student counts 15 trees in a 10 m × 10 m plot. Calculate the number of trees per 100 m². Show your working. (2)
Working: ________________________________________________
Answer: ___________ trees per 100 m²
13. State two types of data that can be collected using a field sketch. (2)
Section C: Data-Based and Extended Response
14. Study the table below showing water quality at two field sites.
| Site | Temperature (°C) | Dissolved Oxygen (mg/L) | Turbidity (NTU) |
|---|---|---|---|
| A | 25.0 | 7.8 | 2.1 |
| B | 28.5 | 5.2 | 8.6 |
(a) Which site has better water quality? Give one reason using the data. (2)
(b) Suggest one possible human cause for the difference. (2)
(a) _______________________________________________________
(b) _______________________________________________________
15. Describe two steps in planning a fieldwork investigation to compare litter at a park and a school field. (3)
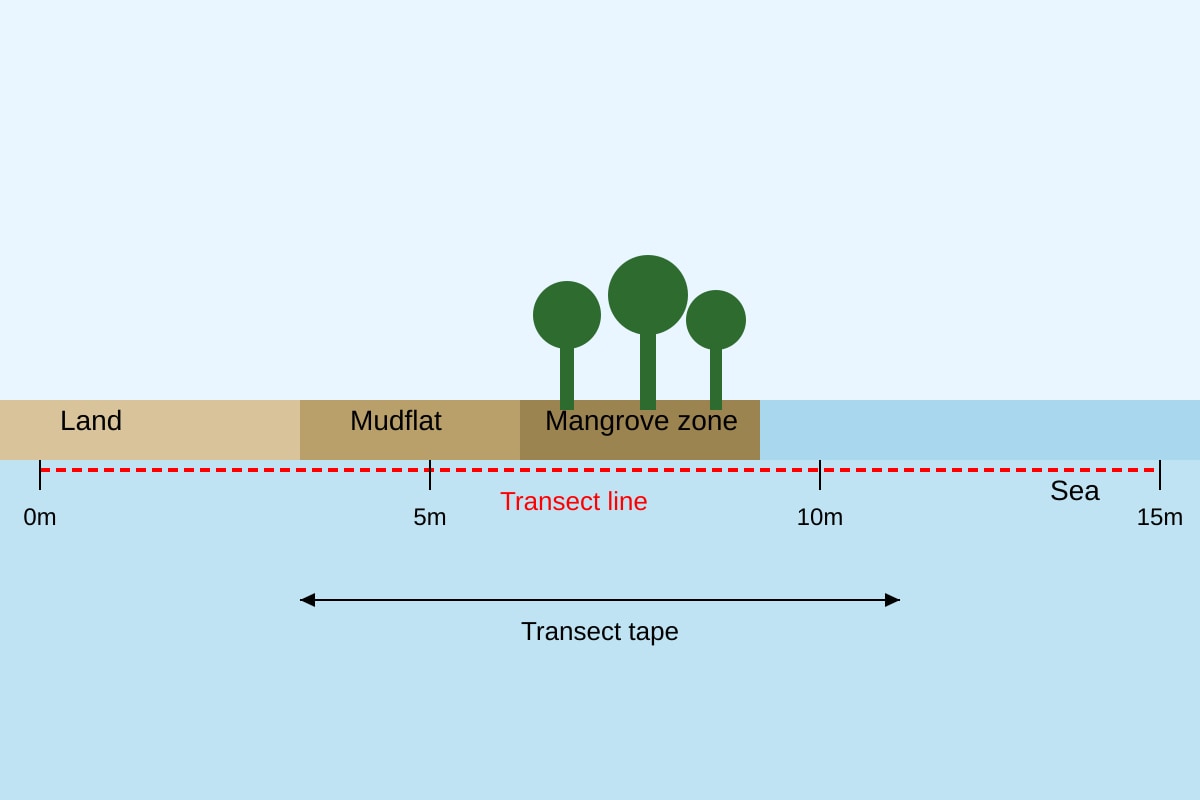
16. A class used a transect line from a mangrove edge to the sea.
Image pending generation: diagram for Q16.
Explain why a transect line is useful in fieldwork. (3)
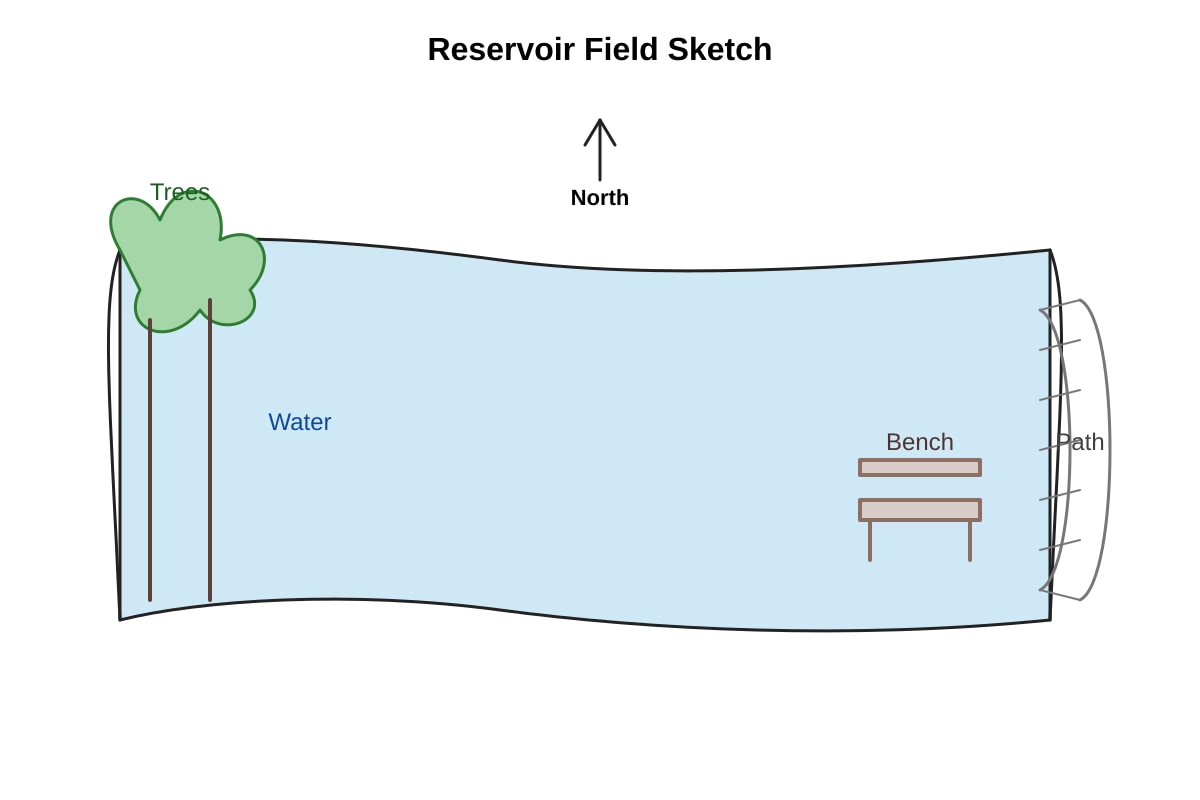
17. Study Figure Q17 below. A student drew this field sketch at a reservoir.
Image pending generation: figure for Q17.
(a) State two features labelled in the field sketch. (2)
(b) Why is a north arrow important in a field sketch? (1)
(a) ______________________ ______________________
(b) ________________________________________________
18. A geography teacher asks students to measure wind speed at a field site using an anemometer.
(a) State one reason why wind speed should be measured more than once. (2)
(b) How can students present the wind speed data clearly? (1)
(a) _______________________________________________________
(b) _______________________________________________________
19. Compare the two sites below using the data. (4)
| Site | Distance from drain (m) | Number of litter items | Noise level (dB) |
|---|---|---|---|
| P | 2 | 24 | 72 |
| Q | 20 | 5 | 55 |
20. A class did fieldwork at Sungei Buloh Wetland Reserve.
(a) Suggest one method they could use to record wildlife seen. (2)
(b) Explain why it is important to follow the reserve's rules during fieldwork. (2)
(a) _______________________________________________________
(b) _______________________________________________________
Answers
Secondary 1 Geography Quiz - Fieldwork: Answer Key
Total Marks: 40
Topic: Fieldwork (Syllabus-first, Stage 4/5 generated; not claimed as past-year derived)
1. B (1 mark)
Teaching note: Fieldwork means going out to the real environment to collect data yourself (primary data). A is wrong because memorising is classroom learning. C and D are not purposes of fieldwork.
2. B (1 mark)
Teaching note: Measuring river temperature with a thermometer is direct, first-hand collection. A, C, D are secondary or not data collection.
3. B (1 mark)
Teaching note: A 4-figure grid reference (e.g., 2746) gives the grid square where a feature is found. Height is from contours; population is from census; direction from compass.
4. B (1 mark)
Teaching note: Taking samples at two sites lets you compare and see differences caused by location or human activity.
5. B (1 mark)
Teaching note: pH paper or a pH meter tests acidity/alkalinity. Ruler measures length; compass direction; stopwatch time.
6. (2 marks)
Accept any two: date/time, weather, location (grid ref), observations, sketches, measurements, names of group members.
(1 mark each, max 2)
Teaching note: A field notebook should record context so data can be understood later.
7. (2 marks)
Sample: Fieldwork lets students see real features and collect their own data, making concepts like water quality easier to understand.
Marking: 1 mark for idea of real experience, 1 mark for link to understanding.
8. (2 marks)
Site Y; 24.0°C. (1 mark each)
Teaching note: Cooler = lower temperature. 24.0 < 26.5 so Site Y is cooler.
9. (2 marks)
Sample: Bright vest makes students visible to vehicles, reducing accident risk.
Marking: 1 mark visibility, 1 mark safety reason.
10. (2 marks)
2746
Teaching note: Read easting (27) first, then northing (46). The school is in square 2746. Common mistake: reversing to 4627.
11. (2 marks)
Sample: Tell a teacher if you see a monitor lizard; wear covered shoes; apply insect repellent. (1 valid precaution = 2 marks, or accept any one full sentence)
12. (2 marks)
Working: 15 trees in 100 m² (10×10) → per 100 m² = 15.
Answer: 15 trees per 100 m².
Teaching note: Plot area = 10 m × 10 m = 100 m², so count is already per 100 m².
13. (2 marks)
Any two: land use, vegetation, buildings, slope, water features. (1 each)
14. (4 marks total)
(a) Site A; higher dissolved oxygen (7.8) and lower turbidity (2.1) show cleaner water. (2 marks: site 1, reason 1)
(b) Site B may be near a construction site or drain with rubbish. (2 marks for plausible human cause)
15. (3 marks)
Two steps: (1) Decide same size area to check at both places; (2) Use a tally sheet to count litter items. (1.5 each, max 3)
Teaching note: Planning makes data fair and comparable.
16. (3 marks)
Transect line lets students record changes in features at regular distances from land to sea; shows zonation of mangroves. (1 mark line use, 2 marks for explaining pattern observation)
17. (3 marks)
(a) Any two labelled: Water, Trees, Path, Bench. (1 each, max 2)
(b) North arrow shows direction so sketch can be read correctly. (1)
18. (3 marks)
(a) Wind varies; repeated measures give a fairer average. (2)
(b) Bar graph or table. (1)
19. (4 marks)
Site P is closer to drain (2 m), has more litter (24), louder (72 dB). Site Q is farther (20 m), less litter (5), quieter (55 dB). Link: nearer drain = more litter and noise. (1 mark each comparison point, max 4)
20. (4 marks)
(a) Checklist with tally of bird species. (2)
(b) Rules protect wildlife and keep students safe. (2)
Free quiz and exam paper access
Enter your details to view this paper
Your access is remembered on this device.