From Real Exams Quiz
Secondary 1 Geography Physical Geography Quiz
Free Sec 1 Geography Physical Geography quiz, Kimi2.6 Exam version, with questions, answers, and syllabus-aligned practice for Singapore students.
These static practice materials are generated from the site's syllabus and paper-generation workflow, with source and model context shown so students and parents can evaluate the material before use.
Questions
Secondary 1 Geography Quiz - Physical Geography
Name: _______________________________
Class: _______________________________
Date: _______________________________
Score: ______ / 40
Duration: 40 minutes
Total Marks: 40
Instructions:
- Answer all questions in the spaces provided.
- For questions requiring diagrams, you may use pencils and rulers.
- Marks are shown in brackets [ ] at the end of each question.
Section A: Landforms and Plate Tectonics (Questions 1–5) [10 marks]
Answer all questions.
1. Name the two main types of tectonic plates found at Earth's surface.
_____________________________________________ [1]
2. State one landform created by volcanic activity at a constructive plate boundary.
_____________________________________________ [1]
3. Explain why earthquakes often occur at destructive plate boundaries.
__________________________________________________________________ [2]
4. The diagram below shows a cross-section of a volcano.
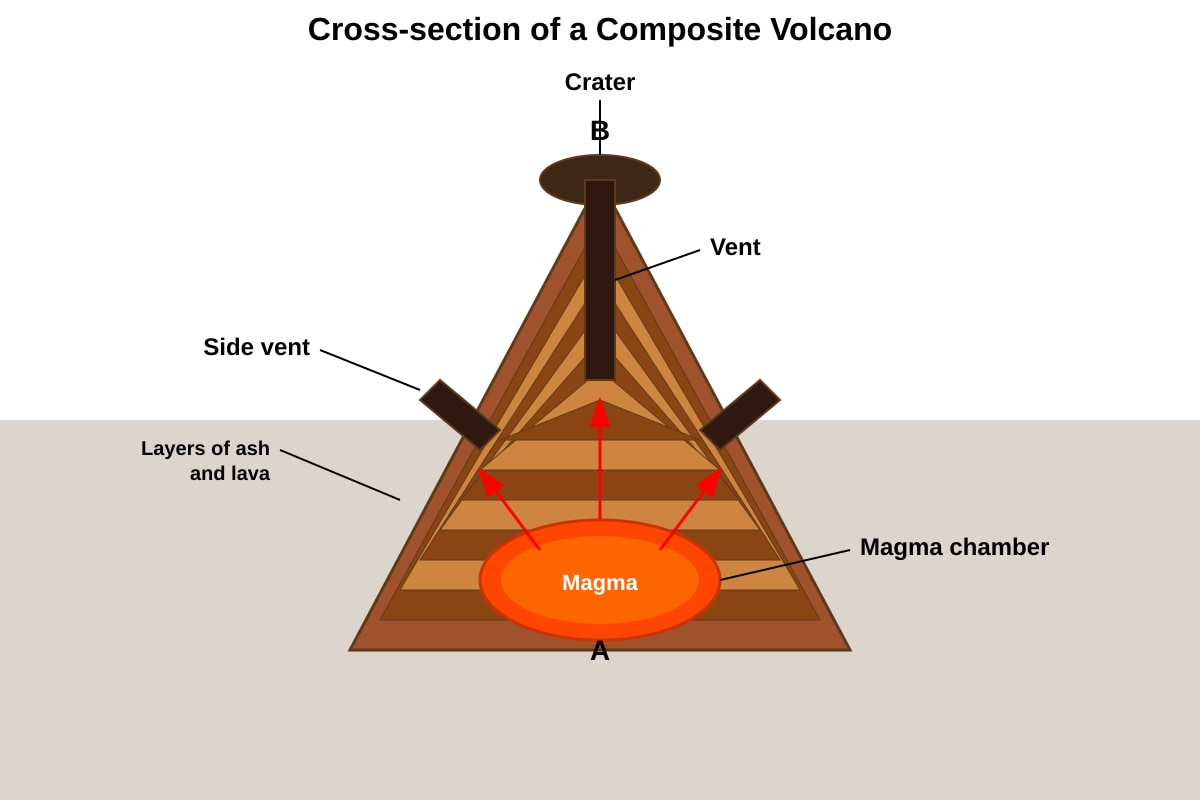
Generated diagram for Q4.
(a) Label features A and B on the diagram above.
- A (below the surface, stores molten rock): _____________________ [1]
- B (opening at the top): _____________________ [1]
(b) Explain why composite volcanoes are typically found at destructive plate boundaries.
__________________________________________________________________ [2]
5. Describe two hazards associated with volcanic eruptions.
__________________________________________________________________ [2]
Section B: Weather and Climate (Questions 6–10) [10 marks]
Answer all questions.
6. State the difference between "weather" and "climate."
__________________________________________________________________ [1]
7. The table below shows monthly temperature data for Singapore.
| Month | Temperature (°C) |
|---|---|
| January | 26.5 |
| February | 27.0 |
| March | 27.5 |
| April | 28.0 |
| May | 28.5 |
| June | 28.5 |
(a) Calculate the mean temperature for the six months shown. Show your working.
__________________________________________________________________ [2]
(b) Explain why Singapore experiences little seasonal variation in temperature.
__________________________________________________________________ [1]
8. Study the climate graph below.
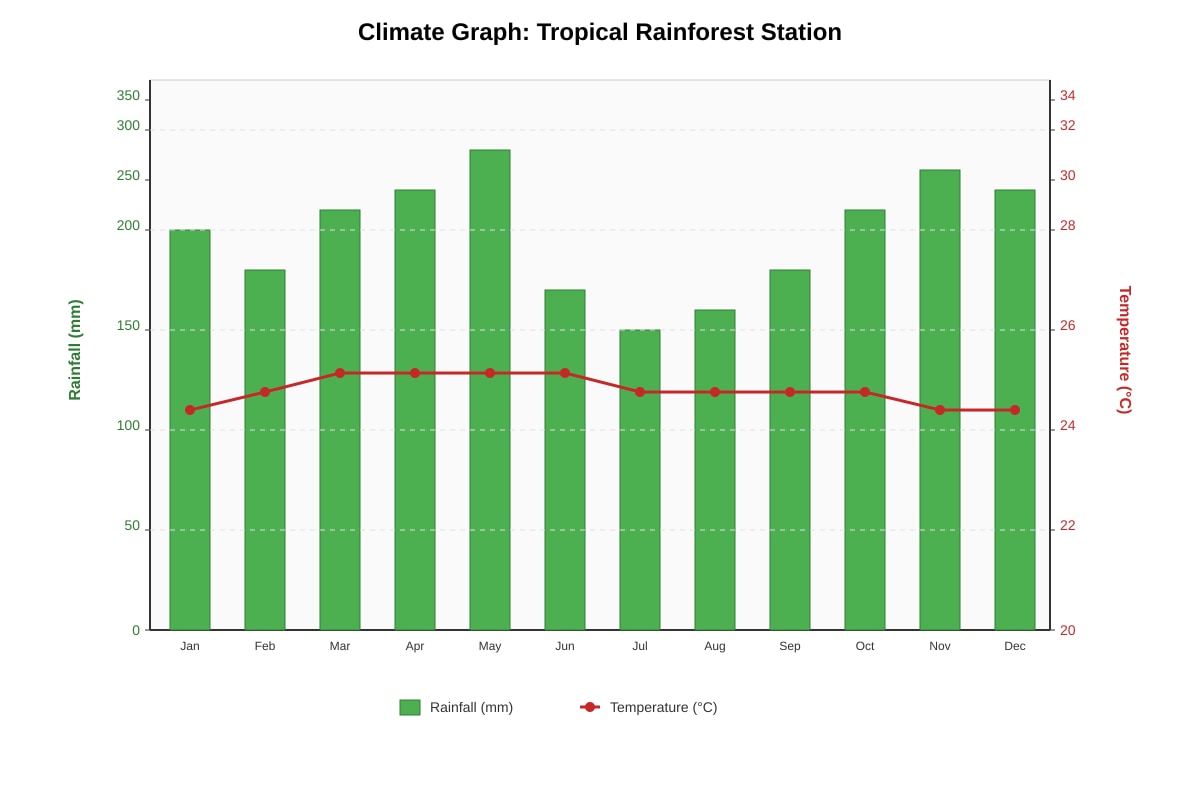
Generated graph for Q8.
(a) Identify the month with the highest rainfall.
__________________________________________________________________ [1]
(b) Describe the pattern of temperature throughout the year.
__________________________________________________________________ [1]
(c) Using evidence from the graph, explain why this location is described as having a tropical rainforest climate.
__________________________________________________________________ [2]
9. Explain how the greenhouse effect helps to keep Earth's surface warm.
__________________________________________________________________ [2]
10. State one natural cause of climate change and one human cause.
- Natural cause: _________________________________ [1]
- Human cause: _________________________________ [1]
Section C: Rivers and Drainage Basins (Questions 11–15) [10 marks]
Answer all questions.
11. Define the term "drainage basin."
__________________________________________________________________ [1]
12. The diagram below shows features of a river valley.
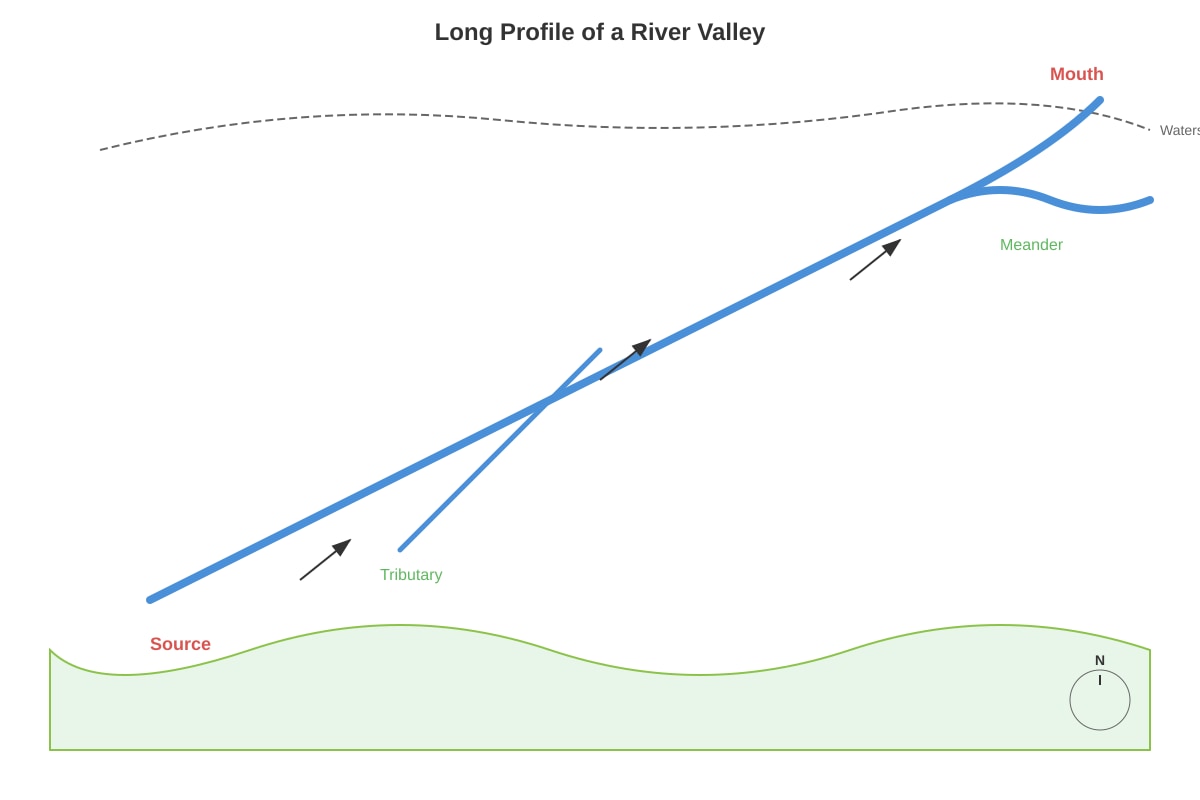
Generated diagram for Q12.
(a) On the diagram, the watershed is labelled as X. Explain what a watershed is.
__________________________________________________________________ [1]
(b) Describe the difference between a tributary and the main river channel.
__________________________________________________________________ [1]
13. Explain why a river flows more quickly in its upper course compared to its lower course.
__________________________________________________________________ [2]
14. Study the table showing water quality data at three river sites.
| Site | pH | Dissolved Oxygen (mg/L) | Temperature (°C) | Turbidity (NTU) |
|---|---|---|---|---|
| A (upper course, forested) | 6.8 | 8.5 | 22 | 5 |
| B (middle course, farmland) | 7.2 | 6.0 | 25 | 35 |
| C (lower course, urban) | 7.5 | 4.5 | 28 | 120 |
(a) Identify which site has the most polluted water. Give a reason for your answer.
__________________________________________________________________ [1]
(b) Suggest one possible source of pollution at Site C.
__________________________________________________________________ [1]
(c) Explain why dissolved oxygen levels are important for river ecosystems.
__________________________________________________________________ [1]
15. Describe how a river transports its load using the process of suspension.
__________________________________________________________________ [2]
Section D: Natural Vegetation and Ecosystems (Questions 16–20) [10 marks]
Answer all questions.
16. State two characteristics of tropical rainforest vegetation that help it survive in hot, wet conditions.
__________________________________________________________________ [2]
17. The photograph below shows vegetation in a tropical rainforest.
Image pending generation: source_image for Q17.
(a) Identify the layer labelled Y (the tallest trees that rise above the main canopy): _____________________ [1]
(b) Explain why very little light reaches the forest floor.
__________________________________________________________________ [1]
18. Describe how plants in the mangrove forest have adapted to survive in salty water and soft mud.
__________________________________________________________________ [2]
19. Explain why tropical rainforests are important for biodiversity conservation.
__________________________________________________________________ [2]
20. Study the data below about forest loss in a Southeast Asian country.
| Year | Forest Area (thousand hectares) | Percentage of Land Covered by Forest |
|---|---|---|
| 1990 | 2,800 | 62% |
| 2000 | 2,400 | 53% |
| 2010 | 1,900 | 42% |
| 2020 | 1,500 | 33% |
(a) Calculate the total forest loss between 1990 and 2020. Show your working.
__________________________________________________________________ [2]
(b) Suggest one reason why governments might find it difficult to stop deforestation.
__________________________________________________________________ [1]
End of Quiz
Answers
Secondary 1 Geography Quiz - Physical Geography: Answer Key
Total Marks: 40
Section A: Landforms and Plate Tectonics (Questions 1–5) [10 marks]
1. Oceanic plates and continental plates. [1]
Teaching note: Oceanic plates are denser and thinner, made mainly of basalt. Continental plates are less dense and thicker, made mainly of granite. At this level, naming the two types is sufficient.
2. Mid-ocean ridge / ridge / volcanic island / seamount [any one] [1]
Teaching note: At constructive boundaries, plates move apart and magma rises to fill the gap, creating new crust. Common answer: mid-ocean ridge (e.g., Mid-Atlantic Ridge).
3. At destructive plate boundaries, one plate is forced beneath another in a process called subduction [1]. This causes intense friction and pressure as the plates grind against each other, leading to earthquakes [1].
Teaching note: The subducting plate melts in the mantle, and this process is not smooth—plates can become "locked" then suddenly release energy. Students should mention subduction and friction/pressure as the cause.
4. (a)
- A: Magma chamber [1]
- B: Crater [1]
Teaching note: The magma chamber is the underground reservoir of molten rock. The crater is the bowl-shaped depression at the summit. Common error: confusing crater with vent (the pipe) or caldera (much larger collapse feature).
(b) Composite volcanoes form at destructive boundaries where an oceanic plate subducts beneath a continental plate [1]. The subducted plate melts, and the magma rises through the continental crust, which is thick and silica-rich. This creates sticky, viscous magma that traps gases and builds up in layers of ash and lava [1].
Teaching note: The key is linking subduction to the creation of viscous, gas-rich magma that builds steep-sided stratovolcanoes. Students may also mention that destructive boundaries create the most explosive eruptions.
5. Any two from:
- Lava flows destroying buildings and farmland [1]
- Ash falls contaminating water supplies and damaging lungs [1]
- Pyroclastic flows (fast-moving hot gas and rock) killing people instantly [1]
- Lahars (volcanic mudflows) causing flooding and destruction [1]
- Volcanic gases (sulfur dioxide) causing acid rain and respiratory problems [1]
[2 marks maximum]
Teaching note: Focus on hazards that directly threaten life and property. Students should be specific—"ash" rather than just "destruction."
Section B: Weather and Climate (Questions 6–10) [10 marks]
6. Weather refers to the atmospheric conditions (temperature, rainfall, wind, humidity) at a specific place and time [1/2]. Climate refers to the average weather conditions over a long period of time, typically 30 years or more [1/2].
Teaching note: The key distinction is time scale: weather = short-term and variable; climate = long-term average. Both parts needed for full mark.
7. (a) Working: (26.5 + 27.0 + 27.5 + 28.0 + 28.5 + 28.5) ÷ 6 [1] = 166 ÷ 6 = 27.7°C (or 27.67°C to 2 d.p.) [1]
Teaching note: Students must show addition and division. Accept 27.7°C (1 d.p.) or 27.67°C. Common error: dividing by 5 instead of 6, or arithmetic mistake.
(b) Singapore is located near the Equator (approximately 1°N) [1/2], so it receives strong, direct sunlight throughout the year with little variation in day length or sun angle [1/2].
Teaching note: The equatorial location means the noon sun is always high in the sky. No significant seasonal tilt effects unlike temperate regions.
8. (a) May (or June) [1]
Teaching note: From the values provided, May shows 320mm which is the highest. June at 250mm is lower. Accept "May" or if student identifies equal highest with June if values rounded, but precise reading shows May highest.
(b) Temperature is relatively constant/stable throughout the year [1], with little variation between months (approximately 26–27°C).
Teaching note: Students should comment on stability/low range, not just give a figure. The temperature line is flat—this is the key pattern.
(c) The graph shows consistently high rainfall every month (all bars above 200mm, most above 250mm) [1], combined with high, stable temperatures throughout the year (always above 25°C) [1]. These are the defining characteristics of a tropical rainforest climate (Af in Köppen classification).
Teaching note: Students must use evidence from both rainfall and temperature. The combination of "high rainfall all year" + "hot all year" = tropical rainforest. Common error: describing only one element.
9. Greenhouse gases (such as carbon dioxide, water vapour, methane) in the atmosphere allow incoming short-wave solar radiation to pass through [1]. They absorb outgoing long-wave infrared radiation from Earth's surface and re-radiate some of this heat back to the surface, warming the planet [1].
Teaching note: The "greenhouse" analogy: glass lets light in but traps heat. Tricky concept: students often think greenhouse gases "trap sun heat directly" rather than absorbing outgoing radiation.
10.
- Natural cause: Volcanic eruptions / changes in solar output / orbital changes (Milankovitch cycles) [1]
- Human cause: Burning fossil fuels / deforestation / industrial agriculture releasing greenhouse gases [1]
Teaching note: Both causes must be clearly separated. "Pollution" is too vague for human cause—specify the mechanism.
Section C: Rivers and Drainage Basins (Questions 11–15) [10 marks]
11. A drainage basin is the area of land drained by a river and its tributaries [1], bounded by a watershed.
Teaching note: The "area of land" and "drained by a river" are essential. Watershed as boundary is bonus but not required for the mark at this level.
12. (a) A watershed is an area of high land (ridge or mountain range) that separates one drainage basin from another [1]. Rain falling on one side flows into one river system; rain on the other side flows into a different river system.
Teaching note: Think of it as "the rim of a bathtub"—water flows away from this high point in different directions.
(b) A tributary is a smaller stream or river that flows into a larger main river channel [1]. The main river channel carries the combined water from all tributaries and flows toward the sea or lake.
Teaching note: Size relationship and directional relationship (tributary → main river) are both important.
13. In the upper course, the river is steeper (has a steeper gradient) [1], and the channel is narrower and rougher with more friction, so water flows faster [1]. In the lower course, the gradient is gentler and the channel is wider and deeper, reducing velocity.
Teaching note: Gradient is the key factor, but channel characteristics also matter. Students may mention that upper courses are closer to the source in upland areas.
14. (a) Site C [1/2] because it has the highest turbidity (120 NTU) and lowest dissolved oxygen (4.5 mg/L), indicating high pollution [1/2].
Teaching note: Any one clear reason from the data is acceptable. Highest turbidity or lowest dissolved oxygen both indicate pollution. pH being most alkaline is also a possible indicator but less direct.
(b) Industrial discharge / sewage from urban areas / litter and waste from high population density / oil or chemical runoff [any one] [1]
Teaching note: Must match "urban" context. Agricultural runoff would apply more to Site B.
(c) Dissolved oxygen is needed by fish and other aquatic organisms for respiration [1]. Low levels cause suffocation and death of aquatic life.
Teaching note: Ecosystem health depends on oxygen availability. Low DO = hypoxia = dead zones.
15. Suspension is when small, light particles of sediment (such as clay and silt) are carried along within the water itself [1], kept aloft by the turbulence and movement of the river water [1].
Teaching note: Contrast with other transport methods: traction (rolling), saltation (bouncing), and solution (dissolved). Suspension requires small particle size and sufficient water energy.
Section D: Natural Vegetation and Ecosystems (Questions 16–20) [10 marks]
16. Any two from:
- Buttress roots to support tall trees in shallow, nutrient-poor soil [1]
- Drip-tips on leaves to shed water quickly and reduce fungal growth [1]
- Broad leaves to capture maximum sunlight in shaded conditions [1]
- Emergent trees growing very tall to reach sunlight [1]
- Epiphytes growing on branches to access light [1]
- Thin bark (no need for protection against cold or fire) [1]
[2 marks maximum]
Teaching note: Characteristics must link to "hot, wet conditions." Root adaptations for support, leaf adaptations for water shedding and light capture are most common.
17. (a) Emergent layer / emergent trees [1]
Teaching note: The tallest trees that break through the main canopy. Must be specific—"tall trees" alone is insufficient.
(b) The main canopy layer is dense with overlapping leaves and branches that blocks most sunlight [1]. Only about 1–2% of light reaches the forest floor.
Teaching note: The canopy acts as a "green roof." This creates the dark, shaded conditions of the forest floor ecosystem.
18. Any two from:
- Prop roots / stilt roots to anchor trees in soft, waterlogged mud [1]
- Pneumatophores (breathing roots) to obtain oxygen in waterlogged soils [1]
- Salt-excreting leaves to remove excess salt [1]
- Vivipary (seeds germinate while still on the tree) to give seedlings a head start in unstable conditions [1]
- Waxy coating on leaves to reduce water loss and salt damage [1]
[2 marks maximum]
Teaching note: Mangroves face three challenges: salt, waterlogging, and unstable mud. Students should connect adaptation to the specific problem it solves.
19. Tropical rainforests contain a very high number of different species (high biodiversity) in a relatively small area [1]. They provide habitat, food, and breeding grounds for many plants and animals found nowhere else on Earth, and this genetic diversity is valuable for medicine, agriculture, and ecosystem resilience [1].
Teaching note: "Biodiversity" = variety of life. Students should explain why conservation matters: unique species, potential resources, ecological functions like pollination and nutrient cycling.
20. (a) Working: 2,800 – 1,500 = 1,300 thousand hectares (or 1,300,000 hectares) [2]
Alternative working acceptable: percentage calculation showing 29 percentage point loss, with final answer clearly stated.
Teaching note: Simple subtraction but unit must be clear. Accept "1,300,000 ha" or "1.3 million ha." Common error: calculating percentage loss incorrectly.
(b) Any one from:
- Economic pressure to clear land for palm oil plantations or agriculture [1]
- Poverty forcing people to use forest resources for survival [1]
- Weak enforcement of environmental laws [1]
- Corruption in land management [1]
- International demand for timber and agricultural products [1]
Teaching note: The question asks why it is difficult to stop deforestation, not simply what causes it. Answers should reference political, economic, or social obstacles to conservation.
End of Answer Key
Free quiz and exam paper access
Enter your details to view this paper
Your access is remembered on this device.