From Real Exams Quiz
Secondary 1 Geography Physical Geography Quiz
Free Sec 1 Geography Physical Geography quiz, Exam version, with questions, answers, and syllabus-aligned practice for Singapore students.
These static practice materials are generated from the site's syllabus and paper-generation workflow, with source and model context shown so students and parents can evaluate the material before use.
Questions
Secondary 1 Geography Quiz - Physical Geography
Name: _________________ Class: _________________ Date: _________________
Score: _____ / 40 marks Duration: 45 minutes
Instructions
- Answer ALL questions in the spaces provided.
- Use the figures and maps provided to support your answers.
- Write clearly and use geographical terminology where appropriate.
Section A: Map Skills and Data Interpretation [15 marks]
Study Figure 1 below, which shows a topographic map of Coastal Region X.
Image pending generation for this question.
1. State the 4-figure grid reference of Settlement A. [1 mark]
Grid reference: ________________
2. What is the contour interval shown on this map? [1 mark]
Contour interval: ________________
3. State the 6-figure grid reference of the lighthouse shown in grid square 2847. [1 mark]
Grid reference: ________________
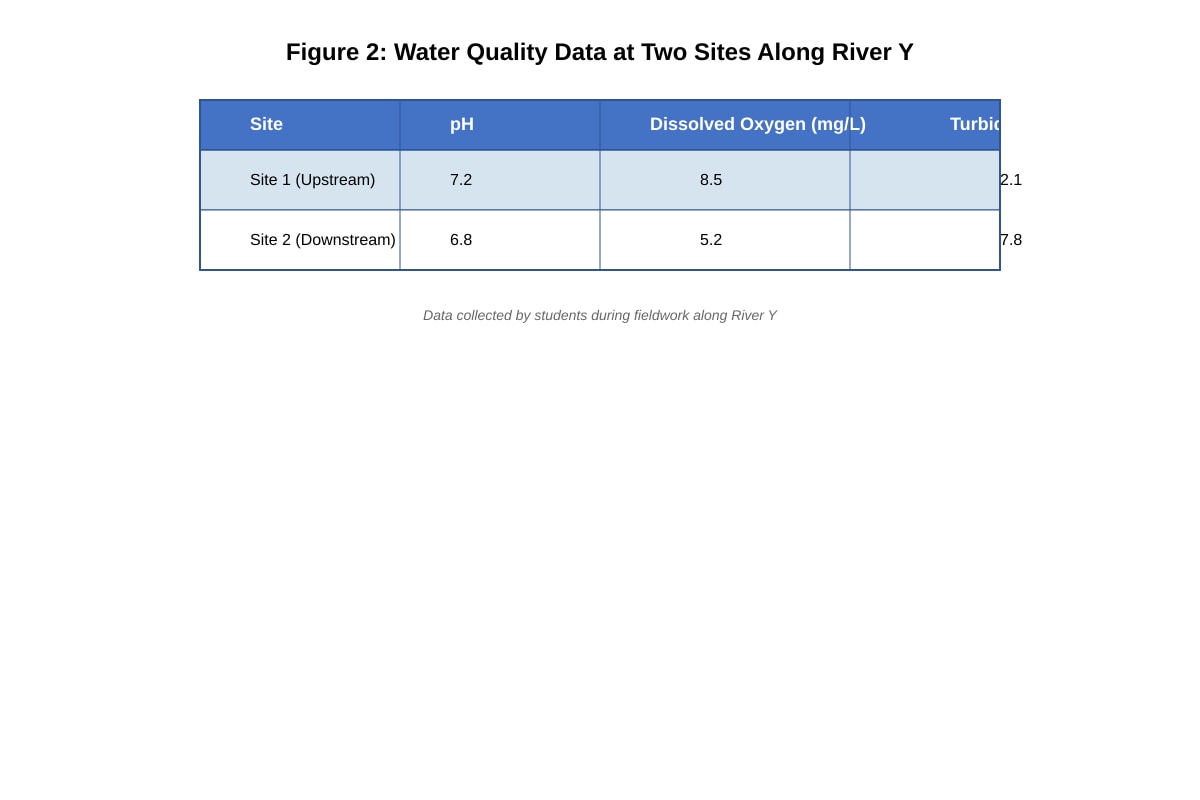
Study Figure 2 below, which shows water quality data collected by students at two sites along River Y.
Generated figure for this question.
| Site | pH | Dissolved Oxygen (mg/L) | Turbidity (NTU) |
|---|---|---|---|
| Site 1 | 7.2 | 8.5 | 2.1 |
| Site 2 | 6.8 | 5.2 | 7.8 |
4. Which site has better water quality? Give two pieces of evidence from Figure 2 to support your answer. [3 marks]
Site: ________________
Evidence 1: ________________________________________________________________
Evidence 2: ________________________________________________________________
5. Explain one reason why Site 2 might have poorer water quality than Site 1. [2 marks]
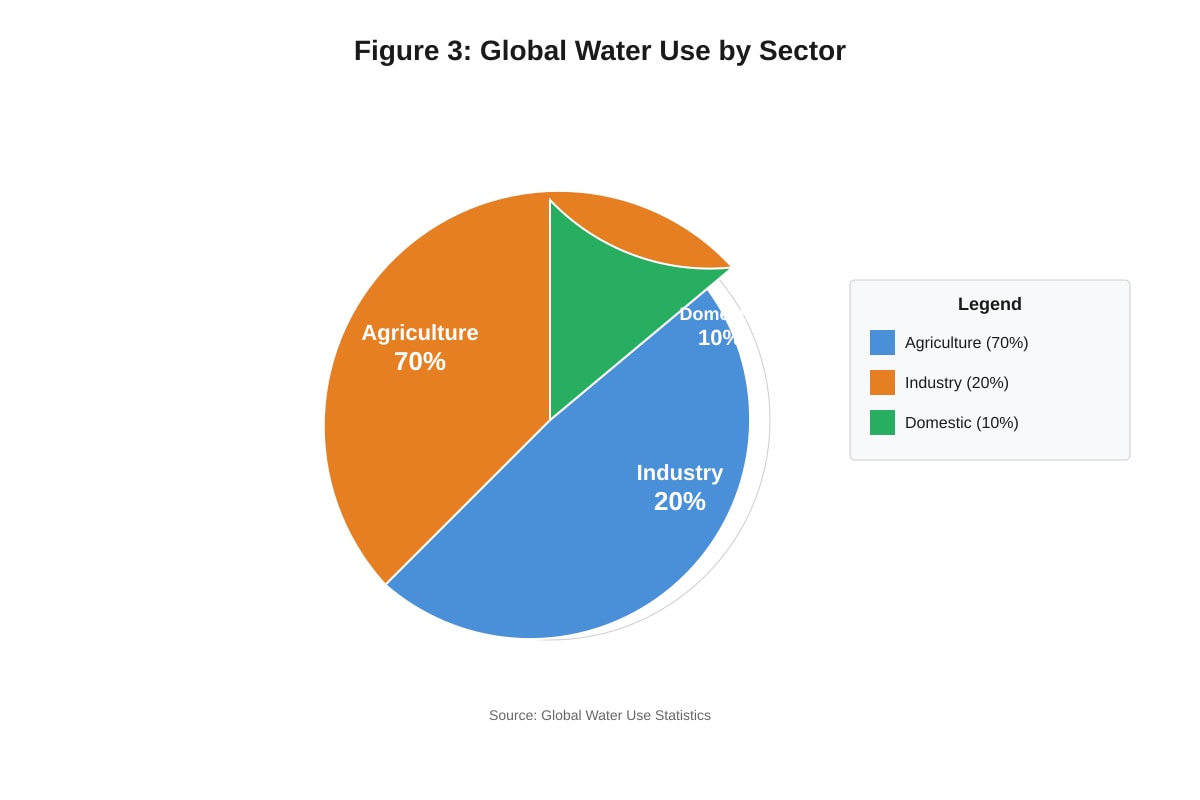
Study Figure 3 below, which shows global water use by sector.
Generated figure for this question.
6. Use evidence from Figure 3 to describe the pattern of global water use. [3 marks]
7. Suggest one reason why agriculture uses the most water globally. [2 marks]
8. Is water a renewable or non-renewable resource? Explain your answer. [2 marks]
Classification: ________________
Explanation: ________________________________________________________________
Section B: Coastal Environments [12 marks]
Study Figure 4 below, which shows the distribution of mangrove forests in Singapore.
Image pending generation for this question.
9. Describe the distribution of mangroves in Singapore as shown in Figure 4. [3 marks]
10. Explain why mangrove forests are usually found in sheltered environments. [2 marks]
11. Describe how mangroves help to prevent coastal erosion. [3 marks]
12. Explain how the roots of mangrove plants are adapted to the coastal environment. [2 marks]
13. State one way that mangroves are important to people. [1 mark]
14. Suggest one threat to mangrove forests from human activities. [1 mark]
Section C: Water Resources [13 marks]
15. Describe three ways people use water. [3 marks]
Way 1: ____________________________________________________________________
Way 2: ____________________________________________________________________
Way 3: ____________________________________________________________________
16. Describe one use of water for industries. [1 mark]
17. Identify one type of water store shown in the hydrological cycle. [1 mark]
Water store: ________________
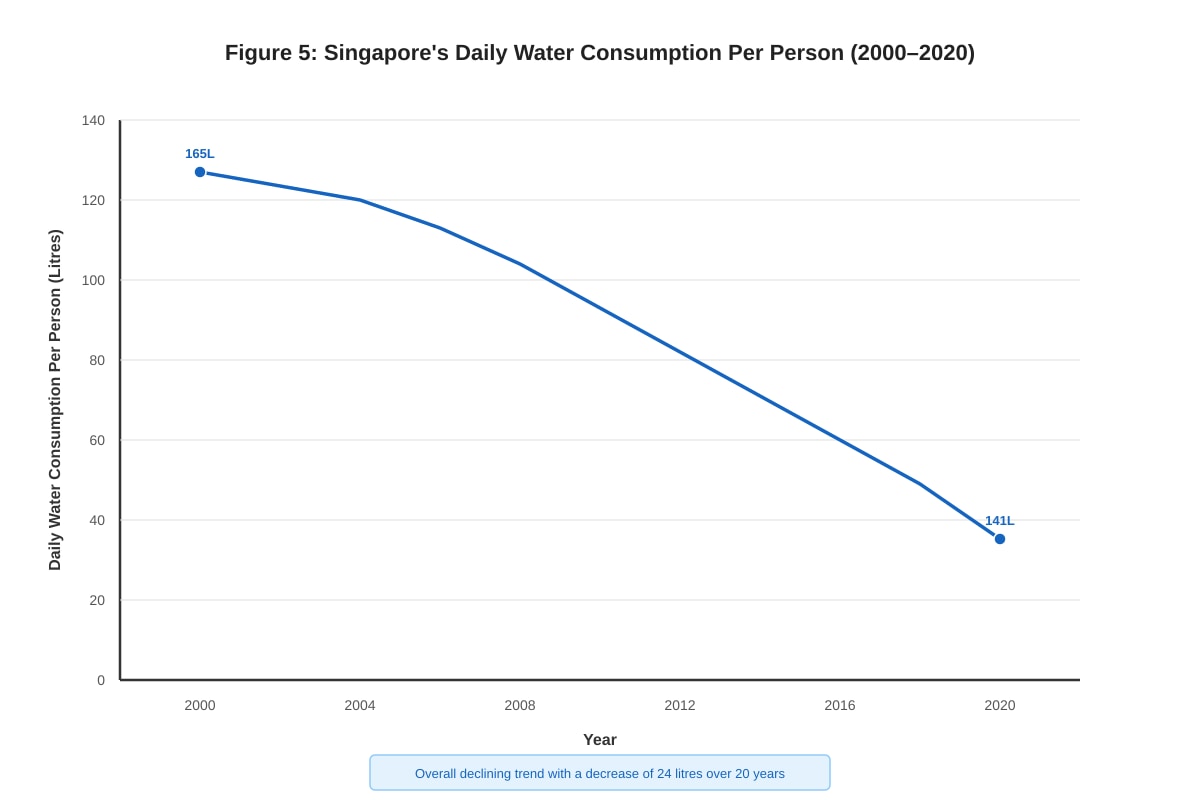
Study Figure 5 below, which shows Singapore's daily water consumption per person from 2000 to 2020.
Generated figure for this question.
18. With reference to Figure 5, describe the changes in Singapore's daily water consumption per person from 2000 to 2020. [3 marks]
19. Suggest two reasons why Singapore's water consumption per person has decreased. [2 marks]
Reason 1: __________________________________________________________________
Reason 2: __________________________________________________________________
20. Explain one strategy Singapore uses to manage its water resources sustainably. [3 marks]
Strategy: __________________________________________________________________
Explanation: ________________________________________________________________
END OF QUIZ
Answers
Secondary 1 Geography Quiz - Physical Geography (Answer Key)
Total Marks: 40 marks
Section A: Map Skills and Data Interpretation [15 marks]
1. State the 4-figure grid reference of Settlement A. [1 mark] Answer: 2847 (or appropriate grid reference based on map) Marking: 1 mark for correct 4-figure reference
2. What is the contour interval shown on this map? [1 mark] Answer: 10m (or 20m depending on map scale) Marking: 1 mark for correct interval with units
3. State the 6-figure grid reference of the lighthouse shown in grid square 2847. [1 mark] Answer: 285475 (accept range 284474 to 286476) Marking: 1 mark for reasonable 6-figure reference within the grid square
4. Which site has better water quality? Give two pieces of evidence from Figure 2 to support your answer. [3 marks] Answer: Site 1 Evidence 1: Higher dissolved oxygen (8.5 mg/L compared to 5.2 mg/L) Evidence 2: Lower turbidity (2.1 NTU compared to 7.8 NTU) Marking: 1 mark for correct site, 1 mark each for two valid pieces of evidence with data
5. Explain one reason why Site 2 might have poorer water quality than Site 1. [2 marks] Sample Answer: Site 2 is downstream and may receive pollution from human activities such as factories or urban runoff, which reduces water quality. Marking: 1 mark for identifying pollution source, 1 mark for explaining impact on water quality
6. Use evidence from Figure 3 to describe the pattern of global water use. [3 marks] Sample Answer: Agriculture uses the most water globally with 70% of total consumption. Industry uses 20% of water, while domestic use accounts for only 10%. This shows that agricultural irrigation dominates global water consumption. Marking: 1 mark each for three points with evidence from the figure
7. Suggest one reason why agriculture uses the most water globally. [2 marks] Sample Answer: Crops require large amounts of water for irrigation to grow, especially in dry regions where rainfall is insufficient for farming. Marking: 1 mark for identifying irrigation need, 1 mark for explanation
8. Is water a renewable or non-renewable resource? Explain your answer. [2 marks] Answer: Renewable. Water is replenished naturally through the hydrological cycle processes such as evaporation and precipitation. Marking: 1 mark for correct classification, 1 mark for explanation mentioning hydrological cycle
Section B: Coastal Environments [12 marks]
9. Describe the distribution of mangroves in Singapore as shown in Figure 4. [3 marks] Sample Answer: Mangroves are found along the coastlines of Singapore, particularly on the northern and eastern shores. They are also located on offshore islands such as Pulau Ubin. Most mangroves grow in sheltered areas away from the open sea. Marking: 1 mark each for three distribution points (coastlines, islands, sheltered locations)
10. Explain why mangrove forests are usually found in sheltered environments. [2 marks] Sample Answer: Mangrove seedlings need calm water conditions to take root and establish themselves. Strong waves and currents would uproot the young plants before they can grow. Marking: 1 mark for mentioning seedling establishment, 1 mark for explaining wave/current threat
11. Describe how mangroves help to prevent coastal erosion. [3 marks] Sample Answer: The dense root systems of mangrove plants trap and stabilize loose sediments on the coast. The sediments are deposited and build up the coastal area. The root networks also reduce wave energy and slow down water flow, preventing erosion. Marking: 1 mark each for sediment trapping, sediment deposition, and wave energy reduction
12. Explain how the roots of mangrove plants are adapted to the coastal environment. [2 marks] Sample Answer: Mangroves have aerial or prop roots that grow above the waterlogged soil to absorb oxygen from the air. These roots also provide stability in the soft, muddy sediment. Marking: 1 mark for aerial roots/oxygen absorption, 1 mark for stability function
13. State one way that mangroves are important to people. [1 mark] Sample Answers: Provide timber/wood; Protect coastlines from erosion; Provide habitat for fish; Tourism/recreation Marking: 1 mark for any valid human use
14. Suggest one threat to mangrove forests from human activities. [1 mark] Sample Answers: Land reclamation; Pollution; Coastal development; Aquaculture Marking: 1 mark for any valid human threat
Section C: Water Resources [13 marks]
15. Describe three ways people use water. [3 marks] Sample Answer: Way 1: Domestic use - for household activities such as showering, washing dishes, and drinking Way 2: Industrial use - for cooling equipment in factories and power generation Way 3: Agricultural use - for irrigation of crops and livestock farming Marking: 1 mark each for three distinct uses with brief description
16. Describe one use of water for industries. [1 mark] Sample Answer: To cool equipment in factories and power plants as they generate heat during operation. Marking: 1 mark for valid industrial use with brief explanation
17. Identify one type of water store shown in the hydrological cycle. [1 mark] Sample Answers: Atmosphere; Ocean/Sea; Groundwater; Ice caps/Glaciers; Rivers/Lakes Marking: 1 mark for any valid water store
18. With reference to Figure 5, describe the changes in Singapore's daily water consumption per person from 2000 to 2020. [3 marks] Sample Answer: Singapore's daily water consumption per person decreased from 165 litres in 2000 to 141 litres in 2020. This represents a reduction of 24 litres per person per day. The decline was gradual and consistent over the 20-year period. Marking: 1 mark for starting value, 1 mark for ending value, 1 mark for describing the trend
19. Suggest two reasons why Singapore's water consumption per person has decreased. [2 marks] Sample Answers: Reason 1: Water conservation campaigns educating people to use water more efficiently Reason 2: Installation of water-saving devices in homes and buildings Marking: 1 mark each for two valid reasons
20. Explain one strategy Singapore uses to manage its water resources sustainably. [3 marks] Sample Answer: Strategy: NEWater (water recycling) Explanation: Singapore treats used water to high standards and reuses it for industrial and indirect potable purposes. This reduces dependence on imported water and makes use of wastewater that would otherwise be discharged, ensuring long-term water security. Marking: 1 mark for naming strategy, 2 marks for detailed explanation of how it supports sustainability
Marking Notes:
- Accept alternative valid answers where appropriate
- Award marks for geographical terminology used correctly
- Partial marks may be awarded for incomplete but correct responses
- Spelling errors should not be penalized unless they change meaning
Free quiz and exam paper access
Enter your details to view this paper
Your access is remembered on this device.