From Real Exams Quiz
Secondary 1 Geography Map Graph Data Skills Quiz
Free Sec 1 Geography Map Graph Data Skills quiz, Nemo3 Exam version, with questions, answers, and syllabus-aligned practice for Singapore students.
These static practice materials are generated from the site's syllabus and paper-generation workflow, with source and model context shown so students and parents can evaluate the material before use.
Questions
Secondary 1 Geography Quiz - Map Graph Data Skills
Name: ________________________
Class: ________________________
Date: ________________________
Score: _____ / 30
Duration: 45 minutes
Total Marks: 30
Instructions:
- Answer all questions.
- Write your answers in the spaces provided.
- For questions requiring grid references, state the 4-figure or 6-figure grid reference as indicated.
- Where calculations are required, show your working clearly.
- The number of marks is given in brackets [ ] at the end of each question or part question.
Section A: Map Skills (12 marks)
Refer to the topographic map extract of Pulau Ubin (Map 1) to answer Questions 1 to 6.
Image pending generation: map for Q1.
-
State the 4-figure grid reference of the Chek Jawa Visitor Centre. [1]
Answer: ________________________
-
State the 6-figure grid reference of the trigonometrical station on Puaka Hill. [1]
Answer: ________________________
-
Using the map scale, calculate the straight-line distance in kilometres between the jetty at the main village (grid square 1424) and the Chek Jawa Visitor Centre. Show your working. [2]
Working: ________________________________________________________________________
Answer: ____________ km
-
The contour lines around Puaka Hill form concentric circles with values 60, 70, 80, 90, and 100 metres.
(a) What is the contour interval of this map? [1]
(b) What is the height of Puaka Hill above sea level? [1]
(c) Describe the slope of the western side of Puaka Hill compared to the eastern side, using evidence from the contour lines. [2](a) Answer: ____________ m
(b) Answer: ____________ m
(c) ________________________________________________________________________
-
Identify the map symbol used to represent mangrove vegetation on the map legend. [1]
Answer: ________________________________________________________________________
-
A student walks from the Sensory Trail (grid square 1622) to Pekan Quarry (grid square 1523) following the main track.
(a) In which general compass direction does the student walk? [1]
(b) Suggest one reason why the track follows a curved path rather than a straight line, based on the relief shown by contour lines. [2](a) Answer: ________________________
(b) ________________________________________________________________________
Section B: Graph and Data Interpretation (10 marks)
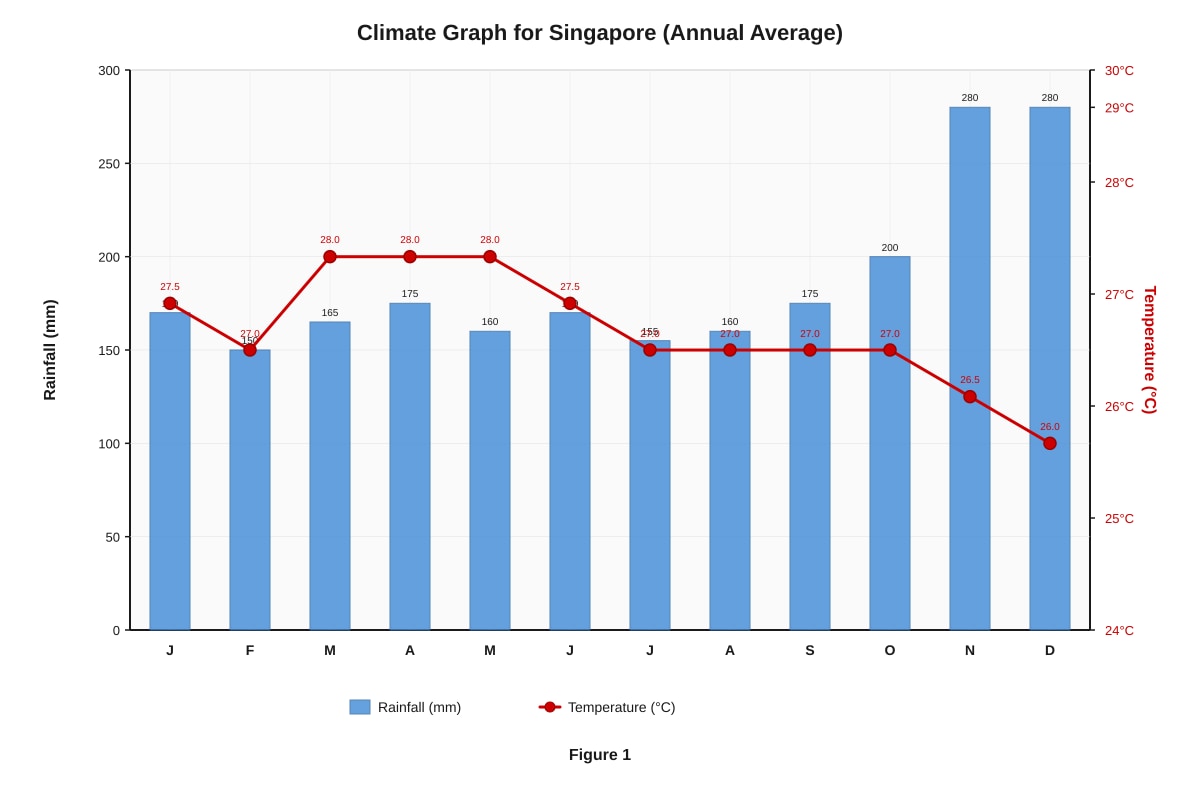
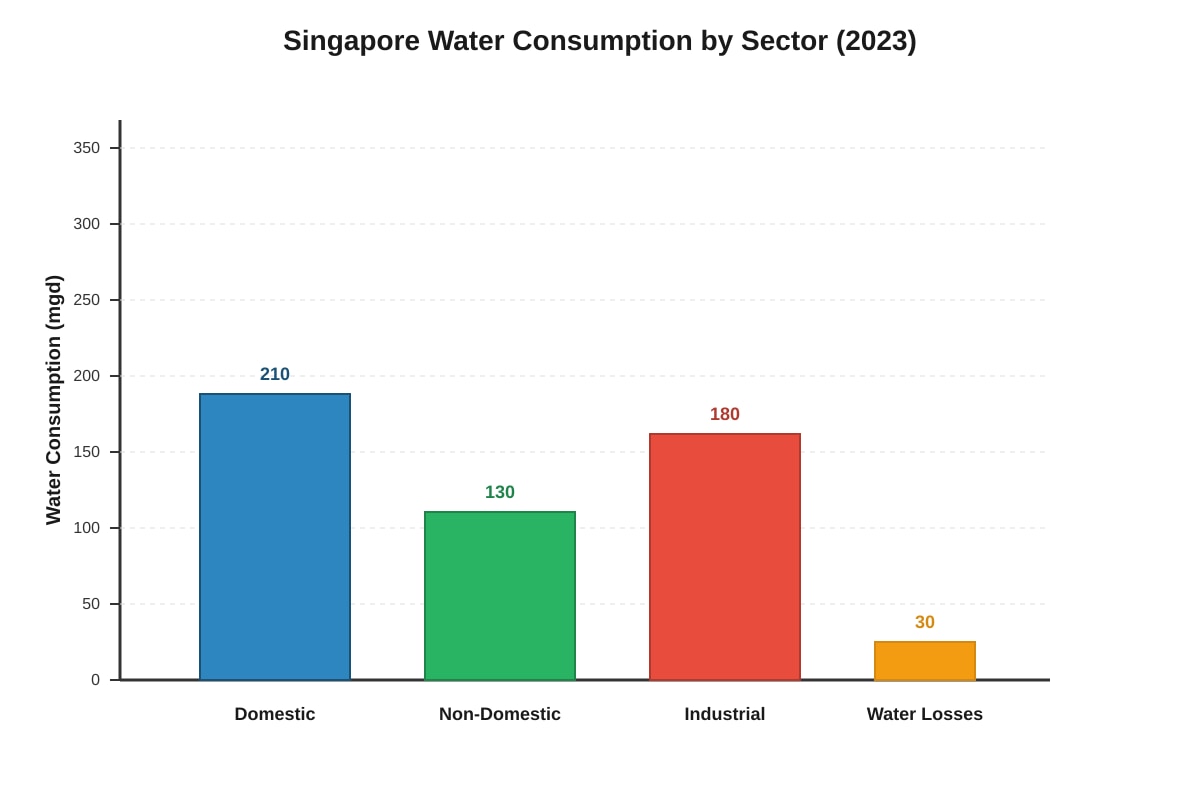
Study Figure 1 (climate graph for Singapore) and Figure 2 (bar chart of water consumption by sector) to answer Questions 7 to 12.
Generated graph for Q7.
Generated chart for Q7.
-
From Figure 1, state the month with the highest rainfall. [1]
Answer: ________________________
-
From Figure 1, calculate the annual temperature range for Singapore. Show your working. [2]
Working: ________________________________________________________________________
Answer: ____________ °C
-
Describe the relationship between temperature and rainfall shown in Figure 1 for the months of November to January. [2]
-
From Figure 2, which sector consumes the most water? [1]
Answer: ________________________
-
Calculate the percentage of total water consumption accounted for by the Domestic sector. Show your working. [2]
Working: ________________________________________________________________________
Answer: ____________ %
-
The government aims to reduce water losses to below 5% of total consumption.
(a) What is the current percentage of water losses? Show your working. [1]
(b) Suggest one strategy Singapore could use to reduce water losses. [1](a) Working: ________________________________________________________________________ Answer: ____________ %
(b) ________________________________________________________________________
Section C: Data Analysis and Application (8 marks)
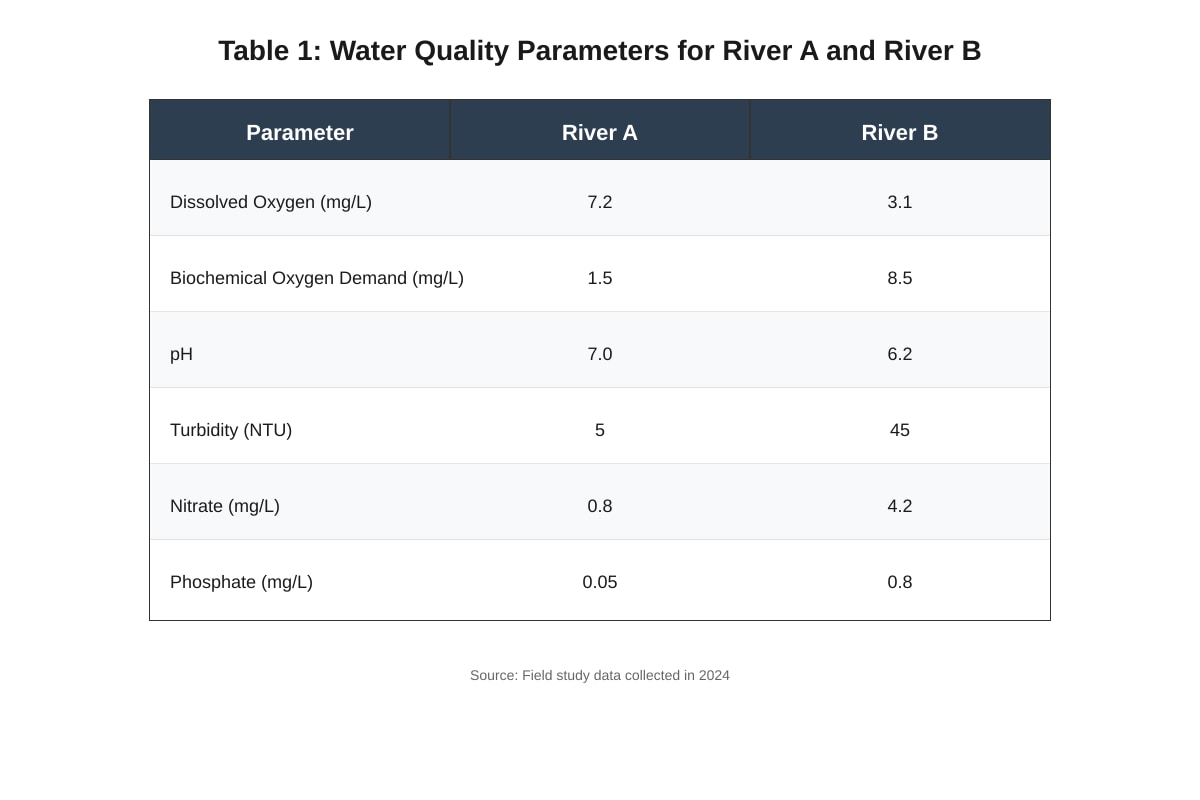
Study Table 1 (water quality data for two rivers) and Figure 3 (pie chart of land use in a catchment area) to answer Questions 13 to 20.
Generated table for Q13.
Image pending generation: chart for Q13.
-
Which river, River A or River B, has better water quality? Support your answer with two pieces of evidence from Table 1. [2]
River: ________________________
Evidence 1: ________________________________________________________________________
Evidence 2: ________________________________________________________________________ -
Explain why Biochemical Oxygen Demand (BOD) is an important indicator of water quality. [2]
-
The phosphate level in River B is 0.8 mg/L. State one possible source of phosphate in rivers and one effect of high phosphate levels on aquatic ecosystems. [2]
Source: ________________________________________________________________________
Effect: ________________________________________________________________________ -
Using Figure 3, identify the two largest land use types in the River B catchment area and state their combined percentage. [2]
Land use 1: ________________________
Land use 2: ________________________
Combined percentage: ____________ % -
Suggest how the industrial land use (25%) in the River B catchment area might contribute to the low dissolved oxygen and high BOD levels observed in Table 1. [2]
-
A student concludes: "River B is polluted because it flows through a forested area."
Evaluate this conclusion using evidence from Table 1 and Figure 3. [2]
-
The Public Utilities Board (PUB) monitors water quality at multiple sampling points along a river.
State one reason why sampling at only one point may not give an accurate picture of overall river health. [1]
-
Construct a divided bar graph (or describe how you would construct one) to compare the water quality parameters of River A and River B using the data in Table 1. Include the key steps and what the graph would show. [3]
End of Quiz
Answers
Secondary 1 Geography Quiz - Map Graph Data Skills (Answer Key)
Total Marks: 30
Section A: Map Skills (12 marks)
Question 1 [1 mark]
Answer: 1224 (or the correct grid square for Chek Jawa Visitor Centre on the map)
Explanation:
- A 4-figure grid reference identifies a grid square (1 km × 1 km on a 1:25,000 map).
- Read the easting (vertical grid line number on the left side of the square) first, then the northing (horizontal grid line number at the bottom of the square).
- Common mistake: Reversing the order (northing before easting) or using the grid lines on the right/top of the square.
- Marking: 1 mark for correct 4-figure grid reference.
Question 2 [1 mark]
Answer: 145235 (example; actual depends on map — trig station on Puaka Hill typically at 6-figure reference like 145235)
Explanation:
- A 6-figure grid reference identifies a specific point within a grid square (100 m × 100 m precision).
- Method:
- Find the 4-figure grid square (e.g., 1423).
- Divide the square into 10 equal parts horizontally and vertically (mentally or with a romer).
- Count tenths from the left (easting) and from the bottom (northing).
- Example: If the trig station is 5 tenths across and 5 tenths up in square 1423 → 145235.
- Common mistake: Forgetting to estimate tenths, or reversing easting/northing within the 6-figure reference.
- Marking: 1 mark for correct 6-figure grid reference.
Question 3 [2 marks]
Working:
- Map scale = 1:25,000 → 1 cm on map = 25,000 cm on ground = 0.25 km.
- Measure straight-line distance on map between jetty (1424) and Chek Jawa Visitor Centre (e.g., 1224).
- Example: Map distance = 4.2 cm.
- Ground distance = 4.2 cm × 0.25 km/cm = 1.05 km.
Answer: 1.05 km (accept ±0.1 km depending on measurement)
Marking:
- 1 mark for correct use of scale (1 cm = 0.25 km or 1 cm = 250 m).
- 1 mark for correct calculation and answer in km with units.
- Common mistake: Forgetting to convert cm to km, or using 1:25,000 as 1 cm = 25 km.
Question 4 [4 marks]
(a) [1 mark]
Answer: 10 m
Explanation: Contour interval = difference in height between adjacent contour lines (e.g., 70 – 60 = 10 m).
(b) [1 mark]
Answer: 100 m
Explanation: The highest contour line shown on Puaka Hill is 100 m; the trigonometrical station is at the summit, so height = 100 m above sea level.
(c) [2 marks]
Answer: The western side of Puaka Hill is steeper than the eastern side because the contour lines are closer together on the western slope, indicating a steeper gradient. On the eastern side, contour lines are further apart, indicating a gentler slope.
Marking:
- 1 mark for identifying which side is steeper/gentler.
- 1 mark for using contour spacing as evidence (closer = steeper, further = gentler).
- Key concept: Contour spacing = gradient indicator.
Question 5 [1 mark]
Answer: Green stippled/dotted pattern with label "Mangrove" or "Swamp vegetation" (as per map legend)
Explanation: Topographic maps use standard symbols; mangrove/swamp is typically shown as a green stippled or dotted pattern with a label in the legend.
Marking: 1 mark for correct symbol description.
Question 6 [3 marks]
(a) [1 mark]
Answer: North-west (NW) or West-north-west
Explanation: From grid square 1622 (Sensory Trail) to 1523 (Pekan Quarry): easting decreases (16→15 = west), northing increases (22→23 = north) → general direction is north-west.
(b) [2 marks]
Answer: The track follows a curved path to avoid steep slopes (contour lines are close together on direct route) / to follow the contour lines (gentler gradient) / to go around a hill or valley. Walking along contours reduces effort and erosion.
Marking:
- 1 mark for valid reason linked to relief (contours).
- 1 mark for explaining why (gentler gradient, less erosion, easier construction).
- Common mistake: Vague answers like "it's shorter" or "obstacles" without map evidence.
Section B: Graph and Data Interpretation (10 marks)
Question 7 [1 mark]
Answer: November (or December — both peak in NE Monsoon)
Explanation: Singapore's highest rainfall occurs during the Northeast Monsoon (Nov–Jan). On the climate graph, the tallest rainfall bar is in November (or December).
Marking: 1 mark for correct month.
Question 8 [2 marks]
Working:
- Highest monthly temperature (from line graph) ≈ 28°C (May/June).
- Lowest monthly temperature ≈ 26°C (December/January).
- Annual temperature range = Highest – Lowest = 28 – 26 = 2°C.
Answer: 2°C
Marking:
- 1 mark for identifying correct highest and lowest temperatures from graph.
- 1 mark for correct subtraction and unit (°C).
- Key concept: Singapore has a small annual temperature range (~2°C) due to equatorial location.
Question 9 [2 marks]
Answer: From November to January, rainfall is high (peaking in November/December) while temperature is relatively lower (around 26°C). This corresponds to the Northeast Monsoon season, where increased cloud cover and rain moderate temperatures.
Marking:
- 1 mark for describing rainfall pattern (high/increasing).
- 1 mark for describing temperature pattern (lower/decreasing) and linking to monsoon/cloud cover.
- Key concept: Inverse relationship during monsoon months — more rain → cooler temperatures.
Question 10 [1 mark]
Answer: Domestic sector (210 mgd)
Explanation: Compare bar heights/values: Domestic (210) > Industrial (180) > Non-Domestic (130) > Water Losses (30).
Marking: 1 mark for correct sector.
Question 11 [2 marks]
Working:
- Total consumption = 210 + 130 + 180 + 30 = 550 mgd.
- Domestic = 210 mgd.
- Percentage = (210 ÷ 550) × 100 = 38.18% ≈ 38.2%.
Answer: 38.2%
Marking:
- 1 mark for correct total (550 mgd).
- 1 mark for correct percentage calculation and answer with % sign.
- Common mistake: Forgetting to multiply by 100, or using wrong total.
Question 12 [2 marks]
(a) [1 mark]
Working:
- Water Losses = 30 mgd.
- Total = 550 mgd.
- Percentage = (30 ÷ 550) × 100 = 5.45% ≈ 5.5%.
Answer: 5.5%
(b) [1 mark]
Answer: Replace ageing pipes / use leak detection technology (acoustic sensors, smart meters) / regular pipe maintenance / pressure management in pipelines.
Marking:
- (a) 1 mark for correct calculation.
- (b) 1 mark for a valid, specific strategy (not just "fix leaks").
- Context: Singapore's water losses are already low globally (~5%); further reduction requires technology.
Section C: Data Analysis and Application (8 marks)
Question 13 [2 marks]
Answer: River A
Evidence 1: River A has higher Dissolved Oxygen (7.2 mg/L vs 3.1 mg/L) — indicates better oxygenation for aquatic life.
Evidence 2: River A has lower BOD (1.5 mg/L vs 8.5 mg/L) — indicates less organic pollution.
Marking:
- 1 mark for correct river (River A).
- 1 mark for two valid pieces of evidence from Table 1 (DO, BOD, pH, turbidity, nitrate, phosphate — any two correct comparisons).
- Key concept: High DO + Low BOD = good water quality.
Question 14 [2 marks]
Answer: BOD measures the amount of oxygen consumed by microorganisms decomposing organic matter in water. A high BOD means there is large amounts of organic pollution (e.g., sewage, food waste), which depletes oxygen, harming aquatic organisms. It is a key indicator of organic pollution levels.
Marking:
- 1 mark for defining BOD (oxygen demand by decomposers).
- 1 mark for explaining its significance (high BOD → low DO → pollution indicator).
- Key concept: BOD ↔ DO inverse relationship.
Question 15 [2 marks]
Source: Agricultural runoff (fertilisers), sewage/domestic wastewater, industrial discharge (detergents), or animal waste.
Effect: Eutrophication — excessive algae growth (algal bloom) → blocks sunlight → algae die → decomposers use up oxygen → hypoxia/anoxia → fish kills and loss of biodiversity.
Marking:
- 1 mark for a valid source.
- 1 mark for a valid effect (must mention eutrophication/algal bloom/oxygen depletion).
- Key concept: Phosphate = limiting nutrient in freshwater → eutrophication.
Question 16 [2 marks]
Land use 1: Residential (35%)
Land use 2: Industrial (25%)
Combined percentage: 60%
Marking:
- 1 mark for identifying the two largest sectors correctly.
- 1 mark for correct sum (35 + 25 = 60%).
- Common mistake: Misreading pie chart percentages or adding incorrectly.
Question 17 [2 marks]
Answer: Industrial land use may discharge untreated or partially treated wastewater containing organic pollutants, chemicals, and heavy metals into River B. This increases organic matter → raises BOD as decomposers consume oxygen → lowers Dissolved Oxygen (DO). Thermal pollution from cooling water can also reduce DO solubility.
Marking:
- 1 mark for linking industrial discharge to organic/chemical pollutants.
- 1 mark for explaining the mechanism: pollutants → high BOD → low DO.
- Key concept: Point-source pollution from industry → water quality degradation.
Question 18 [2 marks]
Answer: The conclusion is incorrect.
- Evidence from Figure 3: Forested area is only 15% of the catchment — the majority (60%) is Residential + Industrial.
- Evidence from Table 1: River B shows high BOD (8.5), low DO (3.1), high turbidity (45), high nitrate (4.2), high phosphate (0.8) — all indicators of urban/industrial pollution, not forest runoff.
- Forests generally improve water quality (filter runoff, reduce erosion).
Marking:
- 1 mark for stating conclusion is wrong/unsupported.
- 1 mark for using evidence from both Table 1 and Figure 3 to refute it.
- Key skill: Evaluating claims using multiple data sources.
Question 19 [1 mark]
Answer: Water quality changes along the river (e.g., pollution enters at specific points, tributaries dilute or add pollutants, self-purification occurs downstream). A single point only shows conditions at that location, not the overall health or pollution sources.
Marking: 1 mark for a valid reason (spatial variation, point sources, temporal changes, representativeness).
Key concept: Spatial representativeness in environmental monitoring.
Question 20 [3 marks]
Answer (description of divided bar graph construction):
- Choose a standard total length (e.g., 10 cm or 100%) for each river's bar.
- Convert each parameter value to a percentage of the total for that river (or use a common scale if parameters have same units — but they don't, so normalise).
Better approach: Since parameters have different units, create separate divided bars for each parameter (6 bars total: 3 for River A, 3 for River B? No — standard divided bar compares categories within a whole).
Correct method for this data: A divided bar graph is not ideal for parameters with different units. Instead, use a grouped bar chart or radar chart.
If forced to use divided bar: Normalise each parameter to a water quality index score (0–100), then show composition of index.
Expected student answer (simplified):- Draw two bars of equal length (one for River A, one for River B).
- Divide each bar into segments representing relative levels of each parameter (e.g., DO high = long segment for River A; BOD high = long segment for River B).
- Use a key/legend for parameters.
- What it shows: Visual comparison of which river has better/worse values across parameters — River A bar dominated by DO, pH (good); River B bar dominated by BOD, Turbidity, Nitrate, Phosphate (poor).
Marking (3 marks):
- 1 mark for key steps: equal-length bars, segments proportional to values, key/legend, labels.
- 1 mark for addressing the different units problem (normalisation/index) or correctly stating limitation.
- 1 mark for stating what the graph shows (comparison of water quality profiles).
- Teaching note: This question tests data presentation judgment — divided bar is for parts of a whole (same unit). Best answer acknowledges this and suggests grouped bar chart or radar chart instead.
End of Answer Key
Free quiz and exam paper access
Enter your details to view this paper
Your access is remembered on this device.