From Real Exams Quiz
Secondary 1 Geography Map Graph Data Skills Quiz
Free Sec 1 Geography Map Graph Data Skills quiz, Kimi2.6 Exam version, with questions, answers, and syllabus-aligned practice for Singapore students.
These static practice materials are generated from the site's syllabus and paper-generation workflow, with source and model context shown so students and parents can evaluate the material before use.
Questions
Secondary 1 Geography Quiz - Map Graph Data Skills
Name:_________________________ Class:_________________________
Date:__________________________ Score:__________/35
Duration: 40 minutes
Instructions:
- Answer ALL questions.
- Write your answers in the spaces provided.
- For map-based questions, show your working where grid references are required.
- Calculators are not permitted unless stated.
Section A: Map Skills (Questions 1–8, 14 marks)
Refer to the map extract below for Questions 1–5.
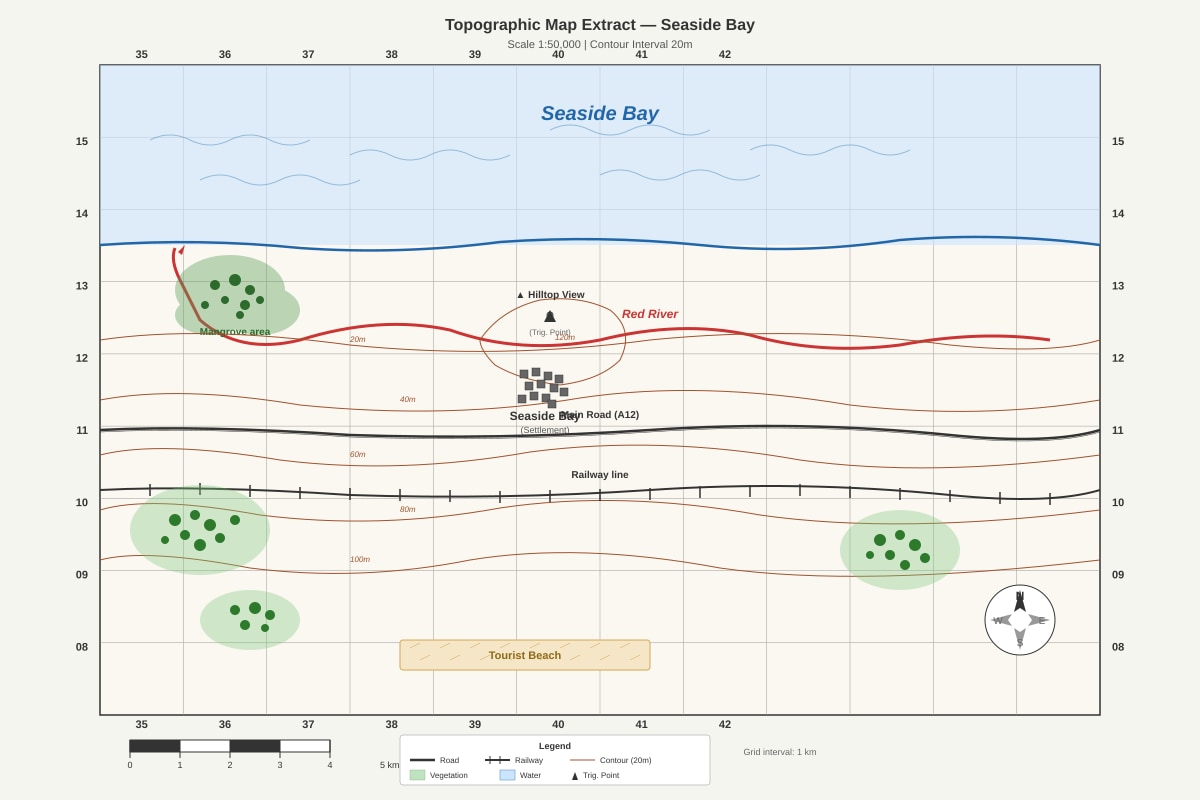
Generated map for Q1-Q5.
1. State the 4-figure grid reference of the settlement of Seaside Bay.
_______________________________________________ (1 mark)
2. State the 6-figure grid reference of the triangulation point at Hilltop View.
_______________________________________________ (2 marks)
3. Measure the straight-line distance from the railway station in grid square 3809 to the western end of Tourist Beach. Give your answer in kilometres.
_______________________________________________ (2 marks)
4. Describe the relief of the land in the area shown by grid squares 37/11 to 40/13.
_______________________________________________ (2 marks)
5. A student wants to walk from the mangrove area to Hilltop View. Explain why following the path along the eastern side of Red River would be easier than taking a direct route across the area south of the river.
_______________________________________________ (2 marks)
6. On the sketch map below, complete the missing conventional symbols.
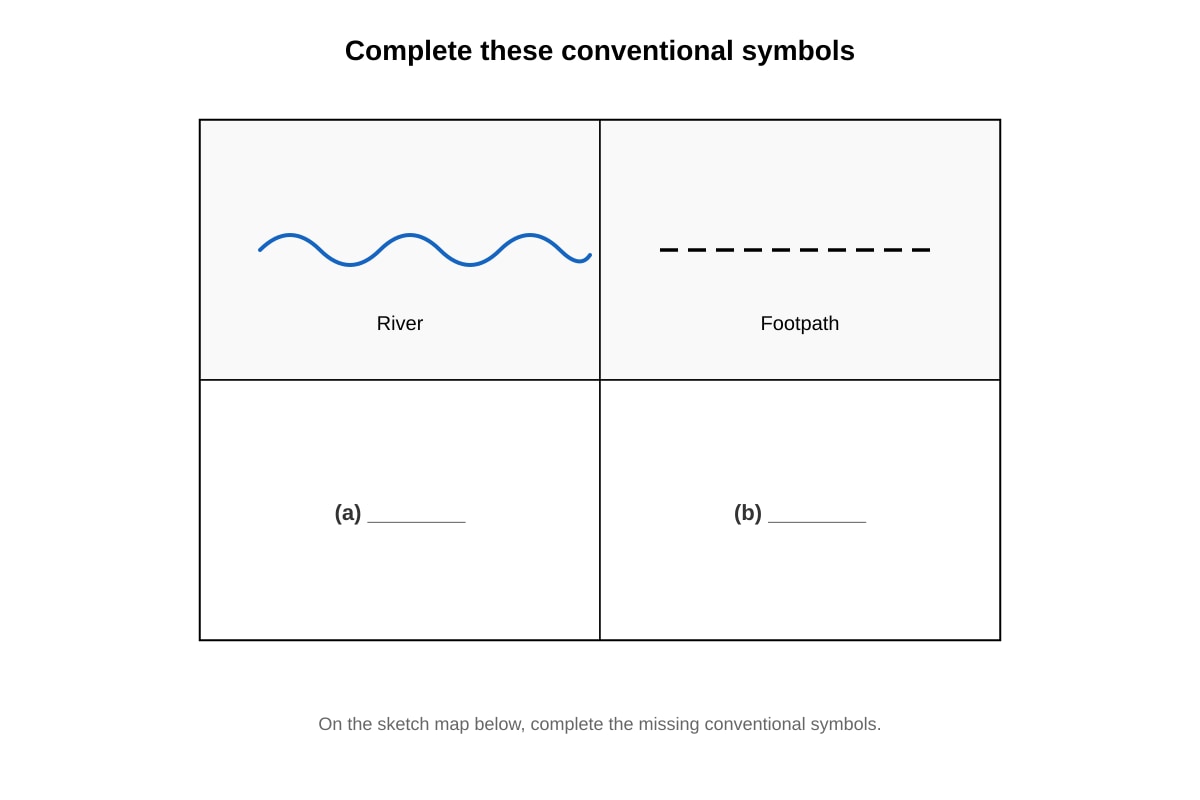
Generated map for Q6.
(a) Draw the symbol for a main road. (1 mark)
(b) Draw the symbol for a bridge. (1 mark)
7. State two ways that a geographer could tell that Seaside Bay is likely to experience a tropical climate, using evidence from the map.
_______________________________________________ (2 marks)
Section B: Graph and Data Skills (Questions 8–14, 12 marks)
Refer to the climate graph below for Questions 8–11.
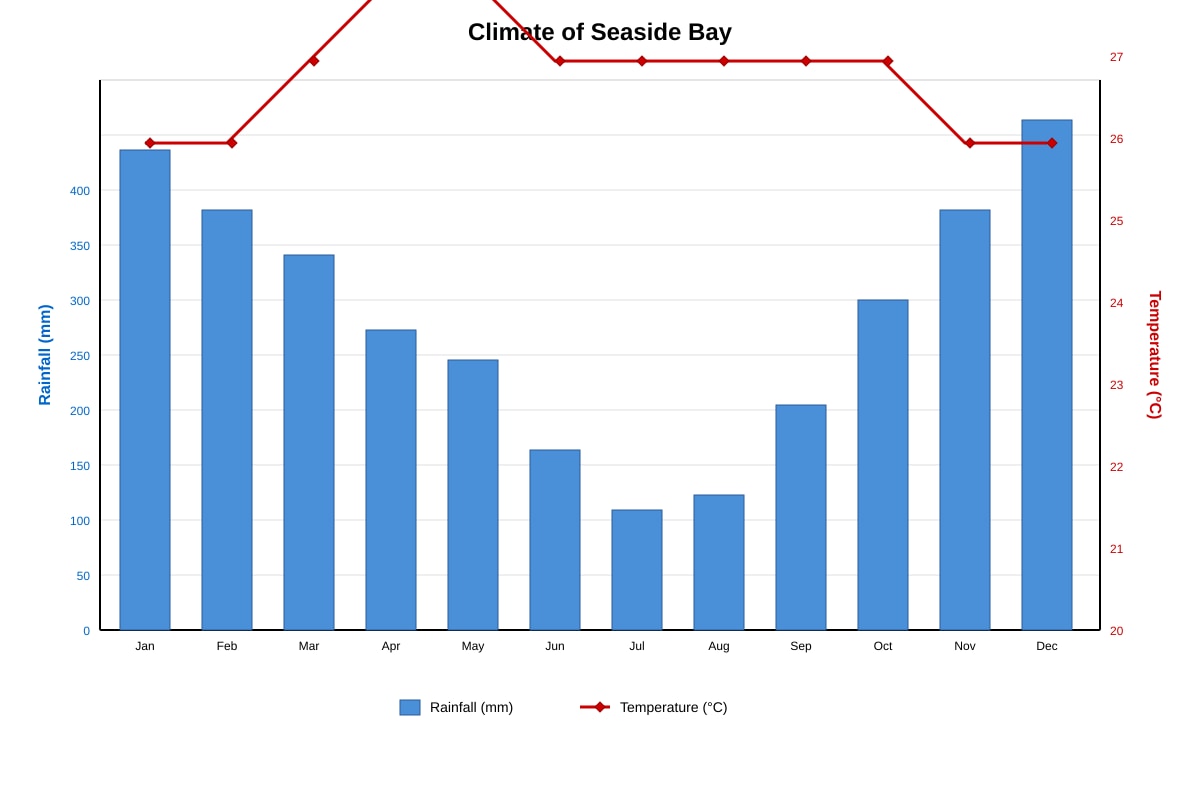
Generated graph for Q8-Q11.
8. State the total annual rainfall for Seaside Bay.
_______________________________________________ (1 mark)
9. Compare the rainfall pattern between June–August and October–December. Use data in your answer.
_______________________________________________ (2 marks)
10. Calculate the annual temperature range for Seaside Bay. Show your working.
_______________________________________________ (2 marks)
11. A geography student concludes: "Seaside Bay has an equatorial climate." Explain whether the data on the climate graph supports this statement.
_______________________________________________ (2 marks)
Refer to the table below for Questions 12–14.
Table 1: Population of Seaside Bay, 2013–2023
| Year | Total Population | Annual Growth Rate (%) |
|---|---|---|
| 2013 | 45,000 | — |
| 2015 | 47,250 | 2.5 |
| 2017 | 50,000 | 2.9 |
| 2019 | 52,000 | 2.0 |
| 2021 | 55,000 | 2.9 |
| 2023 | 58,500 | 3.2 |
12. Describe the overall trend in Seaside Bay's population shown in Table 1.
_______________________________________________ (2 marks)
13. Identify the year with the slowest population growth rate and suggest one possible reason for this.
_______________________________________________ (2 marks)
14. Calculate the absolute population increase between 2013 and 2023.
_______________________________________________ (1 mark)
Section C: Data Interpretation and Application (Questions 15–20, 9 marks)
Refer to the pie chart and photographs below for Questions 15–17.
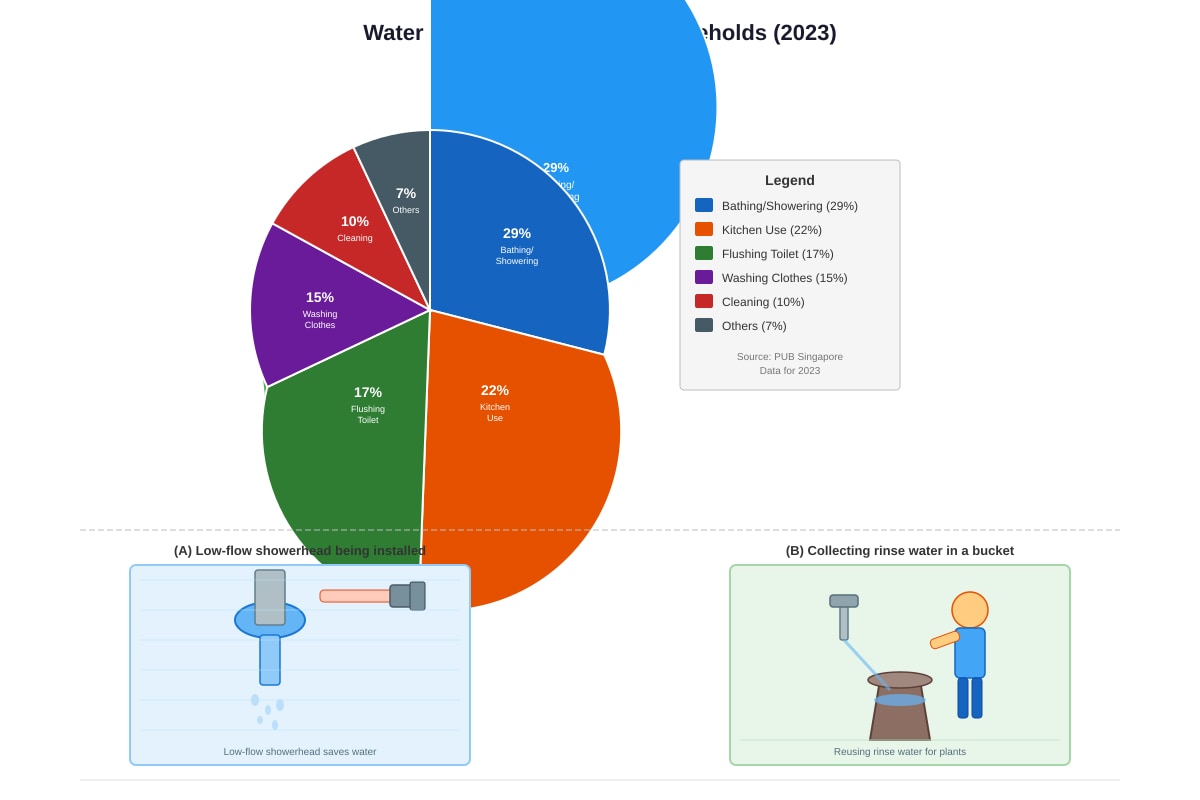
Generated chart for Q15-Q17.
15. Identify the largest use of water in Singapore households.
_______________________________________________ (1 mark)
16. Calculate how many litres of water are used for kitchen purposes if a household consumes 400 litres per day. Show your working.
_______________________________________________ (2 marks)
17. Using evidence from the photographs, explain two ways that households can reduce their water consumption.
_______________________________________________ (2 marks)
Refer to the flow map below for Questions 18–20.
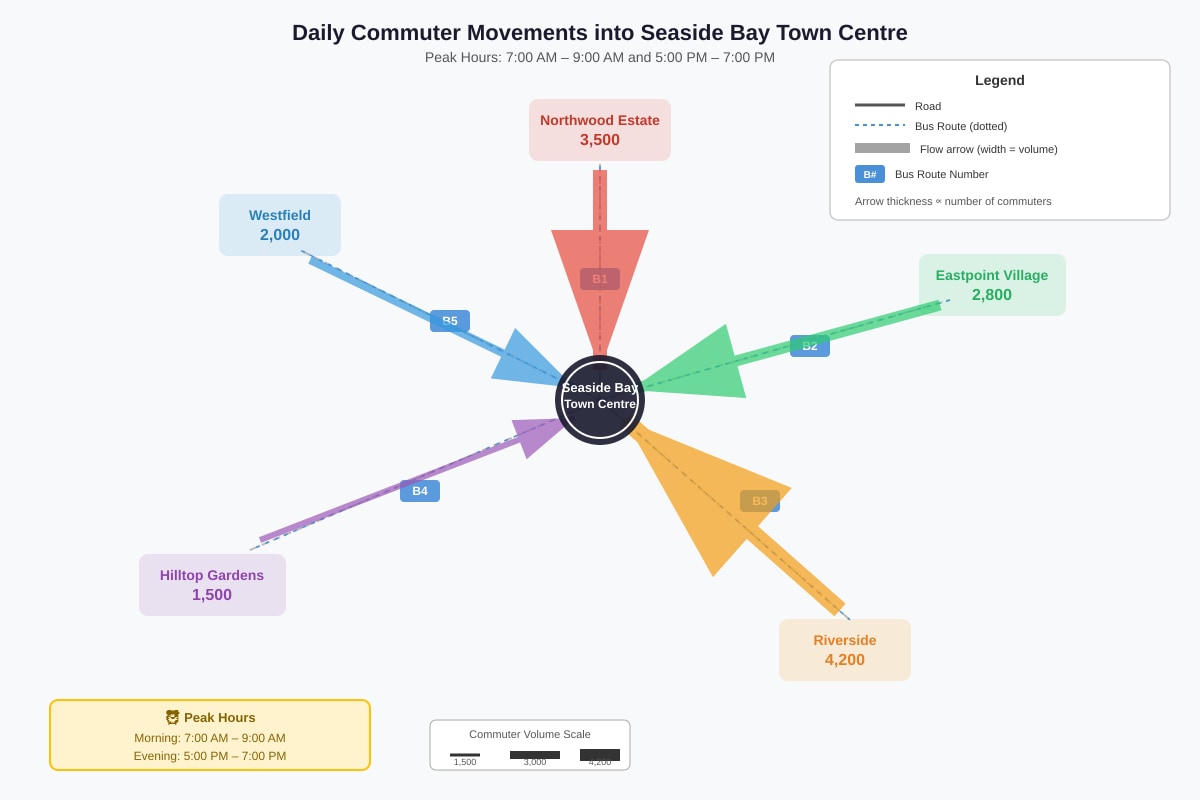
Generated map for Q18-Q20.
18. Identify the origin with the greatest number of commuters travelling to Seaside Bay town centre each day.
_______________________________________________ (1 mark)
19. Suggest two reasons why Riverside might have the highest number of commuters.
_______________________________________________ (2 marks)
20. A transport planner wants to use this data to improve bus services. Explain how the information on the flow map could help with planning.
_______________________________________________ (2 marks)
END OF QUIZ
Answers
Secondary 1 Geography Quiz - Map Graph Data Skills: Answer Key
Total Marks: 35
Section A: Map Skills (14 marks)
Question 1 (1 mark)
Answer: 3909 (accept 4009, 3910, 4010 if within settlement boundaries)
Method: Read easting first (horizontal axis, left to right), then northing (vertical axis, bottom to top). Seaside Bay settlement occupies the grid square where easting 39 meets northing 09. The lower-left corner of the square gives the 4-figure reference.
Common mistake: Writing 0939 (reversed order) or giving a 6-figure reference when asked for 4-figure.
Question 2 (2 marks)
Answer: 391125 (acceptable range: 390124 to 392126 depending on exact centring)
Method: For 6-figure grid references, divide the grid square into 10 equal parts mentally.
- Easting: 39 (grid line) plus estimate of tenths across → 391 (1/10 east across the square)
- Northing: 11 (grid line) plus estimate of tenths up → 125 (approximately 2.5/10 up the square)
Mark breakdown: 1 mark for correct easting (391), 1 mark for correct northing (125)
Teaching note: Always estimate to the nearest tenth (one decimal place) by visually dividing the grid square. The triangulation point is slightly east of centre and about one-quarter up from the 11 line.
Common mistake: Forgetting to divide into tenths and simply adding "00" (giving 391100) or "50" (giving 391150) without estimation.
Question 3 (2 marks)
Answer: 4.0 km (accept 3.8–4.2 km)
Working:
- Measure on map: approximately 8.0 cm (using ruler — accept 7.6–8.4 cm)
- Scale: 1:50,000 means 1 cm on map = 50,000 cm on ground = 0.5 km
- Calculation: 8.0 cm × 0.5 km/cm = 4.0 km
Mark breakdown: 1 mark for correct measurement method or working, 1 mark for correct final answer with unit
Teaching note:
- Scale 1:50,000 means real distance is 50,000 times map distance
- Convert: 50,000 cm = 500 m = 0.5 km (handy shortcut: at 1:50,000, 2 cm = 1 km)
- Always state units in final answer
Common mistake: Forgetting to convert cm to km (giving 400,000 cm or 4,000 m without conversion), or using the wrong scale.
Question 4 (2 marks)
Answer: (Any two valid points with development)
- The land rises from south to north / from the coast inland
- Heights increase from approximately 0–20 m near the coast to over 100 m at Hilltop View
- The area has gentle slopes in the south/east and steeper slopes in the north near the triangulation point
- Contour lines are widely spaced in the south indicating gentle relief, and closer together in the north indicating steeper relief
Mark breakdown: 1 mark for identifying a relief pattern, 1 mark for supporting evidence from the map (contour values or spacing)
Teaching note: "Relief" means the shape and height of the land. Describe it by mentioning:
- General direction of slope (which way does the land rise?)
- Heights/elevations (use contour values)
- Steepness (use contour spacing: close = steep, wide = gentle)
Question 5 (2 marks)
Answer:
- The path along the eastern side follows gentler slopes / the contour lines are more widely spaced (1)
- The direct route south of the river crosses closer contour lines / steeper slopes which would be more tiring and potentially dangerous (1)
Alternative acceptable answer:
- The path follows existing infrastructure / is a marked route (1)
- The direct route would involve crossing the river and possibly dense vegetation (1)
Mark breakdown: 1 mark for comparing the terrain/ease of eastern path, 1 mark for explaining why the direct route is harder
Teaching note: In geography, always justify route choices using map evidence. The key principle: closely spaced contours = steep slope = difficult walking; widely spaced contours = gentle slope = easier walking.
Common mistake: Simply stating "the path is easier" without explaining WHY using contour evidence.
Question 6 (2 marks)
(a) Main road symbol: Two parallel solid lines with a gap between, or single thick solid line (1 mark for drawing resembling standard OS/main road symbol)
(b) Bridge symbol: Road/rail line with small arch or bracket over water feature (1 mark for showing crossing over water)
Teaching note: Conventional symbols are standardised so any geographer can read any map. Main roads are shown with double lines; bridges show where a road or rail crosses water.
Question 7 (2 marks)
Answer: (Any two)
- Presence of mangroves — these grow in tropical coastal areas with warm temperatures
- Tourist Beach / coastal location suggests warm climate suitable for beach tourism
- Vegetation shown as dense/green areas suggests tropical rainforest or lush tropical vegetation
- Low-lying coastal plain with rivers suggests equatorial/tropical climatic conditions
Mark breakdown: 1 mark for each valid clue with linked explanation; must mention evidence from map
Teaching note: Biogeography links vegetation types to climate. Mangroves specifically require temperatures above 20°C year-round, found between latitudes 25°N and 25°S.
Section B: Graph and Data Skills (12 marks)
Question 8 (1 mark)
Answer: 2,490 mm / 2,490 millimetres (accept 2,490 mm or 2490 mm)
Working: 320 + 280 + 250 + 200 + 180 + 120 + 80 + 90 + 150 + 220 + 280 + 340 = 2,490 mm
Teaching note: Annual rainfall = sum of all monthly values. Always add carefully — column addition recommended. Check: the total should be roughly consistent with tropical rainforest (typically over 2,000 mm/year).
Question 9 (2 marks)
Answer:
- June–August receives much less rainfall: only 290 mm total (120 + 80 + 90) compared to 840 mm in October–December (220 + 280 + 340) (1)
- June–August shows a clear drier season / potential drought conditions, while October–December shows the wettest months of the year (1)
Alternative for second mark:
- October–December has 3.5 times more rainfall than June–August / any valid proportional comparison with data
Mark breakdown: 1 mark for identifying contrast with data, 1 mark for developed comparison
Teaching note: "Compare" requires BOTH similarities AND differences, but a strong contrast with data is acceptable for full marks at this level. Always quote figures to support your observation. The pattern shown is actually monsoonal tropical, not fully equatorial.
Question 10 (2 marks)
Answer: 2°C
Working:
- Highest monthly temperature: 28°C (April or May)
- Lowest monthly temperature: 26°C (January, February, November, December)
- Range = 28 − 26 = 2°C
Mark breakdown: 1 mark for correct method (highest − lowest), 1 mark for correct answer
Teaching note: Temperature range = difference between maximum and minimum values. Small range (like 2°C) suggests equatorial influence; ranges over 10°C would suggest seasonal/monsoon climate. Note: despite the rainfall pattern suggesting monsoon, the small temperature range is equatorial.
Question 11 (2 marks)
Answer:
- Partially correct / the statement is only partly supported (1)
- Small temperature range (2°C) and high temperatures year-round (26–28°C) match equatorial climate characteristics (1)
- BUT equatorial climates should have rainfall evenly distributed throughout the year / no dry season; Seaside Bay has a distinct drier season in June–August (accept below 100 mm in some months) (1)
Maximum 2 marks from above points; need not explicitly state "partially" if student gives balanced evaluation
Mark breakdown: 1 mark for evaluating with temperature evidence, 1 mark for evaluating with rainfall evidence to show limitation
Teaching note: Equatorial climate = high temperature (26–28°C); small annual range (<3°C); rainfall year-round, minimum 60 mm every month. Tropical monsoon = similar temperature but with distinct wet/dry seasons. Seaside Bay is actually tropical monsoon, not equatorial. Full marks for balanced evaluation recognizing both matching and non-matching evidence.
Question 12 (2 marks)
Answer:
- Population is increasing / growing / rising throughout the period (1)
- Growth is accelerating in later years / growth rate is generally increasing (from 2.5% to 3.2% with one dip) (1)
Alternative second point:
- Population increased by 13,500 over 10 years / more than doubled its initial growth rate by 2023
Mark breakdown: 1 mark for overall trend direction, 1 mark for qualification (rate of change pattern)
Question 13 (2 marks)
Answer: 2019 (1 mark for identification)
Suggested reason (1 mark):
- Economic downturn / recession affecting job opportunities
- Completion of major housing development, reducing new arrivals
- Temporary policy change / border restrictions
- Saturation of local employment market
Teaching note: Population growth rates fluctuate due to economic, political, social, and environmental factors. 2019 precedes COVID-19, so pandemic reasons are historically inaccurate for this specific dataset.
Question 14 (1 mark)
Answer: 13,500 people
Working: 58,500 − 45,000 = 13,500
Teaching note: "Absolute increase" = simple subtraction (final − initial). "Relative increase" would be percentage. Read command words carefully.
Section C: Data Interpretation and Application (9 marks)
Question 15 (1 mark)
Answer: Bathing/Showering
Question 16 (2 marks)
Answer: 88 litres
Working:
- Kitchen Use = 22% of total
- 22% of 400 litres = 0.22 × 400 = 88 litres
Or:
- 400 ÷ 100 × 22 = 88 litres
Mark breakdown: 1 mark for correct method (percentage calculation), 1 mark for correct answer with unit
Teaching note: "Per cent" means "per hundred." To find a percentage of a quantity: convert % to decimal (÷ 100), then multiply. Water conservation is critical for Singapore as it depends heavily on imported water and NEWater.
Question 17 (2 marks)
Answer: (Any two linked explanations)
- Photograph A shows installing a low-flow showerhead — this reduces water flow during bathing, cutting the largest water use category (29%) (1)
- Photograph B shows collecting rinse water in a bucket for reuse — this recycles water that would otherwise be wasted, reducing total consumption (1)
Mark breakdown: 1 mark for each photograph linked to water-saving action with explanation of how it works
Teaching note: Singapore's "Four National Taps" strategy includes water conservation as demand management. NEWater, desalination, imported water, and local catchment are supply-side; household reduction is demand-side.
Question 18 (1 mark)
Answer: Riverside
Question 19 (2 marks)
Answer: (Any two valid reasons)
- Riverside may have fewer local jobs / employment opportunities, forcing residents to commute
- Riverside may have cheaper housing / residential area, attracting workers who work in town centre
- Riverside may be well-connected by bus routes (shown on map) making commuting convenient
- Riverside may have grown as a dormitory suburb / bedroom community specifically for Seaside Bay workers
- Riverside may have larger population base to draw commuters from
Mark breakdown: 1 mark for each plausible reason with logical development
Teaching note: Flow maps show spatial interaction — where people, goods, or information move between places. Thick arrows indicate strong linkages. Commuting patterns reveal urban structure: residential suburbs ↔ employment centres.
Question 20 (2 marks)
Answer:
- The planner can identify which routes need more buses / larger buses based on commuter numbers (1)
- Peak hour data shows when to increase frequency / add express services to reduce overcrowding (1)
- The map shows where new bus routes might be needed if some areas lack direct connections / where to add feeder services (1)
Maximum 2 marks — any two developed points
Mark breakdown: 1 mark for identifying data use, 1 mark for explaining transport planning application
Teaching note: Geographical data (like flow maps) supports evidence-based planning. The "where," "when," and "how many" questions that the map answers directly inform service planning decisions. This is applied geography — using data to solve real problems.
Mark Distribution Summary
| Section | Topic | Marks |
|---|---|---|
| A | Map Skills | 14 |
| B | Graph and Data Skills | 12 |
| C | Data Interpretation and Application | 9 |
| Total | 35 |
Expected time allocation: ~1 minute per mark = 35 minutes, leaving 5 minutes for review.
Free quiz and exam paper access
Enter your details to view this paper
Your access is remembered on this device.