From Real Exams Quiz
Secondary 1 Geography Map Graph Data Skills Quiz
Free Sec 1 Geography Map Graph Data Skills quiz, HY3 Exam version, with questions, answers, and syllabus-aligned practice for Singapore students.
These static practice materials are generated from the site's syllabus and paper-generation workflow, with source and model context shown so students and parents can evaluate the material before use.
Questions
Free quiz and exam paper access
Enter your details to view this paper
Your access is remembered on this device.
Answers
Secondary 1 Geography Quiz - Map Graph Data Skills (Answer Key)
Total Marks: 40
Topic: Map, Graph & Data Skills
Section A: Map Reading
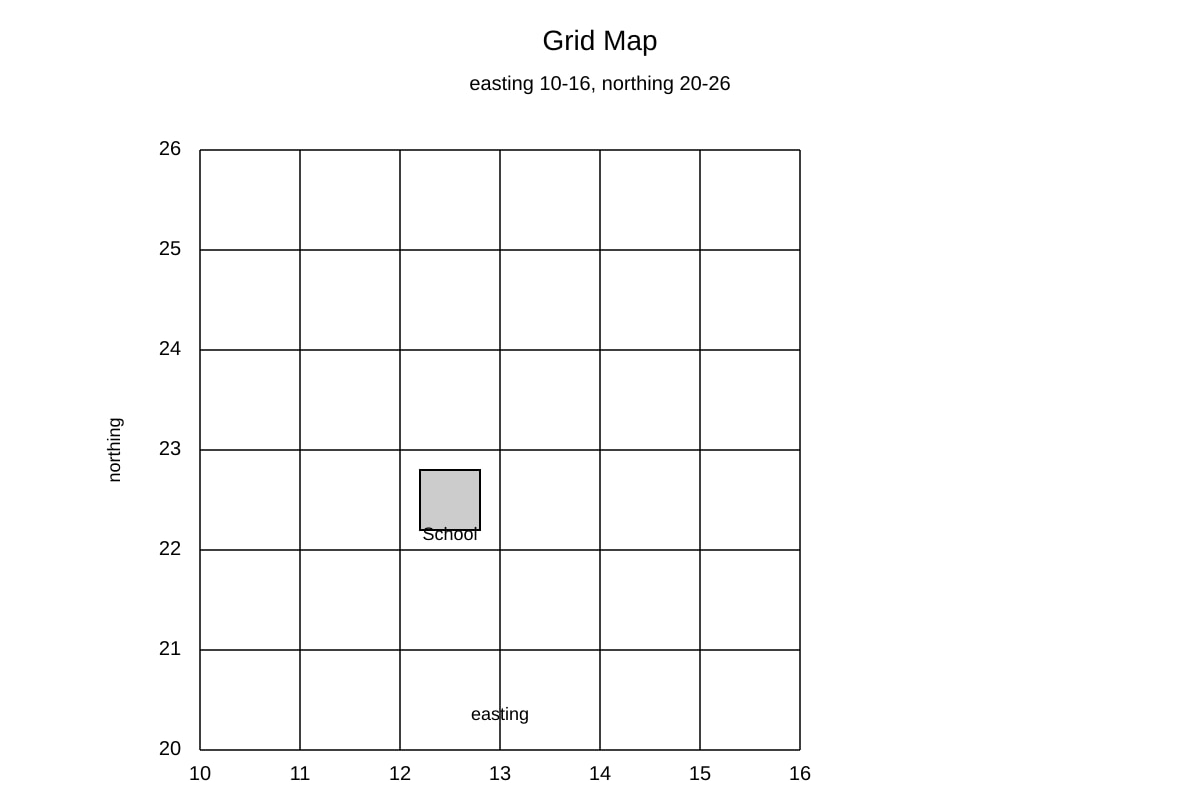
Q1 [1 mark]
Answer: 1223
Teaching note: A 4-figure grid reference uses the lower-left corner of the square. Easting (horizontal) first = 12, northing (vertical) = 23. Common mistake: reversing order to 2312.
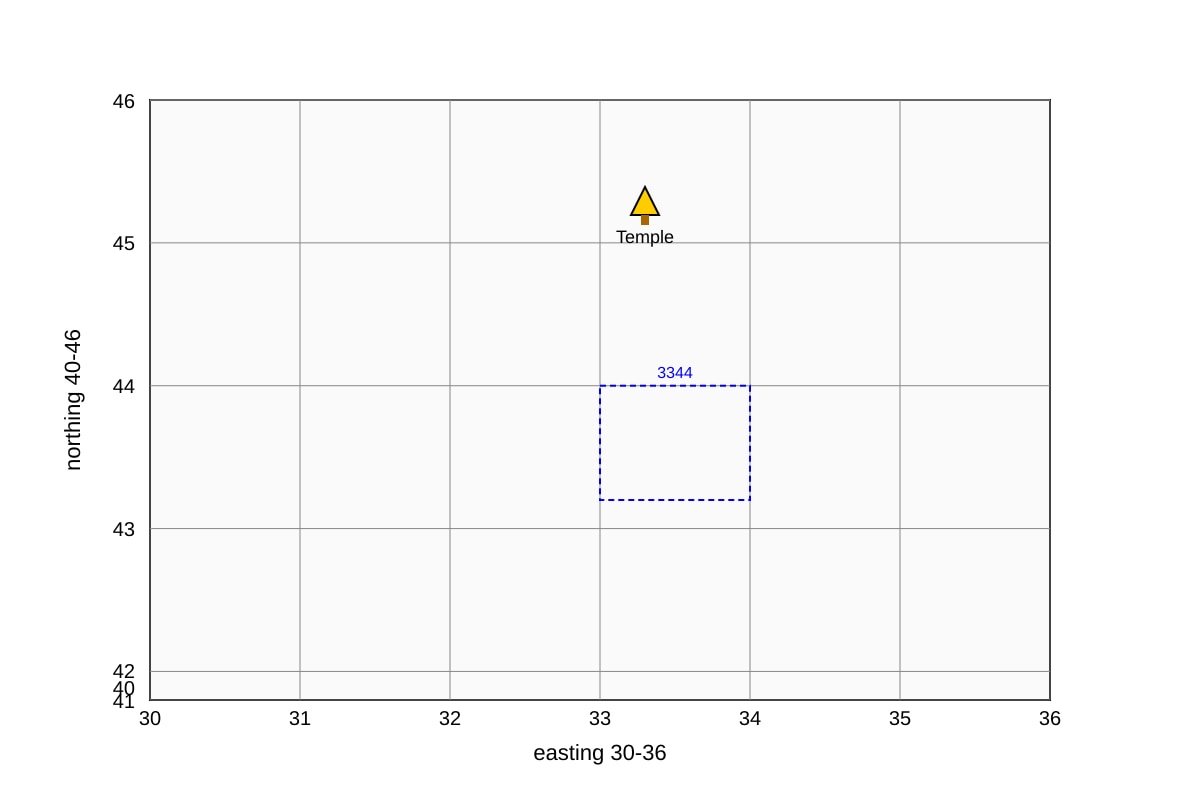
Q2 [1 mark]
Answer: 333447 (acceptable 333446–333448 range)
Teaching note: 6-figure reference starts with 4-figure (3344) then adds tenths within square: 3/10 east = 3, 7/10 north = 7 → 333447. Subdivision estimates vary.
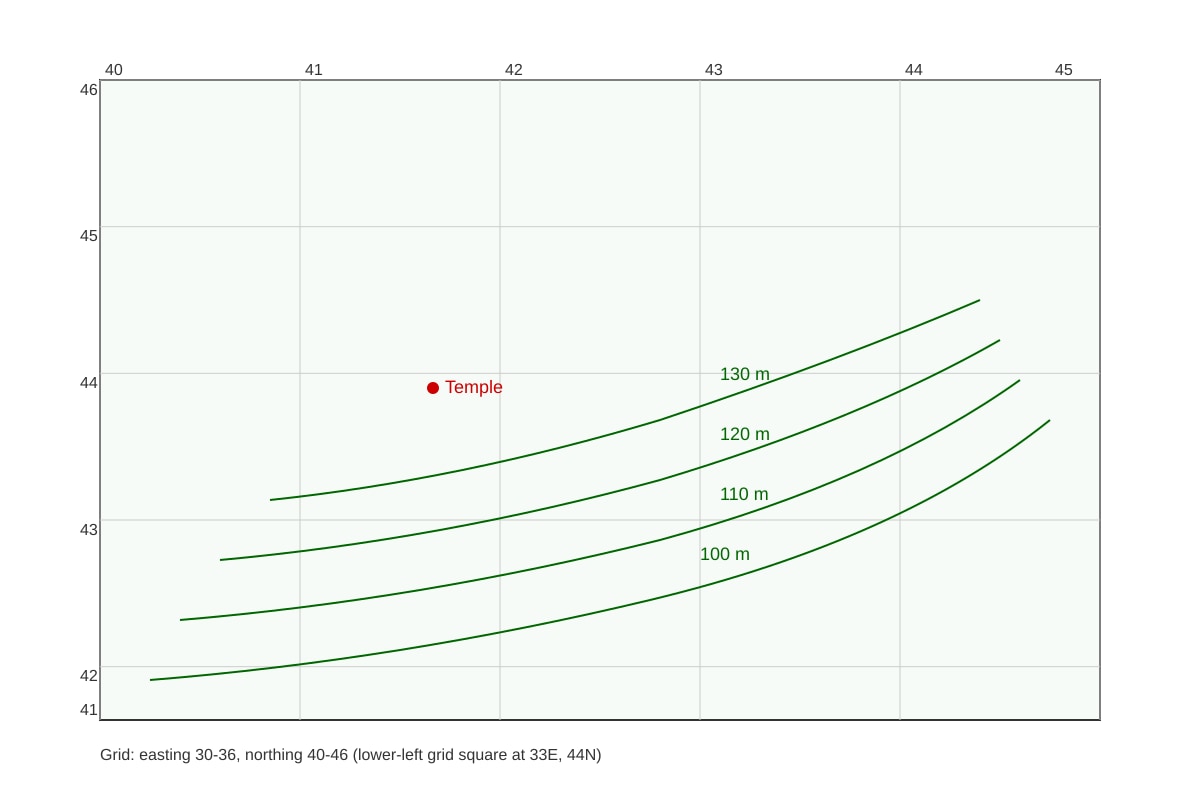
Q3 [1 mark]
Answer: 10 m
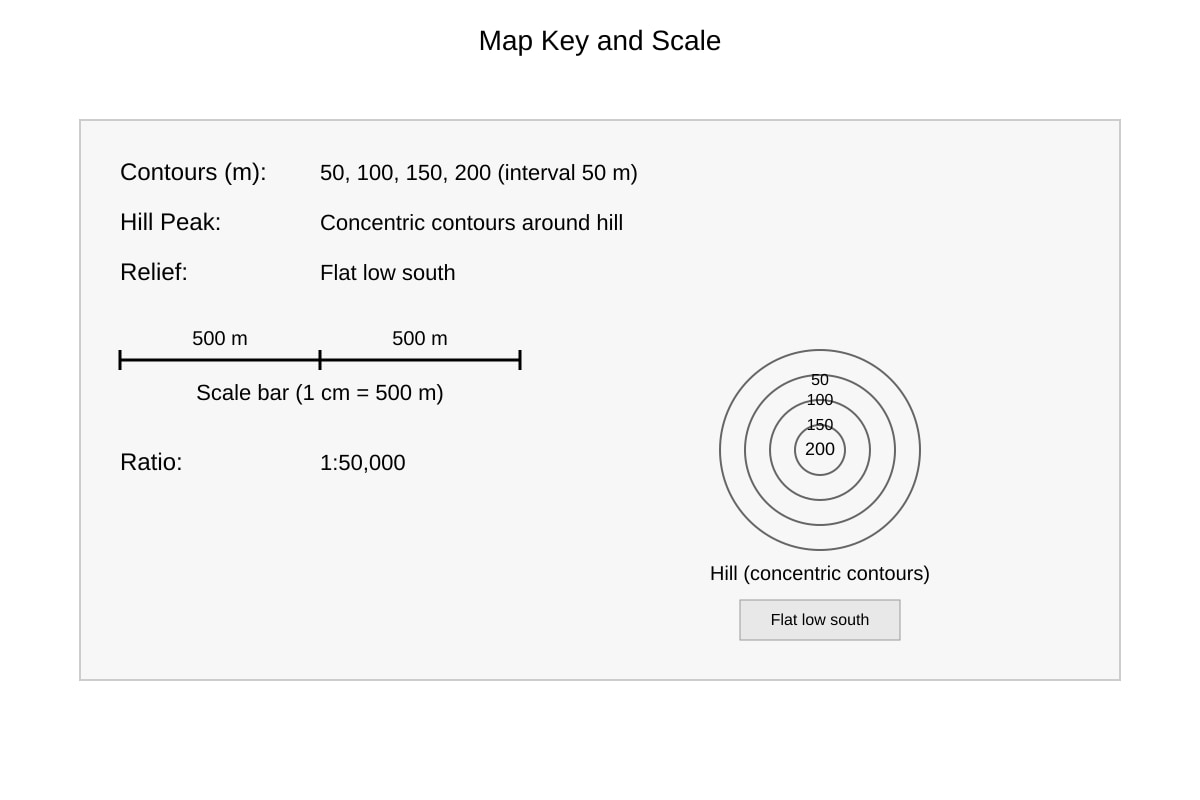
Teaching note: Contour interval = difference between adjacent labelled contours (110 − 100 = 10 m). Do not confuse with scale.
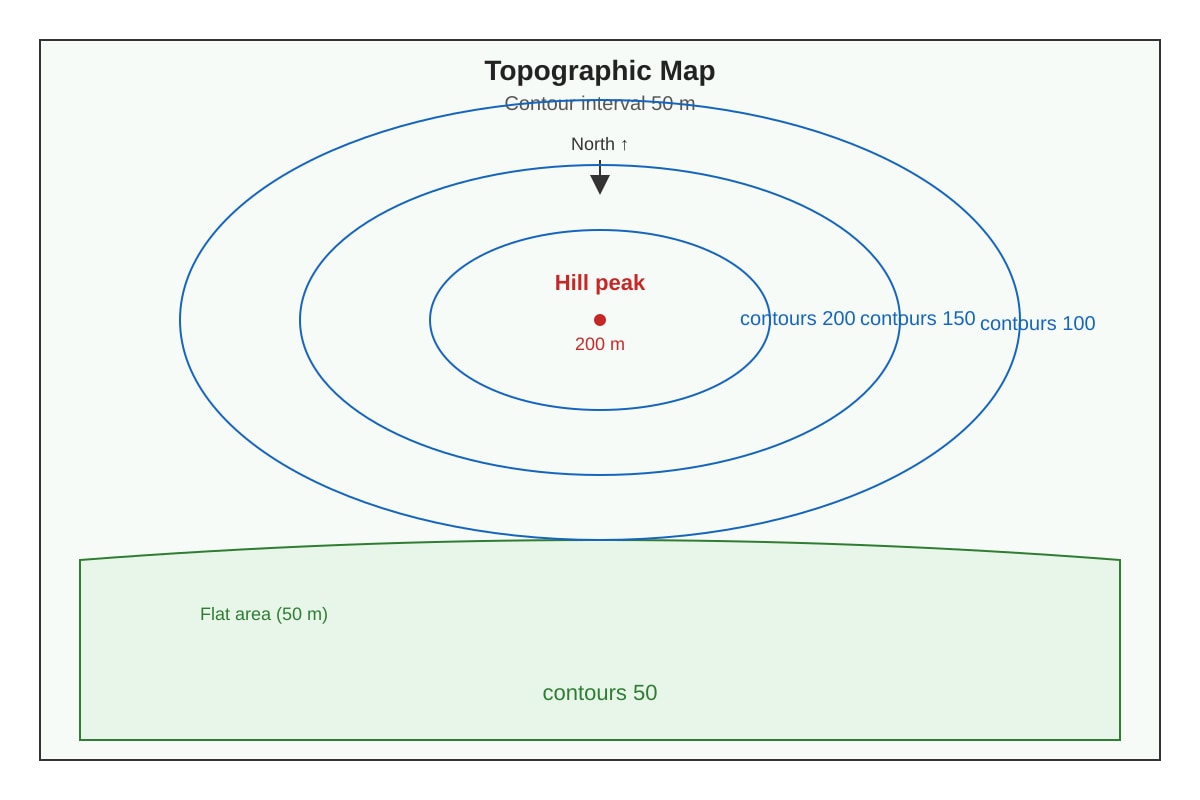
Q4 [2 marks]
Answer: The north has a hill reaching 200 m (concentric contours show high relief); the south is flat at 50 m (widely spaced or single low contour). [1 mark each point]
Teaching note: Relief describes land height variation. Close contours = steep; one low contour = flat.
Q5 [1 mark]
Answer: 1:50,000 (or 1 cm = 500 m)
Teaching note: Map scale shows ratio of map distance to ground distance.
Q6 [2 marks]
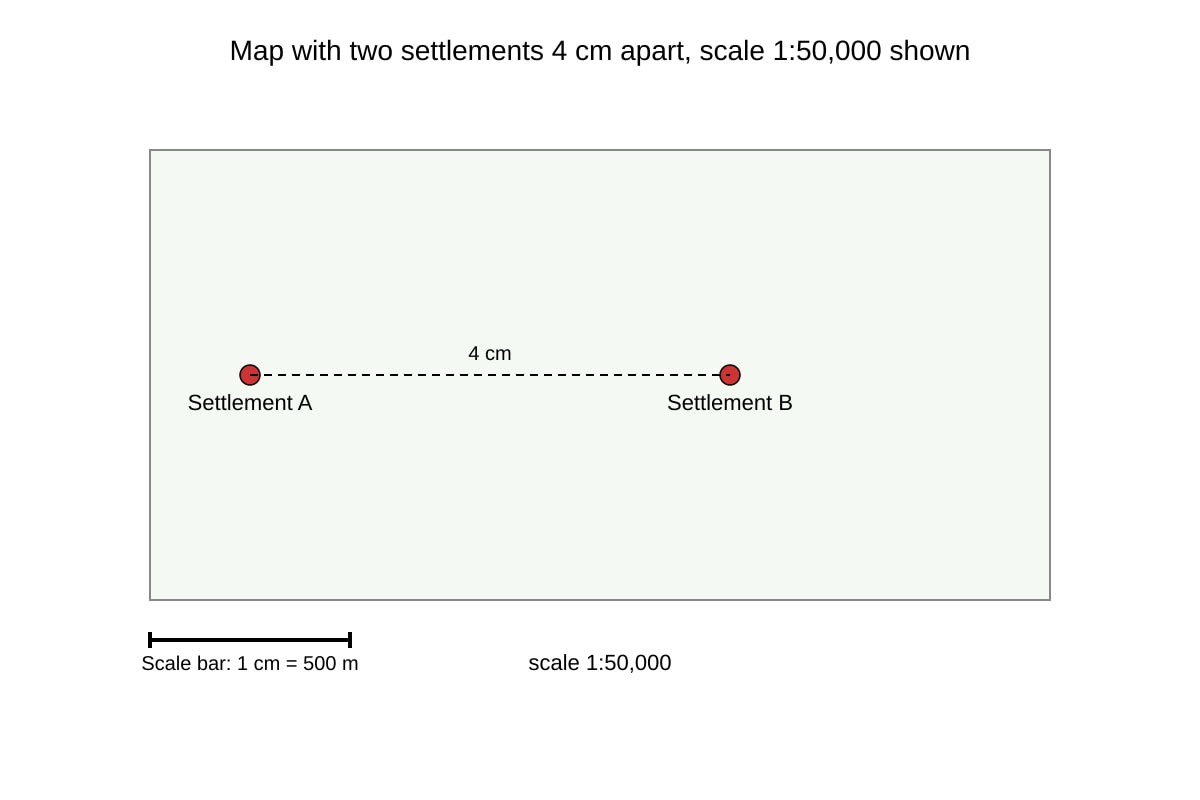
Working: Scale 1:50,000 → 1 cm = 50,000 cm = 0.5 km.
Map distance 4 cm × 0.5 km/cm = 2.0 km.
Answer: 2 km [1 mark method, 1 mark answer]
Teaching note: Convert cm to km: 50,000 cm = 500 m = 0.5 km.
Q7 [2 marks]
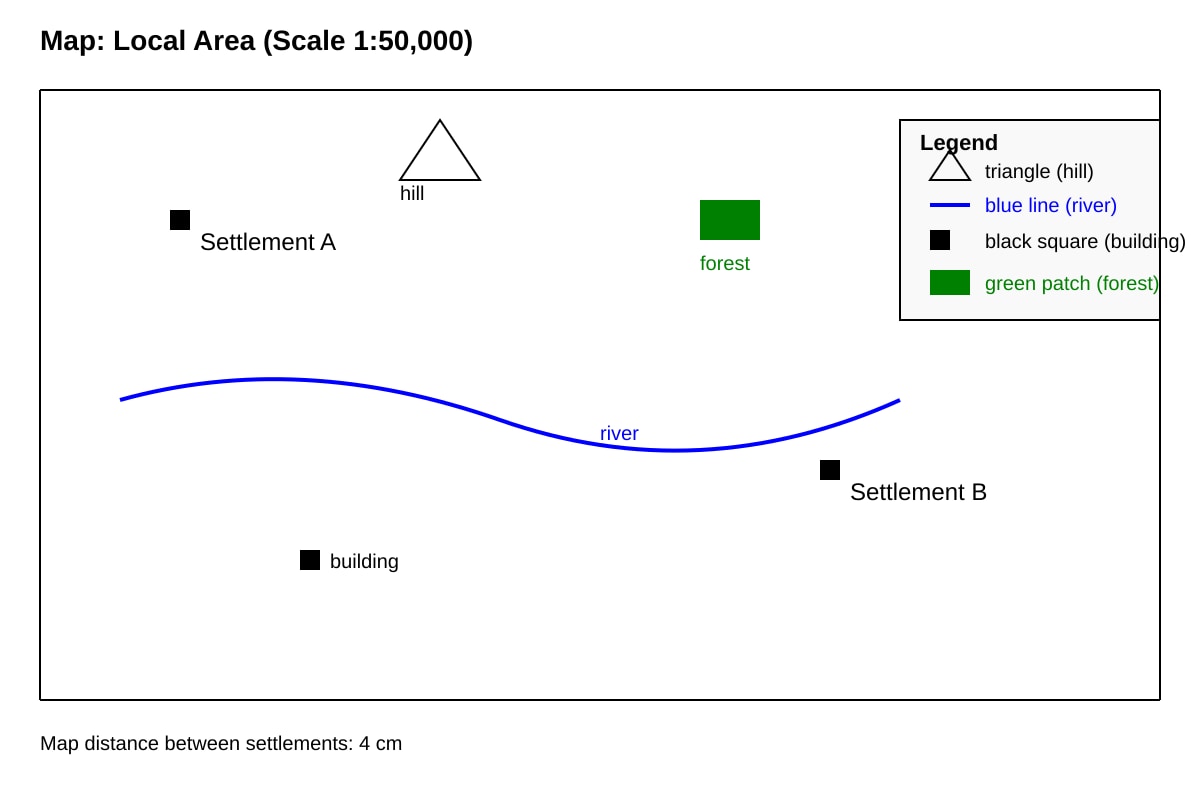
Answer: Triangle = hill; Blue line = river (any two correct: 1 mark each).
Teaching note: Standard topographic symbols. Green patch = forest, black square = building.
Section B: Graph Skills
Q8 [1 mark]
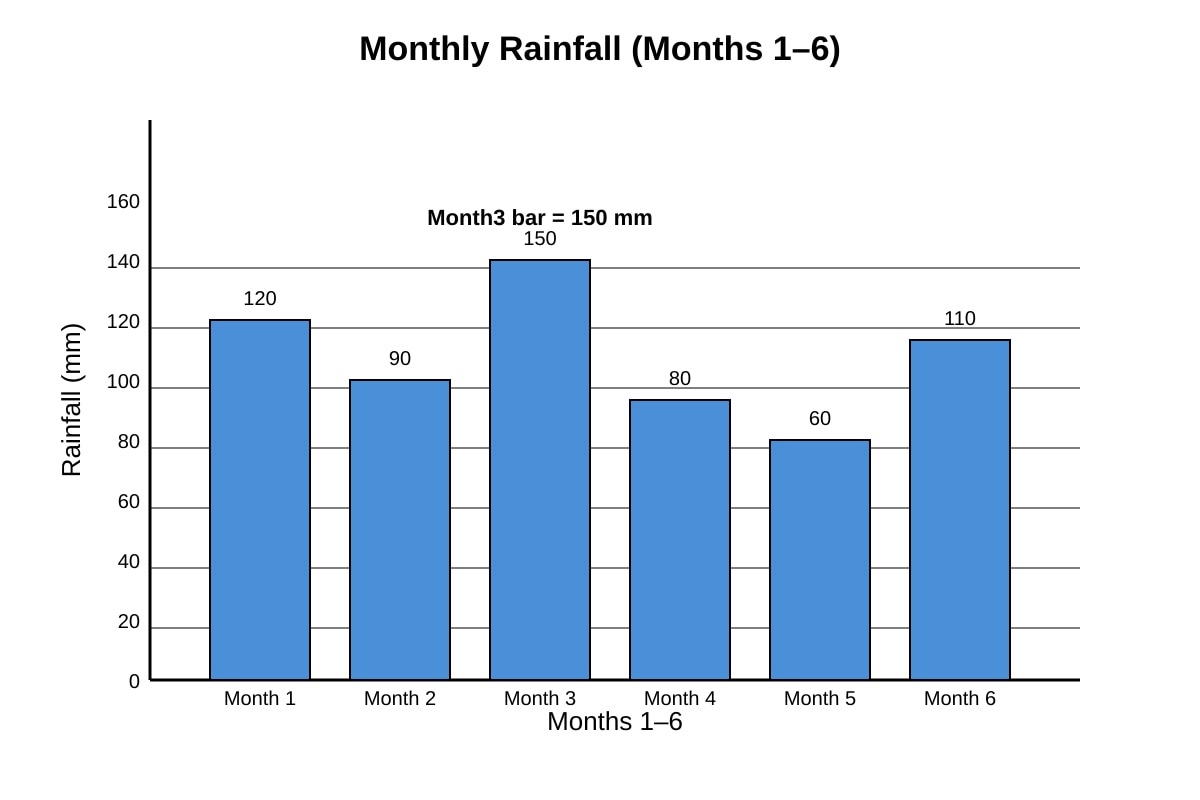
Answer: 150 mm
Teaching note: Read bar height at Month 3 against y-axis.
Q9 [2 marks]
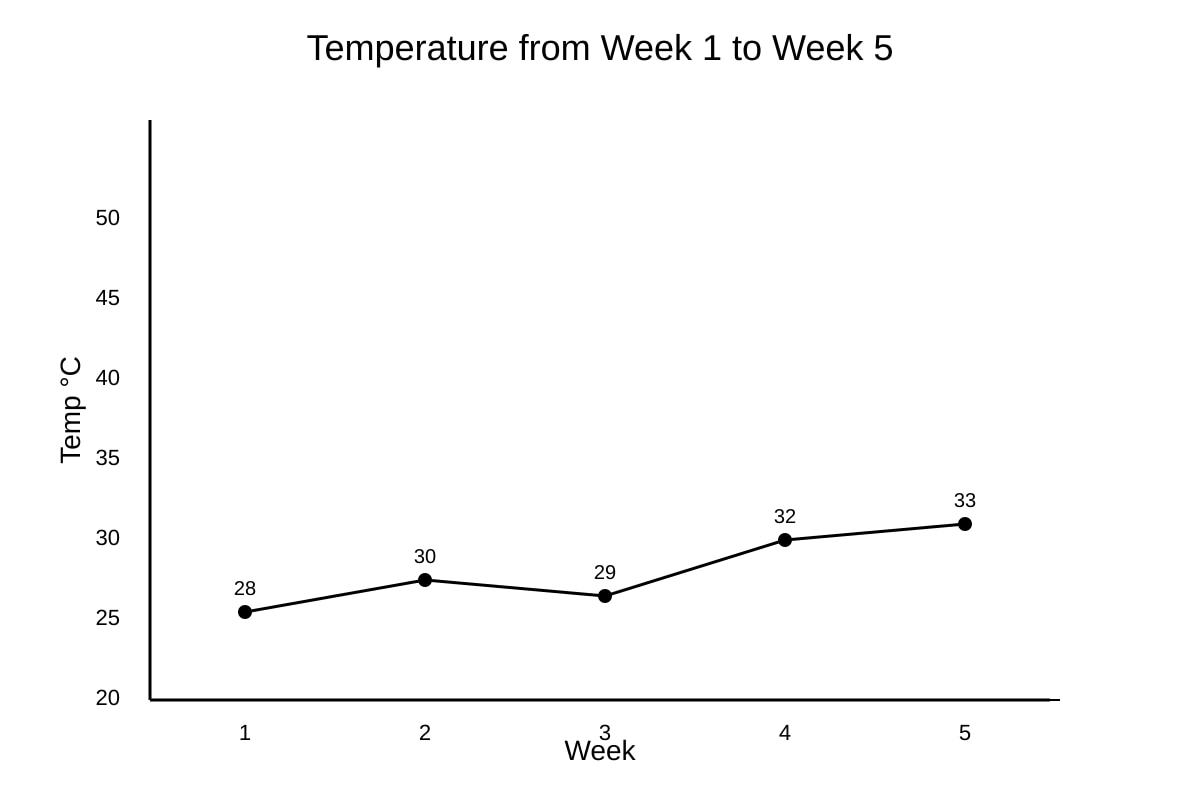
Answer: Temperature generally rises from 28 °C in Week 1 to 33 °C in Week 5, with a small dip at Week 3 (29 °C). [1 mark trend, 1 mark detail]
Teaching note: Describe overall direction and note anomaly.
Q10 [2 marks]
Working: Sum = 5+8+12+15+10 = 50. Count = 5. Mean = 50 ÷ 5 = 10.
Answer: 10 [1 mark working, 1 mark answer]
Q11 [3 marks]
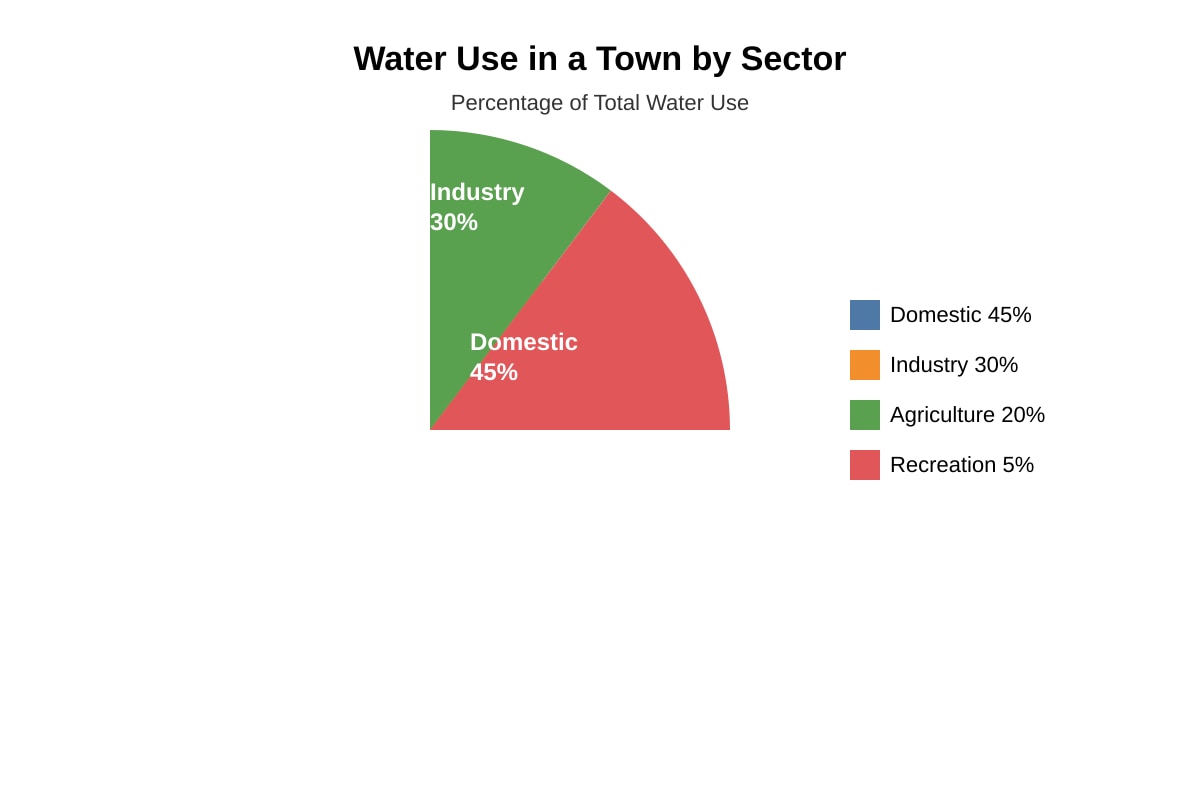
Answer: Domestic use is largest at 45%, industry second at 30%, agriculture 20%, recreation smallest at 5%. Pattern: most water used by domestic and industry combined (75%). [1 mark each for stating top, bottom, comparison]
Teaching note: Use percentages as evidence.
Q12 [2 marks]
Working: Increase = 50 − 20 = 30 m³/s. Trend = rising.
Answer: Increase 30 m³/s, rising trend [1 mark each]
Q13 [2 marks]
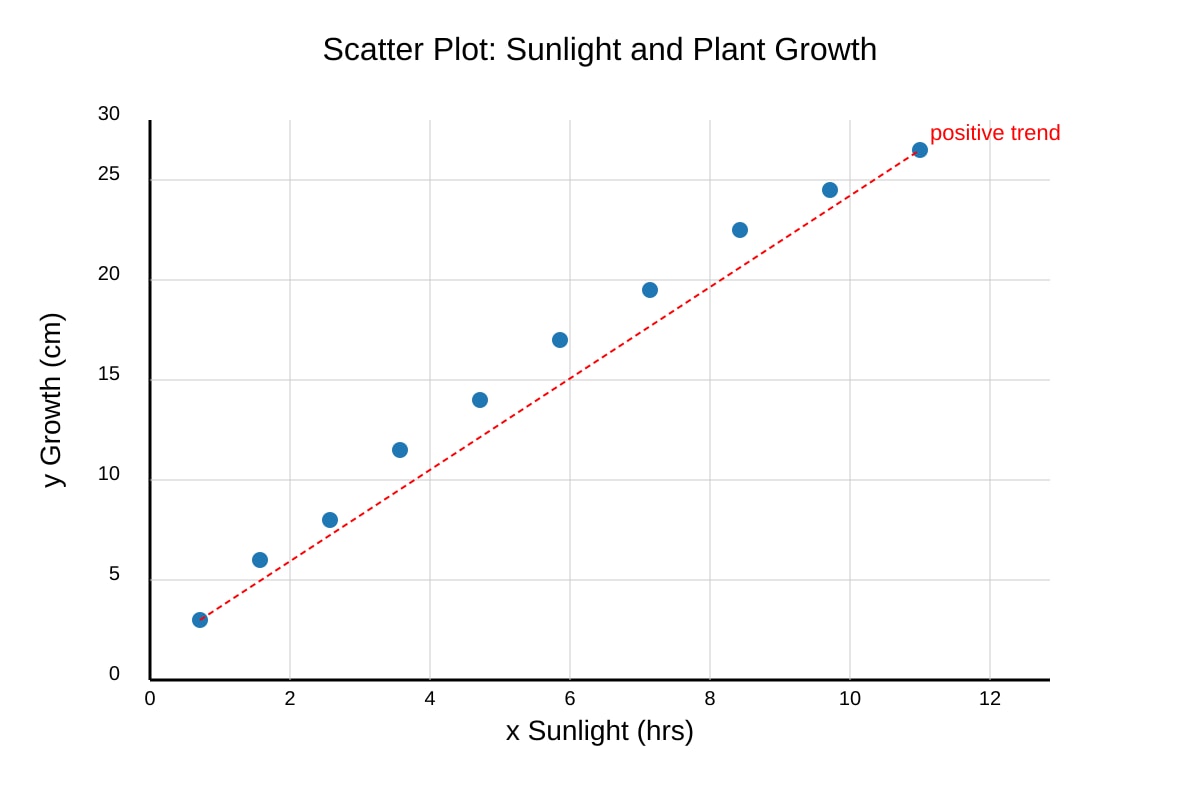
Answer: Positive relationship [1 mark]; as sunlight increases, plant growth increases [1 mark].
Teaching note: Points slope upward to right = positive correlation.
Section C: Data Tables & Fieldwork
Q14 [3 marks]
Answer: Distance from sun increases from Planet A (58) to D (778 million km). Pattern: A<B<C<D, with D much farther than others. [1 mark order, 1 mark values, 1 mark outlier note]
Teaching note: Use comparative language with numbers.
Q15 [2 marks]
Answer: Site X is healthier [1 mark]. Reason: higher dissolved oxygen (8 vs 4 mg/L) and lower turbidity (2 vs 10 NTU) indicate cleaner water [1 mark].
Q16 [2 marks]
Answer: Metal highest (70%). Difference = 70 − 20 = 50 percentage points [1 mark each].
Q17 [2 marks]
Answer: Site 1 (pH 6.5) is closer to neutral (7) [1 mark]. Difference 0.5 vs 1.0 for Site 2 [1 mark].
Q18 [3 marks]
Answer: As rainfall decreases (120→40 mm), temperature increases (28→32 °C); inverse relationship. [1 mark pattern, 1 mark data, 1 mark relationship type]
Q19 [2 marks]
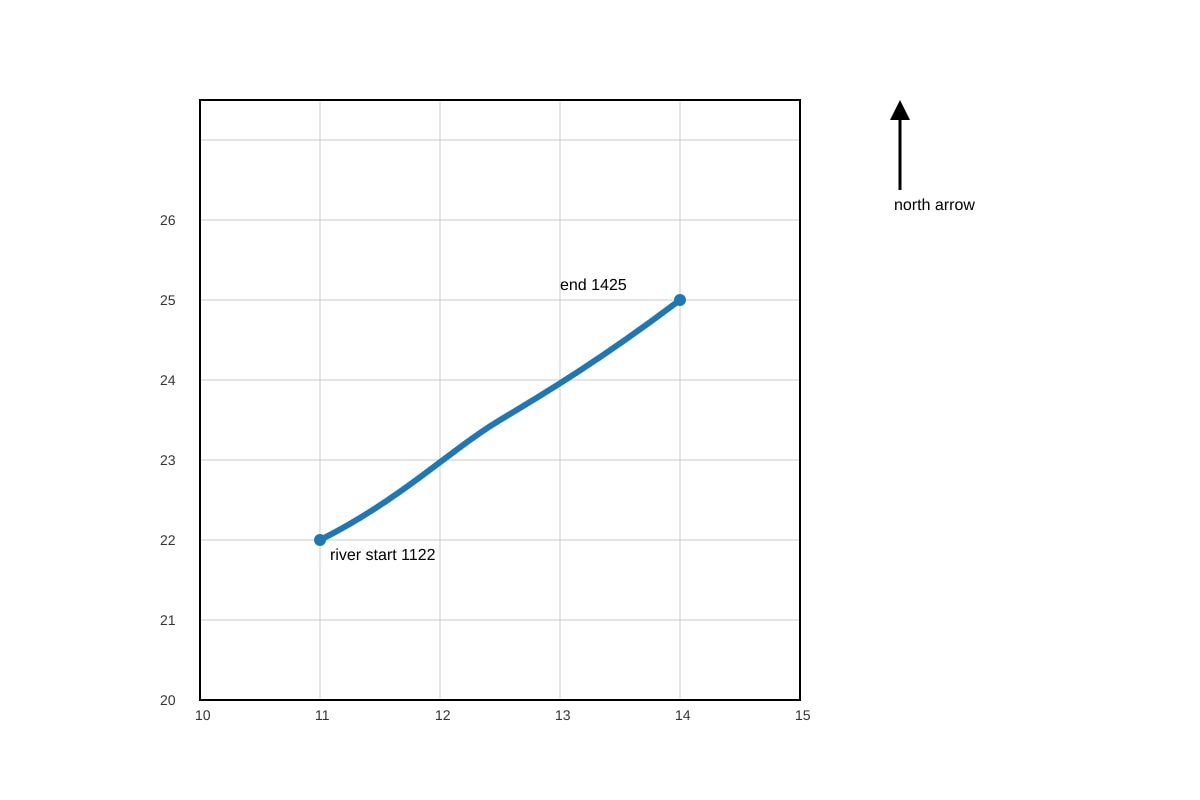
Answer: General direction is north-east [2 marks]. From 1122 (south-west) to 1425 (north-east) using grid increase.
Q20 [3 marks]
Working: R = 200 × 150 = 30,000 L/day. S = 350 × 120 = 42,000 L/day.
Comparison: S uses 12,000 L/day more than R.
Answer: R 30,000 L; S 42,000 L; S higher [1 mark each]