From Real Exams Quiz
Secondary 1 Geography Human Geography Quiz
Free Sec 1 Geography Human Geography quiz, Nemo3 Exam version, with questions, answers, and syllabus-aligned practice for Singapore students.
These static practice materials are generated from the site's syllabus and paper-generation workflow, with source and model context shown so students and parents can evaluate the material before use.
Questions
Secondary 1 Geography Quiz - Human Geography
Name: ___________________________
Class: ___________________________
Date: ___________________________
Score: _____ / 30
Duration: 45 minutes
Total Marks: 30
Instructions:
- Answer all questions.
- Write your answers in the spaces provided.
- For questions requiring diagrams or maps, refer to the provided figures.
- The number of marks is given in brackets [ ] at the end of each question or part question.
Section A: Multiple Choice Questions (5 × 1 = 5 marks)
1. Which of the following best describes the term 'urbanisation'? [1]
A. The movement of people from urban to rural areas
B. The increase in the proportion of people living in urban areas
C. The decrease in population density in cities
D. The growth of rural settlements into towns
Answer: _______
2. In Singapore's context, which factor has been the main driver of urbanisation since independence? [1]
A. Natural population increase
B. Rural-to-urban migration
C. International immigration
D. Reclassification of rural areas
Answer: _______
3. The diagram below shows a simplified urban land use model. Which zone is typically characterised by high-rise residential buildings and lower land values? [1]
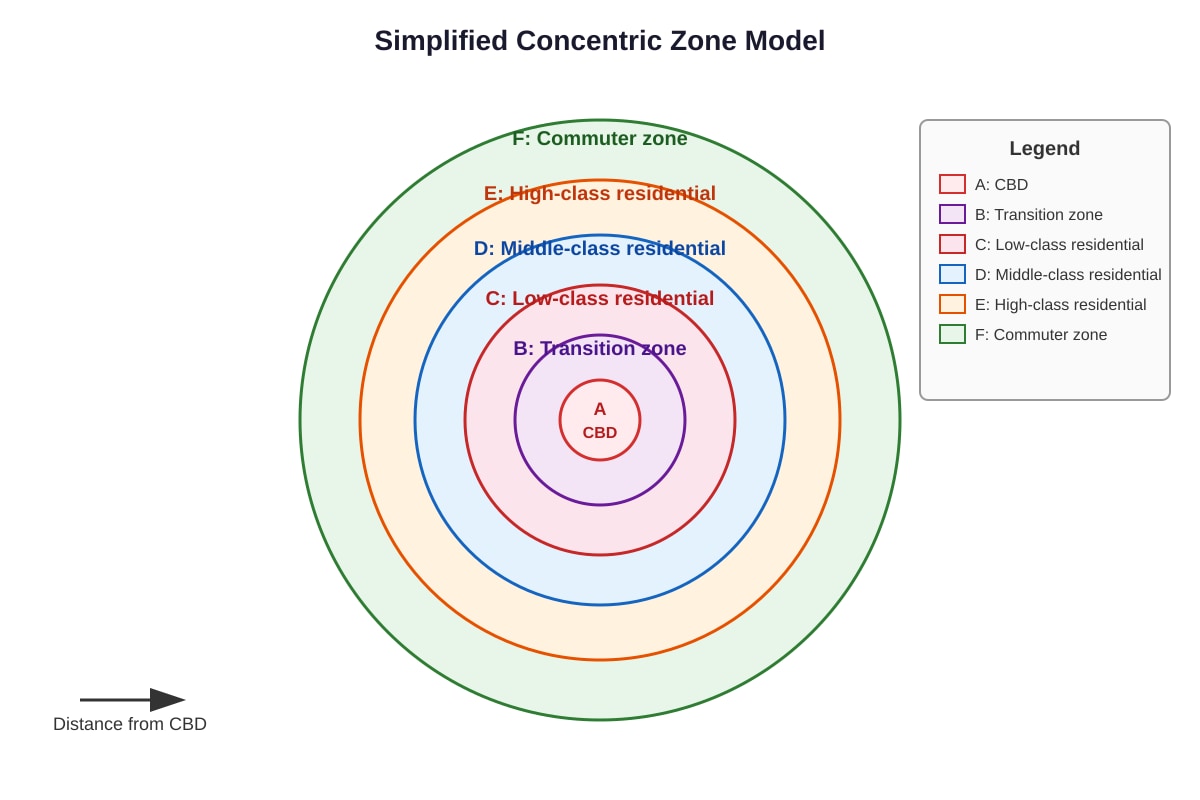
Generated diagram for Q3.
A. Zone A
B. Zone B
C. Zone C
D. Zone E
Answer: _______
4. Which of the following is a pull factor for rural-to-urban migration in developing countries? [1]
A. Lack of healthcare in rural areas
B. Better employment opportunities in cities
C. Natural disasters in rural areas
D. Land scarcity in villages
Answer: _______
5. Singapore's public housing programme by HDB is an example of which urban planning strategy? [1]
A. Urban renewal
B. Urban sprawl containment
C. Provision of affordable housing
D. Decentralisation of commercial activities
Answer: _______
Section B: Structured Questions (5 × 3 = 15 marks)
6. Study the photograph below showing a squatter settlement in a developing country city.
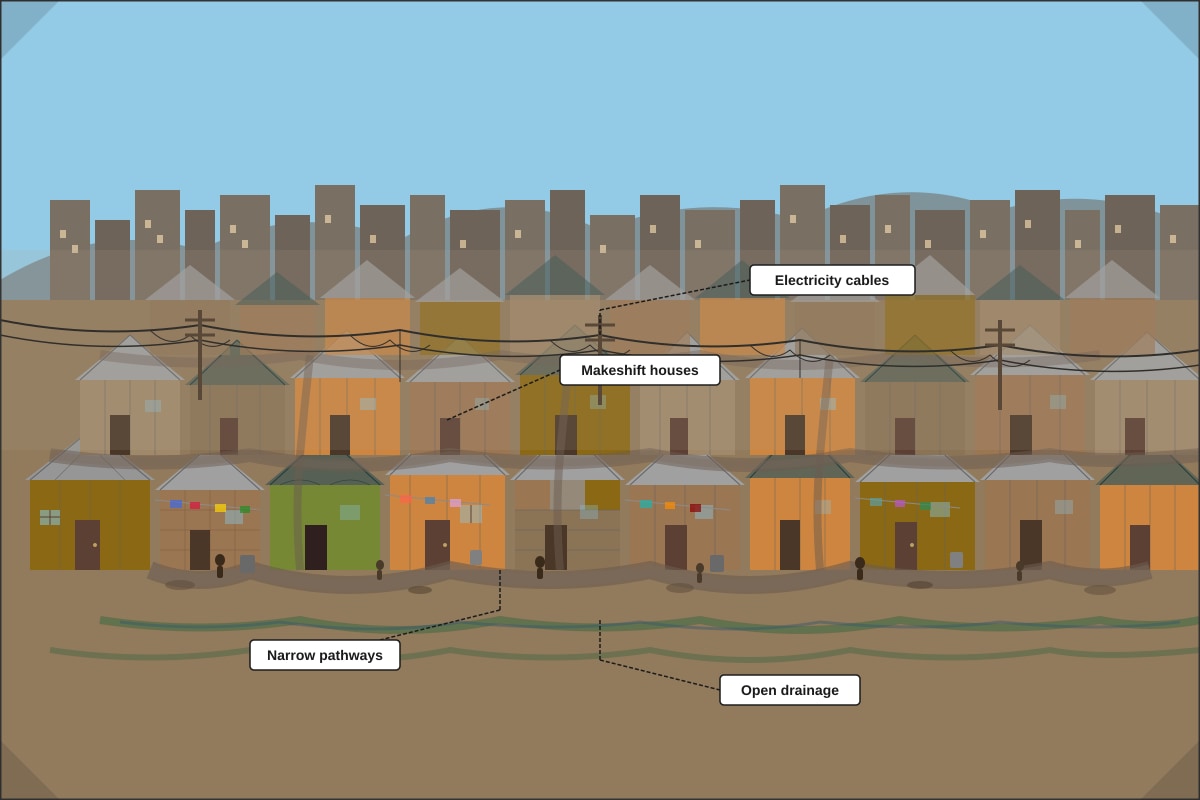
Generated source_image for Q6.
(a) Describe two characteristics of the housing shown in the photograph. [2]
(b) Explain one reason why squatter settlements develop in cities of developing countries. [1]
7. The table below shows the percentage of population living in urban areas for selected countries in 1990 and 2020.
| Country | 1990 (%) | 2020 (%) |
|---|---|---|
| Country A | 25 | 45 |
| Country B | 70 | 82 |
| Country C | 15 | 35 |
| Country D | 55 | 75 |
(a) Which country experienced the greatest percentage point increase in urban population between 1990 and 2020? [1]
(b) Calculate the percentage point increase for Country C. [1]
(c) Suggest one reason for the trend shown in Country A. [1]
8. Explain two challenges that rapid urbanisation poses for city planners in developing countries. [3]
9. Singapore has implemented the concept of 'self-contained new towns'. Describe two features of a self-contained new town. [2]
(b) Explain how self-contained new towns help reduce traffic congestion. [1]
10. Study the map extract below showing part of a city.
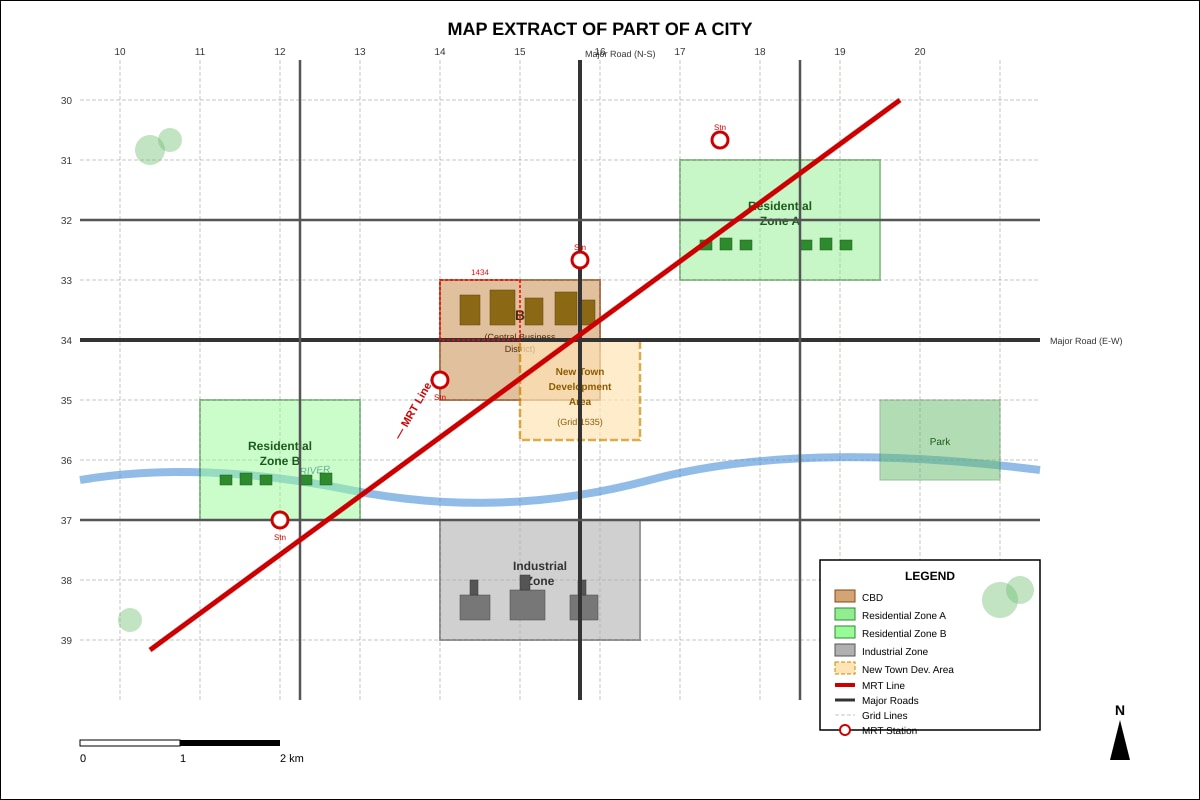
Generated map for Q10.
(a) State the 4-figure grid reference of the CBD. [1]
(b) The new town development area is located in grid square 1535. Describe the locational advantages of this site for a new residential town. [2]
Section C: Data Response and Extended Questions (2 × 5 = 10 marks)
11. The graph below shows the urban population growth rate (%) for three regions from 1950 to 2050 (projected).
Image pending generation: graph for Q11.
(a) Describe the trend in urban population growth rate for Africa from 1950 to 2050. [2]
(b) Compare the urban population growth rates of Asia and Europe in 2020. [1]
(c) Explain one reason why Africa's urban population growth rate remains higher than Europe's. [2]
12. "Urbanisation brings more benefits than problems for a country."
Using examples you have studied, discuss whether you agree with this statement. [5]
Section D: Additional Structured Questions (8 × 1.25 = 10 marks)
13. Define the term 'counter-urbanisation'. [1]
14. The diagram below shows a sector model of urban land use (Hoyt model).
Image pending generation: diagram for Q14.
(a) Identify the sector labelled X that extends along a major transport route. [1]
(b) Explain why industries tend to locate along transport routes in the Hoyt model. [1]
15. Study the population pyramid below for a rapidly urbanising developing country.
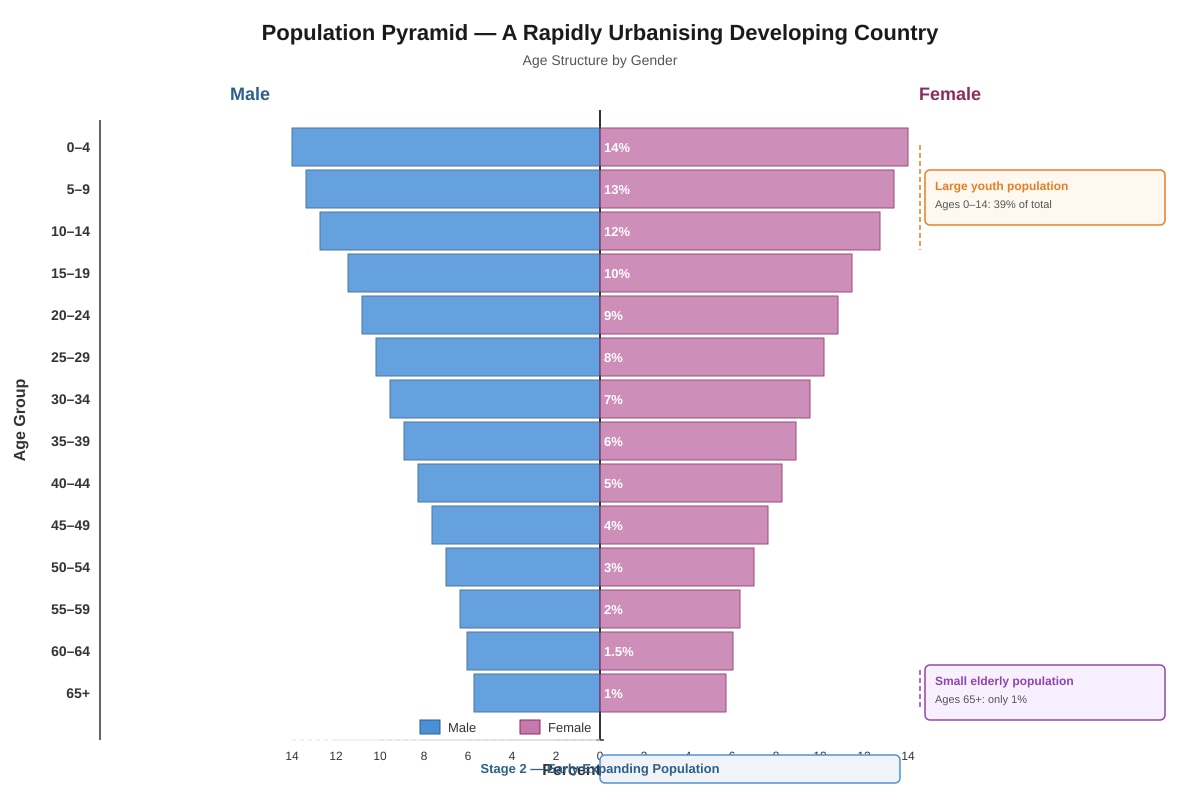
Generated graph for Q15.
(a) Describe the shape of the population pyramid. [1]
(b) Explain how this population structure contributes to rapid urbanisation. [1]
16. State two differences between a shanty town and a formal residential suburb. [2]
17. Singapore's Concept Plan is a strategic land use plan reviewed every 10 years. State one key objective of the Concept Plan. [1]
18. The photograph below shows a gentrified neighbourhood in an inner-city area.
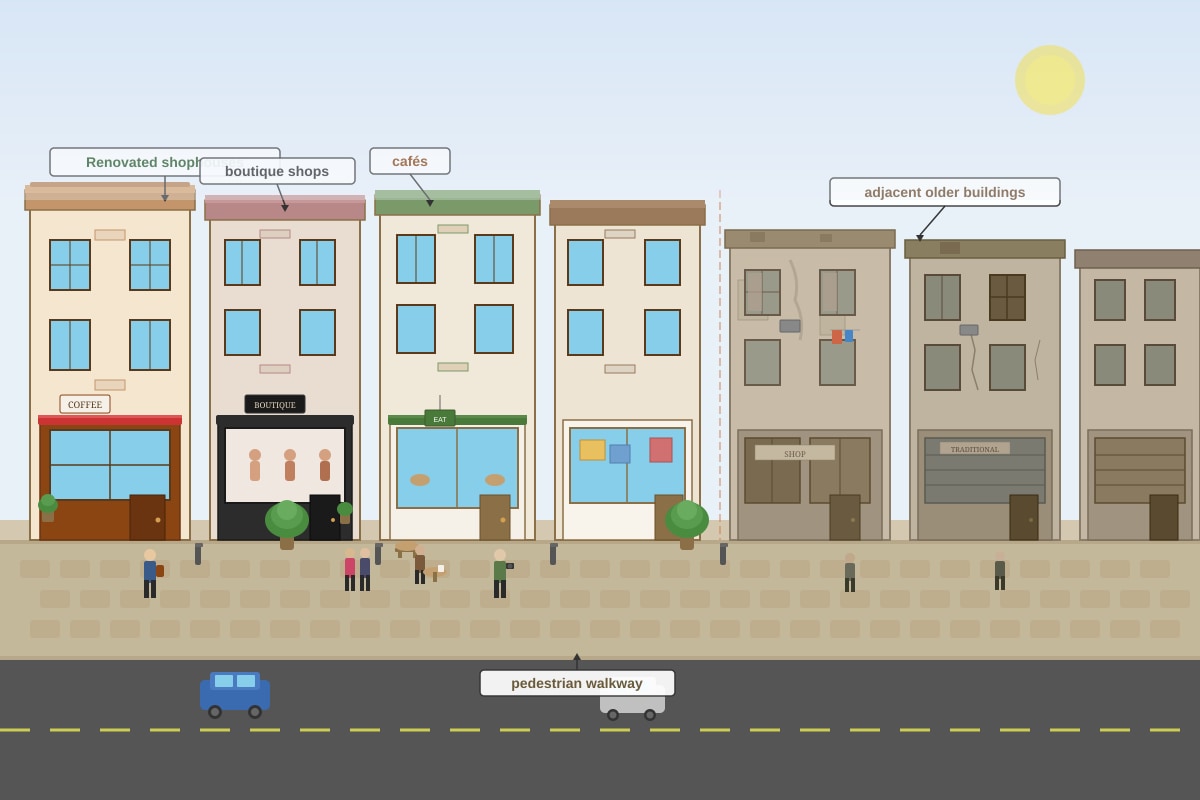
Generated source_image for Q18.
(a) Identify one visible change in the built environment that indicates gentrification. [1]
(b) Explain one negative impact of gentrification on original residents. [1]
19. Explain the term 'urban sprawl' and state one environmental consequence. [2]
20. Study the satellite image below showing a city's growth over 30 years.
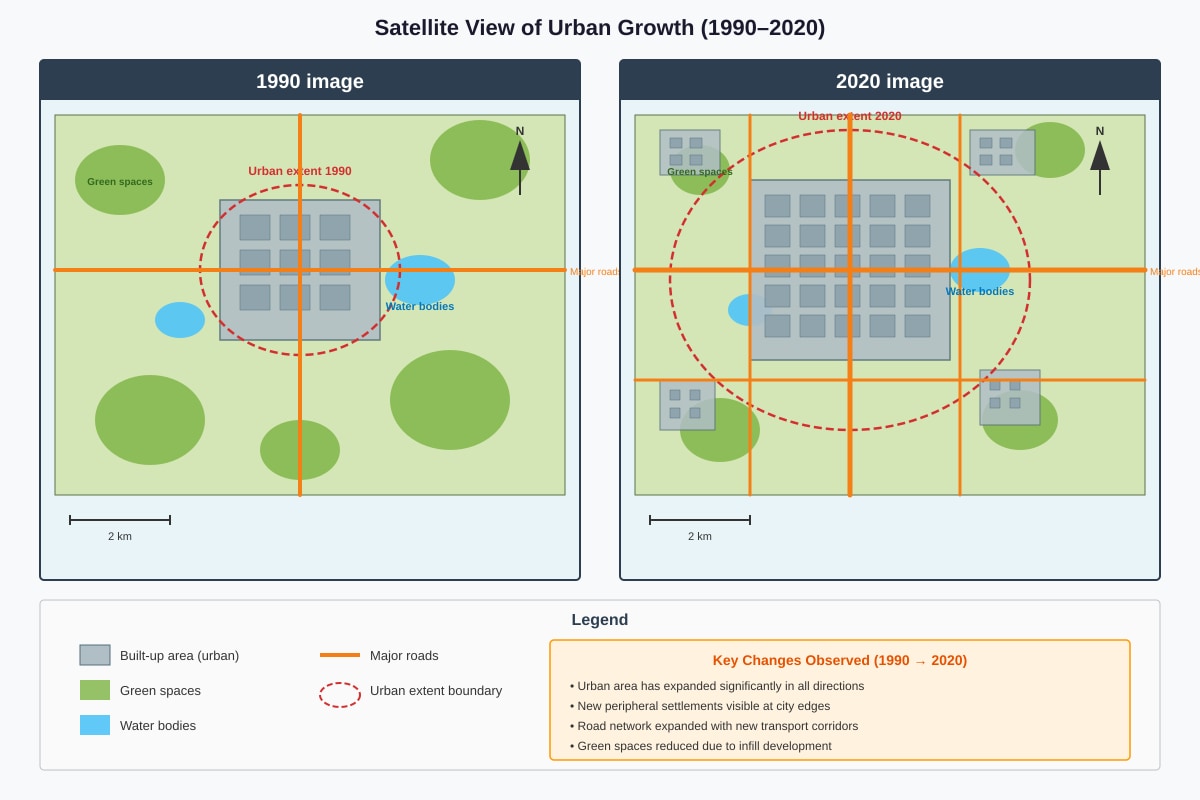
Generated map for Q20.
(a) Describe one way the urban area has changed between 1990 and 2020. [1]
(b) Suggest one strategy the city government could use to manage this growth sustainably. [1]
End of Quiz
Answers
Secondary 1 Geography Quiz - Human Geography (Answer Key)
Total Marks: 30
Section A: Multiple Choice Questions (5 × 1 = 5 marks)
1. Answer: B
Explanation: Urbanisation is defined as the increase in the proportion of a country's population living in urban areas. It is a process, not just movement. Option A describes counter-urbanisation. Option C is incorrect as urbanisation typically increases population density in cities. Option D describes a result, not the definition.
Mark: 1 for correct option.
2. Answer: C
Explanation: Since independence in 1965, Singapore's urbanisation has been driven significantly by international immigration (foreign talent, work permit holders, and permanent residents) alongside natural increase. While rural-to-urban migration occurred historically, Singapore had limited rural areas by 1965. Reclassification (D) plays a minor role. The key driver in recent decades has been immigration to support economic growth.
Mark: 1 for correct option.
Common mistake: Students often choose B (rural-to-urban migration) based on general developing country models, but Singapore's context is unique.
3. Answer: C
Explanation: In the concentric zone model (Burgess model), Zone C (low-class residential) is typically characterised by older, high-density housing, lower land values, and proximity to the transition zone/industries. Zone A is the CBD (highest land values, commercial). Zone B is the transition zone (mixed use, slums/industry). Zone E is high-class residential (low density, high land values).
Mark: 1 for correct option.
Note: The question tests understanding of land value gradients and residential patterns in the Burgess model.
4. Answer: B
Explanation: Pull factors attract people to cities. Better employment opportunities (B) is a classic pull factor. Options A, C, and D are push factors (conditions that drive people away from rural areas).
Mark: 1 for correct option.
Key concept: Push vs pull factors in migration theory.
5. Answer: C
Explanation: HDB's public housing programme primarily provides affordable, subsidised housing for Singapore citizens. While it contributes to urban renewal (A) and contains sprawl (B) indirectly, its core objective is affordable housing provision. Decentralisation (D) relates more to regional centres like Jurong Lake District.
Mark: 1 for correct option.
Section B: Structured Questions (5 × 3 = 15 marks)
6. (a) Any two of the following for 2 marks (1 mark each):
- Makeshift/temporary building materials (e.g., corrugated metal, wood, plastic sheets)
- High density/overcrowding of housing units
- Irregular/unplanned layout with narrow pathways
- Lack of basic infrastructure (sanitation, piped water, proper electricity)
- Houses built on marginal land (steep slopes, near railways, flood-prone areas)
Marking: 1 mark per valid characteristic observed from the photograph. Must be descriptive, not explanatory.
(b) Any one of the following for 1 mark:
- Rapid rural-to-urban migration exceeds the city's ability to provide formal housing
- Urban poor cannot afford formal housing due to high land costs/rents
- Lack of urban planning and housing policies for low-income groups
- Natural population increase in cities outpaces housing supply
Marking: 1 mark for a clear, valid reason.
Teaching note: Link to push-pull factors and urbanisation rates exceeding infrastructure development.
7. (a) Answer: Country A, C, or D (all have 20 percentage point increase: 45-25=20, 35-15=20, 75-55=20)
Mark: 1 for correct identification of any one of the three countries.
Working: Country A: 20%, Country B: 12%, Country C: 20%, Country D: 20%.
Note: Question phrasing "which country" (singular) but three countries tie. Accept any of A, C, or D.
(b) Answer: 20 percentage points (35% - 15% = 20%)
Mark: 1 for correct calculation with units.
Working: 2020% - 1990% = 35 - 15 = 20 percentage points.
Note: "Percentage points" not "percent" - important distinction.
(c) Any one valid reason for 1 mark:
- Rapid industrialisation creating factory jobs in urban areas
- Rural-to-urban migration due to push factors (poverty, lack of services) and pull factors (jobs, education)
- Government policies promoting urban development
- Natural increase in urban areas due to better healthcare
Marking: 1 mark for a plausible reason linked to Country A's context (developing country with low initial urbanisation).
8. Any two challenges, well-explained, for 3 marks (1.5 marks each, or 1+2 split):
Challenge 1: Housing shortage and slum formation
Rapid urbanisation leads to demand for housing outstripping supply, causing growth of squatter settlements/slums with poor living conditions. (1 mark for identification, 0.5 for elaboration)
Challenge 2: Infrastructure strain (transport, water, sanitation)
Existing infrastructure cannot cope with population growth, leading to traffic congestion, water shortages, inadequate waste disposal, and pollution. (1 mark for identification, 0.5 for elaboration)
Challenge 3: Unemployment and informal sector growth
Job creation lags behind labour force growth, resulting in urban unemployment and expansion of the informal economy. (1 mark for identification, 0.5 for elaboration)
Challenge 4: Environmental degradation
Air/water pollution, loss of green space, waste management issues. (1 mark for identification, 0.5 for elaboration)
Marking: 3 marks total. Award 1 mark per challenge identified + 0.5 for explanation, up to 3 marks. Or 1.5 marks per well-developed challenge (identification + explanation + example).
Expected response structure: Identify challenge → Explain why it occurs due to rapid urbanisation → Optional: give example.
9. (a) Any two features for 2 marks (1 mark each):
- Has its own town centre with shopping, civic, and commercial facilities
- Provides a range of housing types (HDB flats, condominiums)
- Includes employment opportunities (industrial parks, business parks) within or near the town
- Well-served by public transport (MRT, bus interchange) connecting to other towns and CBD
- Has comprehensive amenities: schools, healthcare (polyclinics/hospitals), parks, community centres
- Designed to reduce need for residents to travel to CBD for daily needs
Marking: 1 mark per distinct feature. Must be specific to "self-contained" concept.
(b) Answer: Self-contained new towns provide jobs, shopping, schools, and recreation within the town, so residents do not need to commute to the CBD for daily activities, reducing peak-hour traffic on major arterial roads and expressways. [1]
Marking: 1 mark for clear link between self-containment and reduced commuting/CBD-bound trips.
Key concept: Decentralisation of activities → shorter trips → less congestion.
10. (a) Answer: [Depends on map - e.g., 1234]
Marking: 1 mark for correct 4-figure grid reference (easting first, then northing, lower-left corner of CBD grid square).
Method: Read easting (vertical grid line) first → 12, then northing (horizontal grid line) → 34. Answer: 1234.
Common error: Reversing order (3412) or using 6-figure reference.
(b) Any two locational advantages for 2 marks (1 mark each):
- Near MRT line/public transport → easy accessibility for residents/commuters
- Near major roads → good connectivity to other parts of the city
- Away from industrial zone → less pollution, better living environment
- Near existing residential zones → can share amenities, established community
- Flat land → easier and cheaper construction
Marking: 1 mark per valid advantage with brief explanation. Must link to grid square 1535 features.
Section C: Data Response and Extended Questions (2 × 5 = 10 marks)
11. (a) Answer: Africa's urban population growth rate shows an overall declining trend from 1950 to 2050, starting at approximately 4.5% in 1950, falling to around 3.5% in 2020, and projected to decline further to about 3.0% by 2050. Despite the decline, it remains the highest among the three regions throughout the period. [2]
Marking: 1 mark for identifying declining trend, 1 mark for using data (years and percentages) to support. Must mention "highest among three regions" for full marks.
(b) Answer: In 2020, Asia's urban population growth rate (~2.0%) is higher than Europe's (~0.7%), but both are lower than Africa's (~3.5%). Asia's rate is approximately three times that of Europe. [1]
Marking: 1 mark for valid comparison using data. Must mention both regions' approximate rates.
(c) Answer: Africa has higher fertility rates and a younger population structure, leading to high natural increase. Combined with rapid rural-to-urban migration driven by push factors (poverty, conflict, climate stress) and pull factors (perceived urban opportunities), this sustains high urban growth. Europe has low fertility, ageing population, and is already highly urbanised (~75%), so limited scope for further rapid urban growth. [2]
Marking: 1 mark for demographic reason (fertility/youthful population), 1 mark for migration/urbanisation level contrast with Europe. Must explain why higher than Europe specifically.
12. Level-marked response (5 marks):
Level 1 (1-2 marks): Simple statements listing benefits and/or problems without development. No examples or limited examples.
Level 2 (3-4 marks): Developed explanation of benefits and problems with at least one example. Some balance but may lean to one side.
Level 3 (5 marks): Well-balanced discussion with specific examples (e.g., Singapore, Mumbai, London). Clear evaluative conclusion weighing benefits vs problems. Uses geographical terminology.
Indicative content:
Benefits: Economic growth (agglomeration economies), better access to services (healthcare, education), innovation hubs, cultural exchange, infrastructure efficiency. Example: Singapore's urbanisation enabled economic transformation from port city to global hub.
Problems: Housing shortages, traffic congestion, pollution, social inequality, slums, strain on resources. Example: Mumbai's Dharavi slum, Jakarta's flooding/subsidence.
Evaluation: Depends on governance, planning, pace of urbanisation. Well-managed (Singapore) → benefits outweigh problems. Poorly managed (many developing cities) → problems dominate. Sustainable urban planning is key.
Marking: Use level descriptors. Award 5 marks for balanced, exemplified, evaluative response.
Key terms expected: Agglomeration economies, rural-urban migration, infrastructure, sustainability, governance.
Section D: Additional Structured Questions (8 × 1.25 = 10 marks)
13. Answer: Counter-urbanisation is the movement of people from urban areas to rural areas or smaller towns, leading to a decrease in the proportion of population living in large cities. [1]
Marking: 1 mark for definition including movement direction (urban to rural) and demographic effect.
Note: Distinguish from suburbanisation (movement to suburbs within urban area).
14. (a) Answer: Industrial sector (or low-class residential sector, depending on diagram label X - typically industrial sector follows transport routes)
Marking: 1 mark for correct sector identification based on Hoyt model.
Note: In Hoyt model, industrial sector extends along transport routes (railways, canals, roads).
(b) Answer: Industries locate along transport routes to minimise transport costs for raw materials and finished goods, and to facilitate movement of workers. [1]
Marking: 1 mark for transport cost minimisation or accessibility reason.
Key concept: Least-cost location theory (Weber) applied to sector model.
15. (a) Answer: The pyramid has a wide base (high birth rate), steeply sloping sides (high death rate, low life expectancy), and a narrow top (small elderly population). It is a classic expanding/expansive pyramid shape. [1]
Marking: 1 mark for describing wide base, steep sides, narrow top. Must mention shape name or all three features.
(b) Answer: The large youth population (0-14 years) creates a 'youth bulge'. As these young people enter working age (15-24), they migrate to cities for jobs and education, driving rapid urbanisation. High birth rates also mean continued population growth fuelling urban expansion. [1]
Marking: 1 mark for linking youth bulge to rural-urban migration and urban growth.
Key concept: Demographic momentum and migration.
16. Any two differences for 2 marks (1 mark each):
| Feature | Shanty Town | Formal Residential Suburb |
|---|---|---|
| Housing quality | Makeshift, temporary materials | Permanent, regulated construction |
| Land tenure | Illegal/informal occupation | Legal ownership/lease |
| Infrastructure | Lacking (water, sanitation, electricity) | Full provision (piped water, sewerage, power) |
| Layout | Unplanned, irregular, high density | Planned, grid/curvilinear, lower density |
| Services | Minimal/absent (schools, clinics) | Comprehensive amenities |
| Location | Marginal land (hills, swamps, outskirts) | Designated residential zones |
Marking: 1 mark per valid contrasting pair. Must be clear difference, not just description of one.
17. Any one key objective for 1 mark:
- Ensure sufficient land for long-term population and economic growth
- Balance development with environmental conservation
- Provide a high-quality living environment
- Maintain economic competitiveness through strategic land allocation
- Guide sustainable development over 40-50 year horizon
Marking: 1 mark for any valid Concept Plan objective.
Context: Singapore's Concept Plan (now integrated into Long-Term Plan Review) is strategic, long-term (40-50 years), reviewed every 10 years.
18. (a) Any one visible change for 1 mark:
- Renovation/restoration of historic buildings (shophouses)
- New commercial uses (cafes, boutiques, galleries) replacing traditional trades
- Pedestrianisation/streetscape improvements
- Upgraded building facades, new signage
- Presence of higher-income demographic (implied by business types)
Marking: 1 mark for specific visible change from photograph.
(b) Answer: Rising property values and rents displace original lower-income residents and traditional businesses who can no longer afford to live/work there, leading to loss of community and cultural heritage. [1]
Marking: 1 mark for displacement/affordability impact on original residents.
Key concept: Gentrification → economic displacement → social change.
19. Answer: Urban sprawl is the uncontrolled, low-density expansion of urban areas into surrounding rural land, often characterised by car-dependent development, leapfrog patterns, and separation of land uses. One environmental consequence is loss of agricultural land and natural habitats/biodiversity. [2]
Marking: 1 mark for definition (uncontrolled, low-density, rural land conversion), 1 mark for environmental consequence (habitat loss, farmland loss, increased emissions from car dependency, water runoff issues).
20. (a) Any one change for 1 mark:
- Significant outward expansion of built-up area (urban extent increased)
- Infill development within 1990 boundary (densification)
- New peripheral settlements along transport corridors
- Loss of green space/agricultural land
- Emergence of polycentric pattern (multiple centres)
Marking: 1 mark for accurate description of change visible in satellite comparison.
(b) Any one sustainable strategy for 1 mark:
- Implement urban growth boundary/green belt to contain sprawl
- Promote transit-oriented development (TOD) around MRT stations
- Encourage high-density, mixed-use development in existing areas (infill)
- Protect green corridors and nature reserves
- Invest in public transport to reduce car dependency
- Brownfield redevelopment before greenfield development
Marking: 1 mark for valid, specific strategy linked to managing growth sustainably.
Key concept: Compact city, smart growth, sustainable urban planning.
End of Answer Key
Free quiz and exam paper access
Enter your details to view this paper
Your access is remembered on this device.