From Real Exams Quiz
Secondary 1 Geography Human Geography Quiz
Free Sec 1 Geography Human Geography quiz, Kimi2.6 Exam version, with questions, answers, and syllabus-aligned practice for Singapore students.
These static practice materials are generated from the site's syllabus and paper-generation workflow, with source and model context shown so students and parents can evaluate the material before use.
Questions
Secondary 1 Geography Quiz - Human Geography
Name: _____________________________ Class: __________ Date: __________
Duration: 35 minutes
Total Marks: 40 marks
Score: _______/40
Instructions
- Answer all questions.
- Write your answers in the spaces provided.
- For questions requiring extended responses, use complete sentences and include relevant geographical terms.
Section A: Multiple Choice (Questions 1-5)
Choose the correct answer for each question. Write the letter in the box provided. (1 mark each)
1. Which of the following best defines "population density"?
| A The total number of people living in a country |
| B The number of people per unit area of land |
| C The rate at which a population increases annually |
| D The movement of people from rural to urban areas |
Answer: XXX
2. The diagram below shows a population pyramid.
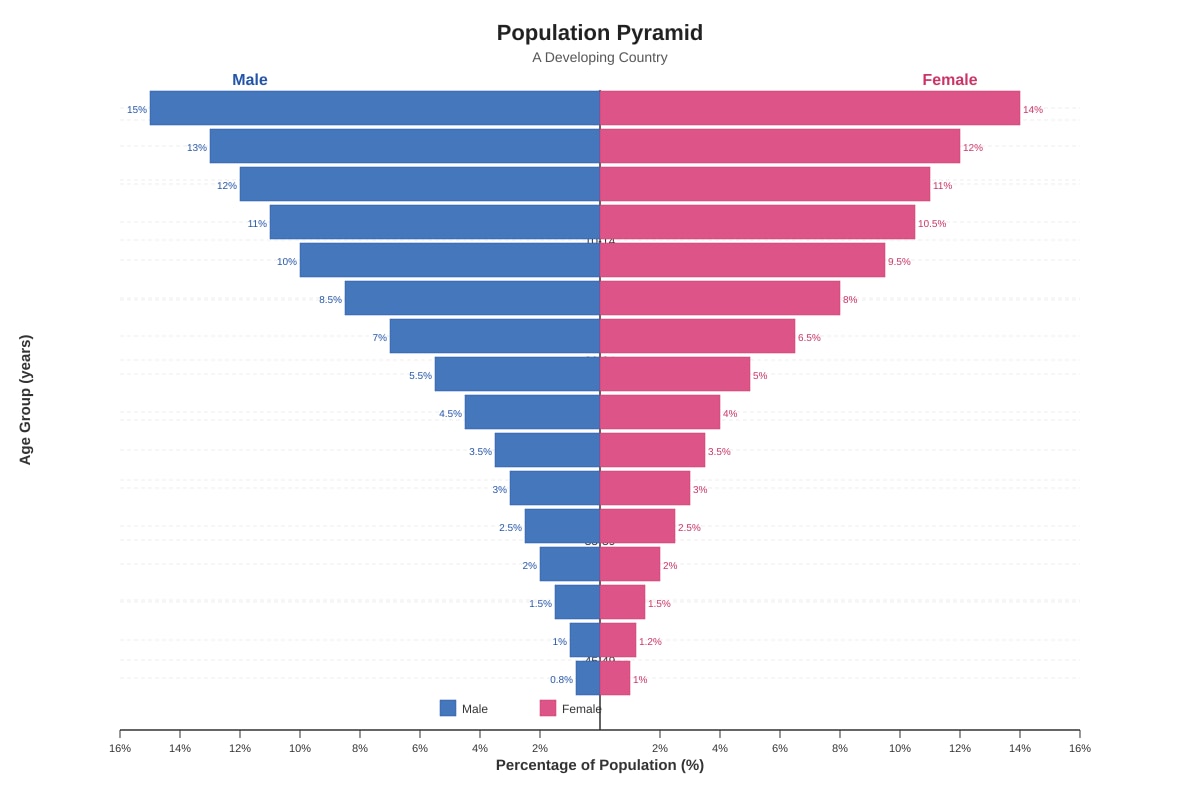
Generated graph for Q2.
This pyramid shape indicates:
| A High birth rate and high death rate |
| B High birth rate and declining death rate |
| C Low birth rate and low death rate |
| D Low birth rate and high death rate |
Answer: XXX
3. Which factor is most likely to cause rural-urban migration in a developing country?
| A Improved agricultural technology in rural areas |
| B Decline of manufacturing jobs in cities |
| C Lack of employment opportunities in rural areas |
| D Government policies encouraging resettlement to villages |
Answer: XXX
4. The term "urban sprawl" refers to:
| A The increasing population density in city centres |
| B The uncontrolled expansion of urban areas into rural land |
| C The development of high-rise buildings in downtown areas |
| D The improvement of public transport systems within a city |
Answer: XXX
5. Which of these is a pull factor attracting immigrants to a new country?
| A Political instability in their home country |
| B Natural disasters affecting their region |
| C Better healthcare and education services |
| D Forced eviction from their farmland |
Answer: XXX
Section B: Short Answer Questions (Questions 6-12)
Answer in the spaces provided. (2-3 marks each)
6. Define the term "population distribution." Explain one physical factor that affects where people live in a country. (2 marks)
7. The table below shows migration data for a hypothetical country, Azuria.
| Year | Number of immigrants | Number of emigrants |
|---|---|---|
| 2019 | 45,000 | 32,000 |
| 2020 | 38,000 | 41,000 |
| 2021 | 52,000 | 28,000 |
Calculate the net migration for each year and state which year had the highest net migration. (2 marks)
8. Study the photograph below.
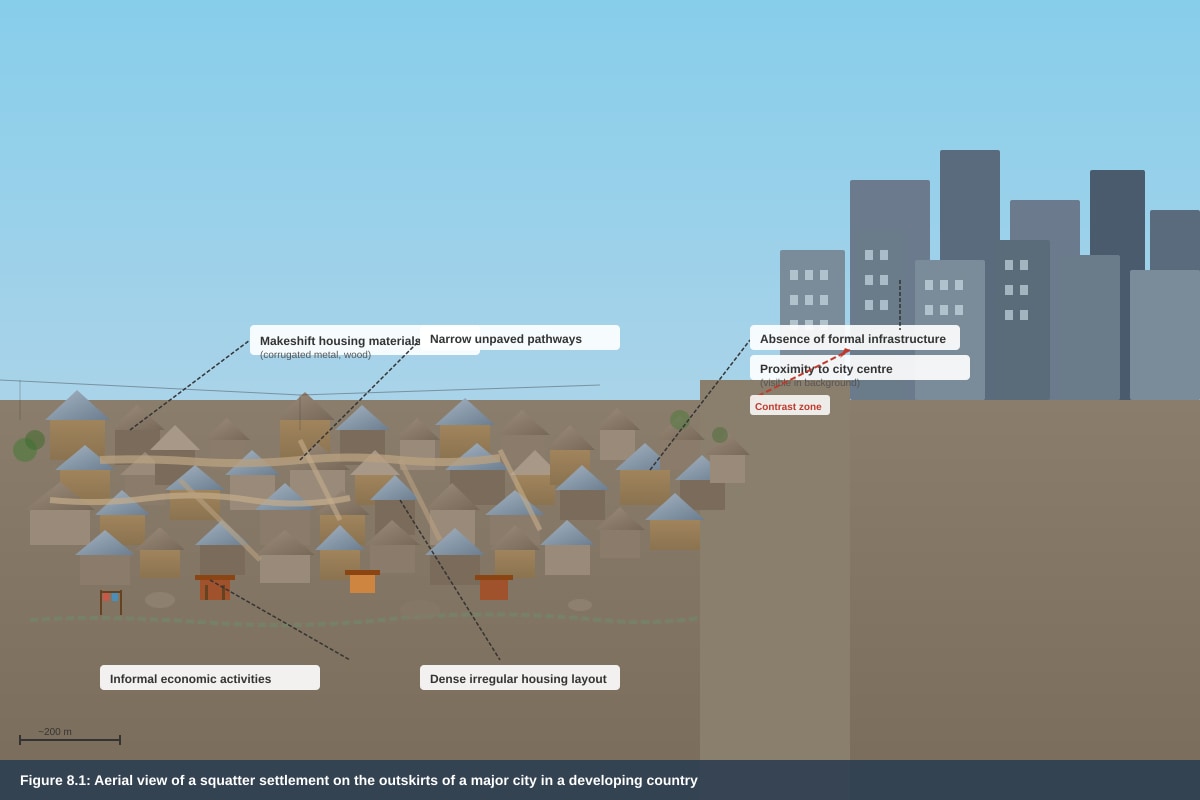
Generated source_image for Q8.
Describe two characteristics of this settlement shown in the photograph. (2 marks)
9. Explain why cities in developing countries often experience rapid population growth. Give two reasons. (2 marks)
10. Distinguish between "natural increase" and "net migration" as components of population change. (2 marks)
11. State two problems that rapid urbanisation can cause for a city's infrastructure. (2 marks)
12. The map below shows population distribution in an imaginary country.
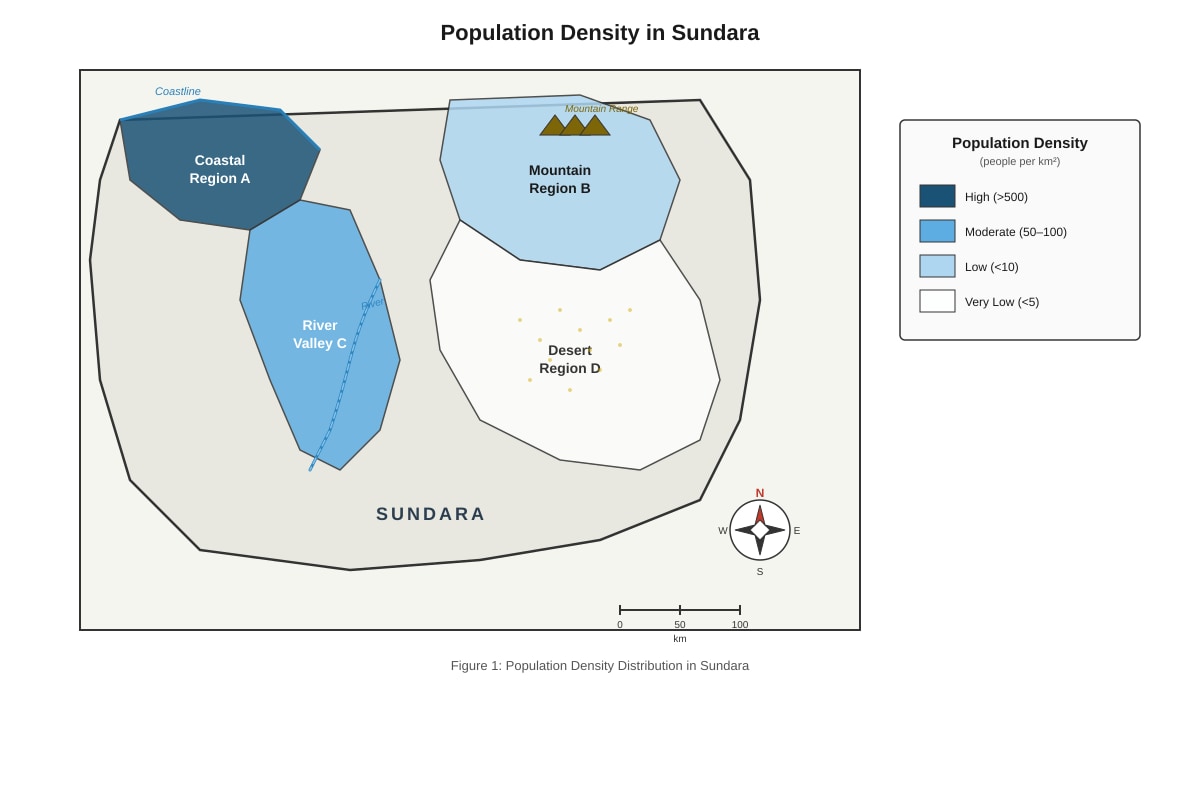
Generated map for Q12.
Identify the region with the highest population density and suggest one reason why people are concentrated there. (2 marks)
Section C: Structured Response (Questions 13-17)
Answer in the spaces provided. (3-4 marks each)
13. The population pyramid below shows the age-sex structure of Japan in 2020.
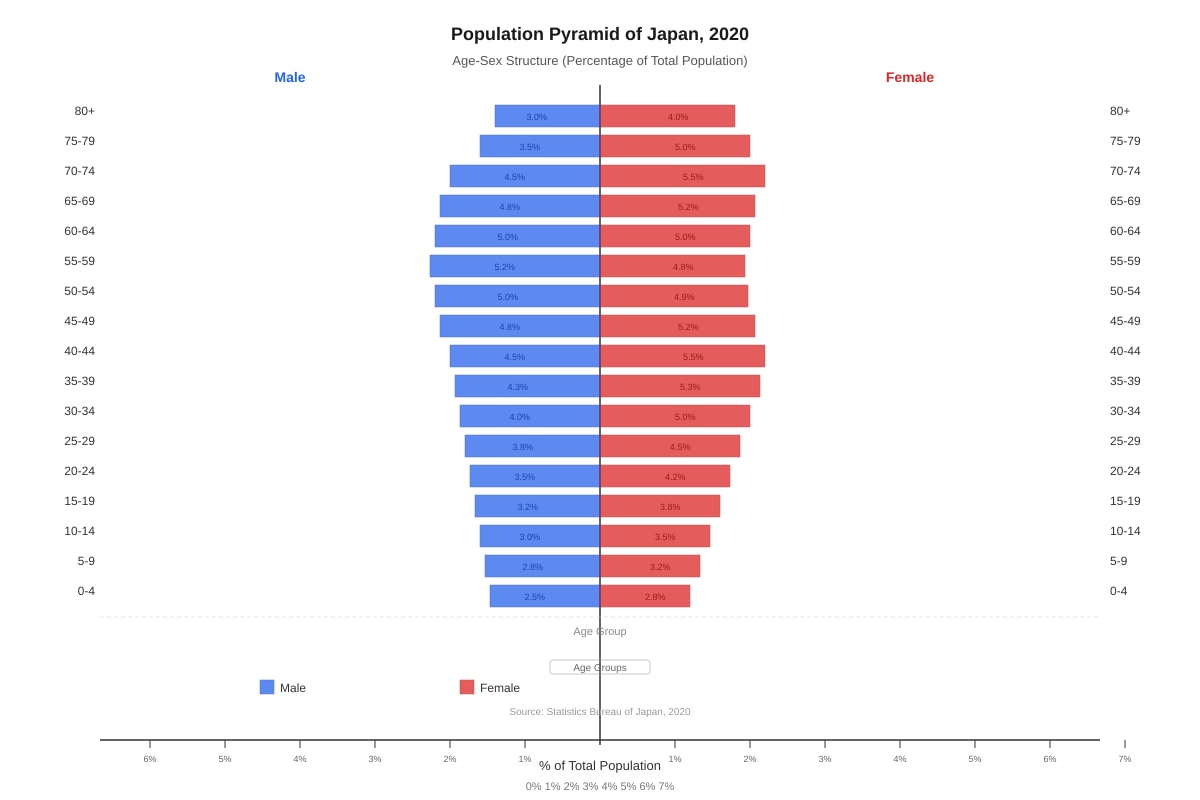
Generated graph for Q13.
(a) Describe two features of this population pyramid that differ from an expansive pyramid typical of a developing country. (2 marks)
(b) Explain one social challenge that Japan faces due to this age structure. (2 marks)
14. Study the information about Singapore's urban planning below.
Singapore has implemented the "Housing and Development Board (HDB)" programme since the 1960s. Today, over 80% of Singapore's resident population lives in HDB flats. New towns are planned with integrated facilities including markets, schools, polyclinics, parks, and transport nodes. The "Smart Nation" initiative incorporates technology for efficient resource use and improved quality of life.
(a) State one way that Singapore's government has tried to improve housing for its people. (1 mark)
(b) Explain two benefits of integrating facilities such as schools, markets, and transport within new towns. (3 marks)
15. The graph below shows the relationship between GDP per capita and urban population percentage for selected countries.
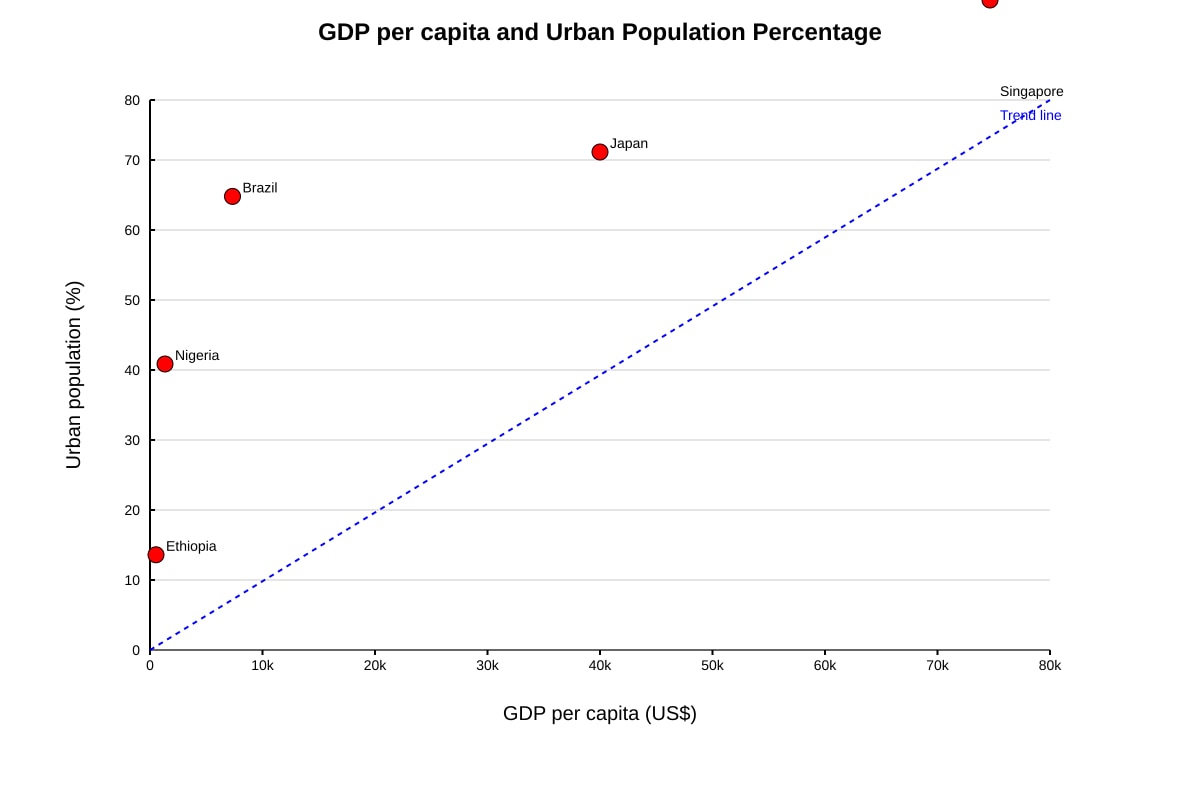
Generated graph for Q15.
(a) Describe the general relationship shown between GDP per capita and urbanisation level. (1 mark)
(b) Suggest two reasons why countries with higher GDP per capita tend to have higher levels of urbanisation. (3 marks)
16. The following extract describes challenges facing Mumbai, India.
"Mumbai's Dharavi is one of Asia's largest informal settlements, covering approximately 2.1 square kilometres and home to an estimated 1 million people. Residents face inadequate sanitation, with many lacking access to formal toilet facilities. Water supply is intermittent, and open drains carry untreated waste. Despite these conditions, Dharavi contributes approximately US$1 billion annually to the Indian economy through recycling, pottery, leather work, and other small-scale industries."
(a) Identify two indicators from the extract that suggest Dharavi is an informal settlement. (2 marks)
(b) Explain why informal settlements like Dharavi often develop despite the problems they create. (2 marks)
17. The table below shows data about two contrasting settlements: Tanah Merah (a rural village in Indonesia) and Seoul (a major city in South Korea).
| Feature | Tanah Merah | Seoul |
|---|---|---|
| Population | 2,400 | 9,700,000 |
| Main economic activity | Subsistence farming | Finance, technology, services |
| Access to healthcare | Basic clinic, 15 km to hospital | Multiple specialist hospitals |
| Education facilities | Primary school only | Universities, research institutes |
| Transport | Unpaved roads, limited buses | Extensive subway, high-speed rail, buses |
| Average income per month | US$150 | US$3,500 |
Using evidence from the table, explain why people might choose to migrate from Tanah Merah to Seoul. Give three reasons. (3 marks)
Section D: Extended Response (Questions 18-20)
Answer in the spaces provided with well-developed responses.
18. The diagram below shows push and pull factors affecting migration.
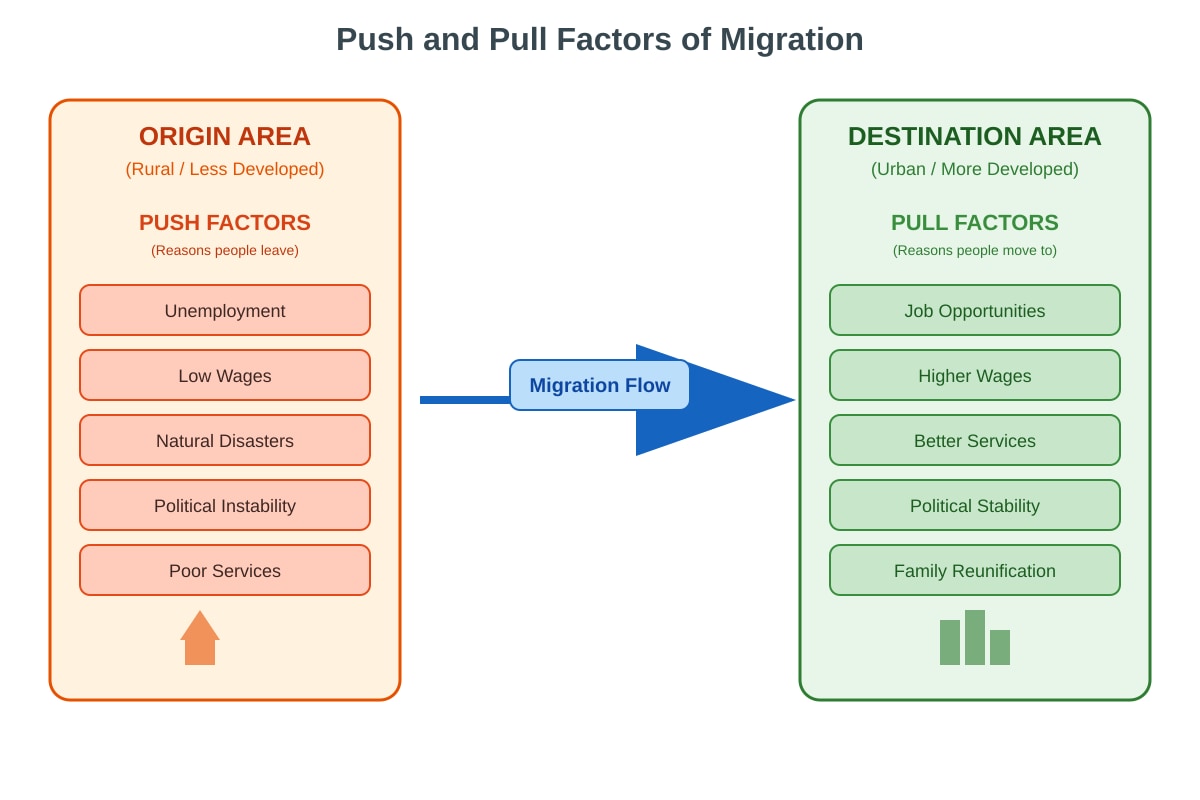
Generated diagram for Q18.
Explain how push factors and pull factors work together to cause rural-urban migration in developing countries. Illustrate your answer with examples. (4 marks)
19. Study the map of Singapore's planning regions below.
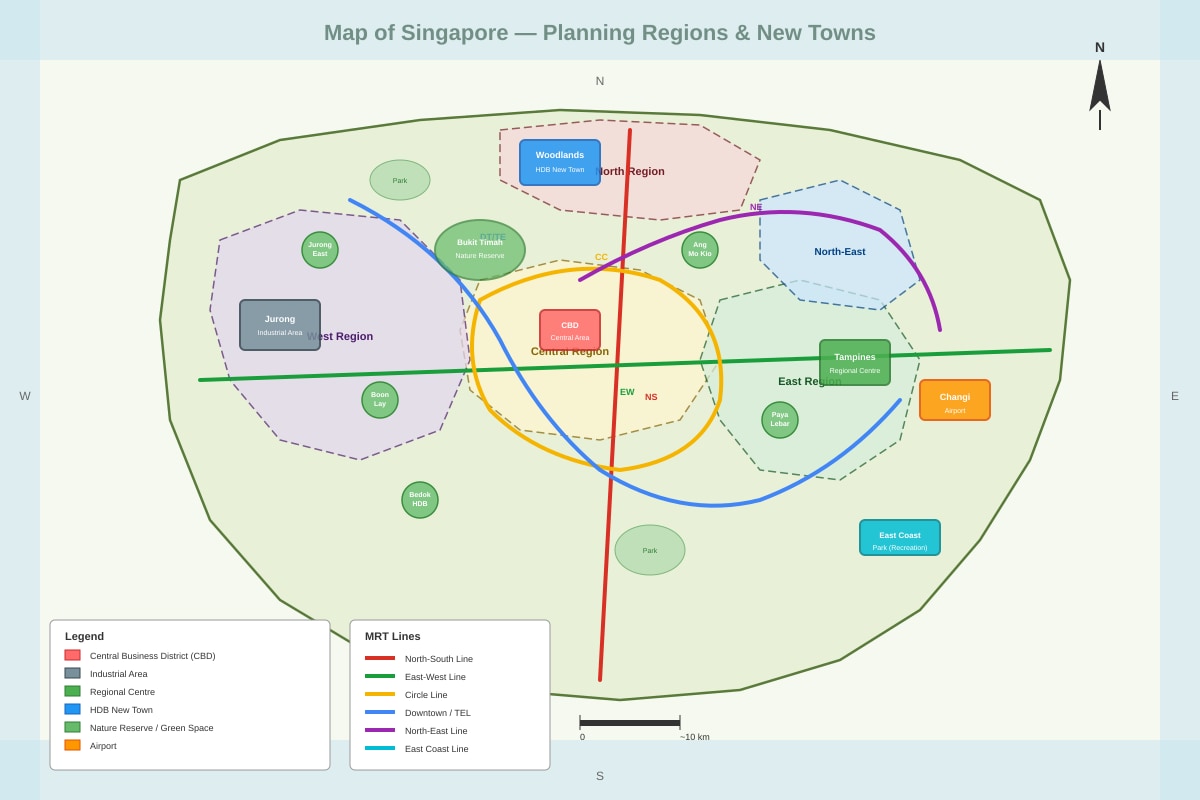
Generated map for Q19.
(a) Identify the region shown that serves as Singapore's central business district. (1 mark)
(b) Explain how the location of housing (HDB new towns) relative to industrial and commercial areas has been planned to create a sustainable urban environment. (3 marks)
20. Using examples you have studied, evaluate whether rapid urbanisation brings more benefits than problems for people in developing countries. (6 marks)
End of Quiz
Answers
Secondary 1 Geography Quiz - Human Geography: Answer Key
Section A: Multiple Choice (5 marks)
1. B — The number of people per unit area of land (1 mark)
Teaching note: Population density is always expressed as people per km² (or similar unit), not total population. Option A describes total population; C describes growth rate; D describes migration type.
2. B — High birth rate and declining death rate (1 mark)
Teaching note: A wide base indicates many young people, meaning high birth rates. The narrowing toward the top but not extremely narrow shows that death rates are falling (people are living longer) compared to truly high death rate pyramids. This is the classic shape of a developing country in demographic transition Stage 2 or early Stage 3.
3. C — Lack of employment opportunities in rural areas (1 mark)
Teaching note: Rural-urban migration is driven by people seeking better economic opportunities. Push factors (things that drive people away) include rural poverty and lack of jobs. Pull factors (things that attract) include urban job opportunities. Option C is a push factor; the others would reduce or reverse migration.
4. B — The uncontrolled expansion of urban areas into rural land (1 mark)
Teaching note: Urban sprawl specifically describes low-density, car-dependent expansion at city edges, often consuming agricultural land. It is associated with problems like habitat loss and increased commuting. Option A describes densification; C is vertical development; D is public transport improvement.
5. C — Better healthcare and education services (1 mark)
Teaching note: Pull factors attract people to a destination. Healthcare and education are attractive features of destination countries. Options A, B, and D are all push factors that would drive people to leave their home country, not features that attract them to a new one.
Section B: Short Answer Questions (14 marks)
6. Definition: Population distribution refers to the way people are spread out across an area — whether they are concentrated in certain places or spread evenly. (1 mark)
Example physical factor: One physical factor is climate — people tend to concentrate in areas with moderate temperatures and reliable rainfall (such as coastal areas or river valleys) and avoid extreme environments like deserts, polar regions, or very mountainous terrain. (1 mark)
Alternative acceptable factors: Relief/terrain, water availability, soil fertility, natural resources
7. Working:
- 2019: 45,000 − 32,000 = +13,000
- 2020: 38,000 − 41,000 = −3,000
- 2021: 52,000 − 28,000 = +24,000 (1 mark for all three correct)
The year with the highest net migration was 2021. (1 mark)
Teaching note: Net migration = immigrants − emigrants. A positive value means more people arrived than left; negative means more people left than arrived. Students must show understanding of the calculation, not just the final number.
8. Any two from: (1 mark each, max 2 marks)
- Housing is makeshift/self-built using temporary materials like corrugated metal, wood, or cardboard
- Lack of planned layout — buildings appear irregular and densely packed without formal street patterns
- Limited infrastructure — few paved roads, no formal drainage systems visible
- Informal economic activities visible — small businesses operating without formal permits
- Contrast with developed area in background — showing the settlement is on the urban periphery
Teaching note: Description must come from visual evidence in the photograph. Students should use geographical observation terms, not just say "it looks poor."
9. Any two from: (1 mark each, max 2 marks)
- Rural-urban migration: People move from countryside seeking jobs in cities
- Natural increase: Birth rates exceed death rates in cities due to younger migrating populations
- Limited rural opportunities: Mechanisation of farming reduces need for agricultural labour
- Urban economic growth: Industrialisation and service sector expansion create employment magnets
10. (2 marks)
| Natural increase | Net migration |
|---|---|
| The difference between the number of births and deaths in a population; leads to growth when births exceed deaths | The difference between the number of people entering (immigrants) and leaving (emigrants) an area |
Both are ways population changes, but natural increase is biological (related to fertility and mortality) while net migration is geographical movement. (1 mark for each correct distinction)
11. Any two from: (1 mark each, max 2 marks)
- Transport congestion — too many vehicles for road capacity
- Housing shortage — demand exceeds supply of affordable homes
- Strain on water and electricity supply — infrastructure cannot meet rising demand
- Inadequate sewage and waste disposal — leading to health hazards
- Pressure on schools and hospitals — facilities overcrowded and under-resourced
12. Region with highest population density: Region A (Coastal Region A) (1 mark)
Reason: The coastal location likely provides flat land suitable for development, port facilities for trade and employment, access to fishing resources, and historical settlement patterns as coastal areas were often settled first. (1 mark for any valid reason)
Teaching note: Accept any reasonable physical or human geographical explanation linked to coastal advantages. The map shows >500 people/km² versus other regions at much lower densities.
Section C: Structured Response (15 marks)
13. (a) Any two features from: (1 mark each, max 2 marks)
- Narrow base / small proportion of young people — unlike the wide base of expansive pyramids showing high birth rates
- Bulging middle and top / large proportion of elderly people — showing low death rates and long life expectancy
- More females than males in older age groups — due to longer female life expectancy (visible in wider right side at top)
- Overall contracting shape — population is stable or declining
(b) Any one explained challenge: (2 marks)
- Aging population burden: With fewer young workers and more elderly dependents, there is increased pressure on pension and healthcare systems. The working population must support more retirees through taxation.
- Labour shortage: Industries may lack sufficient workers, leading to slower economic growth and need for immigration or automation.
- Increased healthcare demand: More elderly means greater need for hospitals, elderly care facilities, and specialised medical services.
(1 mark for identifying challenge, 1 mark for explanation of consequences)
14. (a) Any one from: (1 mark)
- Building HDB public housing flats for majority of population
- Planning integrated new towns with mixed facilities
- Implementing upgrading programmes for older estates
- Developing smart home technologies
(b) (3 marks)
Reduces need for long commuting: (1 mark) When housing, schools, workplaces, shops and transport are close together, people spend less time and money travelling. This reduces transport congestion and pollution, improving quality of life and environmental sustainability. (1 mark for explanation)
Creates self-contained communities: (1 mark) Residents can access daily needs (education, healthcare, shopping, recreation) within their neighbourhood. This builds social cohesion, supports local businesses, and makes efficient use of land rather than scattered development. (1 mark for explanation)
15. (a) There is a positive correlation — as GDP per capita increases, the percentage of population living in urban areas tends to increase. (1 mark)
Accept: Countries with higher GDP per capita generally have higher levels of urbanisation.
(b) (3 marks)
Economic restructuring: (1 mark) Wealthier economies shift from agriculture to manufacturing and services, which are concentrated in cities. This creates urban job opportunities that attract rural workers. (0.5 mark) Cities become centres of innovation, finance, and high-value employment that drive further growth. (0.5 mark)
Investment in urban infrastructure: (1 mark) Wealthier countries can invest in public transport, utilities, and housing that make cities functional and attractive. This urban investment improves living standards and draws more people from rural areas. (1 mark for developed explanation)
Alternative acceptable reasons: Better urban services (healthcare, education); mechanisation of farming reducing rural jobs; historical industrialisation patterns.
16. (a) Any two from: (1 mark each)
- Described as "informal settlement" in the question framing / self-built/makeshift housing
- Inadequate sanitation / lack of formal toilet facilities
- Intermittent water supply
- Open drains with untreated waste
- Small-scale industries without formal structure (implied by description of economic activity)
(Must be explicitly from or inferable from extract)
(b) (2 marks)
Informal settlements develop because they provide affordable housing for low-income rural migrants who cannot access formal housing in expensive cities. (1 mark) Despite poor conditions, they offer proximity to employment opportunities and chances to earn income in the urban economy, making them a rational choice for poor families seeking to improve their situation. (1 mark)
Alternative: They develop due to rapid urbanisation outpacing formal housing supply, and because residents have social networks and community support that make survival possible.
17. (3 marks — 1 mark per valid reason with table evidence)
| Reason | Evidence from table |
|---|---|
| Better employment and higher income: | Seoul has finance/technology/service jobs paying US3,500/monthversusUS150 from subsistence farming in Tanah Merah |
| Better education opportunities: | Seoul has universities and research institutes versus only primary school in Tanah Merah |
| Better healthcare access: | Seoul has multiple specialist hospitals versus basic clinic with 15 km travel in Tanah Merah |
| Better transport connectivity: | Seoul has subway, high-speed rail, and buses versus unpaved roads and limited buses in Tanah Merah |
(Any three reasons with specific evidence cited = 3 marks. General answers without table reference = maximum 1 mark)
Section D: Extended Response (12 marks)
18. (4 marks)
Push factors are conditions that drive people away from rural areas, while pull factors are conditions that attract them to urban areas. Together they create migration flows. (1 mark for basic understanding)
Example of combined operation: In rural India, push factors include poverty from small, subdivided farms, seasonal unemployment, and lack of rural industries — especially after mechanisation reduced labour needs. These push people to leave. (1 mark)
Simultaneously, pull factors in cities like Mumbai or Bangalore include factory jobs, construction work, service sector employment, better schools and hospitals, and the promise of higher wages. These attract migrants. (1 mark)
The combination creates strong migration pressure: when rural life becomes untenable AND cities seem to offer improvement, people make the rational decision to move despite hardships of urban life. (1 mark for synthesis)
Marking descriptor: 1 mark for clear definitions; 2 marks for specific examples from a developing country context; 1 mark for explaining interaction between push and pull.
19. (a) Central Region (1 mark)
(b) (3 marks)
HDB new towns have been located around the periphery of Singapore but connected by MRT to central commercial areas and industrial zones like Jurong. (1 mark for pattern identification)
This new town model separates residential areas from heavy industry and intense commercial activity, reducing pollution exposure for residents while keeping employment accessible. (1 mark)
The integration of employment, services, and transport in each new town (with regional centres like Tampines) means many daily needs are met locally, but the central CBD and industrial areas remain reachable — balancing quality of life with economic efficiency and reducing unnecessary travel that would increase congestion and emissions. (1 mark)
20. (6 marks)
Marking descriptors:
| Level | Mark | Description |
|---|---|---|
| 1 | 1-2 | Lists some benefits or problems without development; limited or no examples |
| 2 | 3-4 | Explains benefits OR problems with examples; some evaluation attempt but unbalanced or conclusion weak |
| 3 | 5-6 | Explains BOTH benefits and problems with detailed examples; balanced evaluation leading to reasoned conclusion |
Exemplar response structure:
Benefits of rapid urbanisation: (up to 3 marks)
- Economic growth and employment: Cities concentrate labour, capital, and markets. China's coastal cities (Shenzhen, Shanghai) attracted manufacturing investment creating millions of jobs and raising incomes.
- Improved services: Urban areas can support hospitals, universities, and efficient public transport that rural areas cannot sustain economically.
- Innovation and opportunity: Cities offer social mobility through education and diverse employment, especially for women and minorities excluded from traditional rural structures.
Problems of rapid urbanisation: (up to 3 marks)
- Informal settlements and poor living conditions: Rapid in-migration outpaces housing supply, creating slums without sanitation, clean water, or security (e.g., Dharavi in Mumbai, favelas in Rio de Janeiro).
- Environmental degradation: Air and water pollution from industry and traffic; loss of green space; pressure on water resources.
- Social inequality: Wealth gaps become visible; rural migrants often face discrimination and exploitation in informal labour markets.
- Infrastructure strain: Congestion, inadequate waste management, and overstretched services even when formally provided.
Evaluation/Conclusion: (1-2 marks)
Whether benefits exceed problems depends on governance and planning. Singapore and South Korea show that with strong institutions, investment in public housing, and industrial policy, urbanisation can be managed for broad benefit. (1 mark) However, many developing countries lack resources or political will, leading to enduring slums and inequality. Therefore, rapid urbanisation can bring net benefits, but only with active government intervention to provide housing, services, and economic opportunities for all residents — without such intervention, problems often dominate. (1 mark for nuanced conclusion)
Total: 40 marks
Free quiz and exam paper access
Enter your details to view this paper
Your access is remembered on this device.