From Real Exams Quiz
Secondary 1 Geography Fieldwork Quiz
Free Sec 1 Geography Fieldwork quiz, Nemo3 Exam version, with questions, answers, and syllabus-aligned practice for Singapore students.
These static practice materials are generated from the site's syllabus and paper-generation workflow, with source and model context shown so students and parents can evaluate the material before use.
Questions
Secondary 1 Geography Quiz - Fieldwork
Name: ___________________________
Class: ___________________________
Date: ___________________________
Score: _____ / 40
Duration: 55 minutes
Total Marks: 40
Instructions:
- Answer all questions.
- Write your answers in the spaces provided.
- The number of marks is given in brackets [ ] at the end of each question or part question.
- For questions requiring diagrams, refer to the image placeholders provided.
Section A: Multiple Choice Questions (5 marks)
1. Which of the following is the first step in the geographical inquiry process? [1]
A. Data collection
B. Formulating a hypothesis
C. Asking geographical questions
D. Data presentation
Answer: _____
2. A student wants to investigate how temperature varies across different parts of the school compound. Which of the following is the most appropriate hypothesis? [1]
A. Temperature is higher in the afternoon.
B. Temperature will be higher at the car park than at the field.
C. The school is hotter than the park nearby.
D. Temperature changes throughout the day.
Answer: _____
3. Which data collection method is most suitable for gathering information about students' perceptions of noise levels in the canteen? [1]
A. Measuring sound levels with a decibel meter
B. Conducting a questionnaire survey
C. Observing and recording student behaviour
D. Taking photographs of the canteen
Answer: _____
4. In a fieldwork study on soil infiltration rates, a student uses a stopwatch to time how long water takes to soak into the ground. This is an example of: [1]
A. Primary data collection
B. Secondary data collection
C. Data presentation
D. Data analysis
Answer: _____
5. Which of the following is a limitation of using a questionnaire for fieldwork data collection? [1]
A. It provides quantitative data that is easy to analyse.
B. It allows data to be collected from a large number of people quickly.
C. Respondents may not answer truthfully or may misunderstand questions.
D. It can be administered online or on paper.
Answer: _____
Section B: Structured Questions (15 marks)
6. A group of Secondary 1 students is planning a fieldwork investigation on surface runoff around their school after heavy rain.
(a) State one geographical question they could ask for this investigation. [1]
(b) Write a testable hypothesis for this investigation. [1]
(c) Identify two pieces of equipment they would need to measure surface runoff. [2]
(d) Describe one safety precaution they should take when conducting fieldwork near drains after heavy rain. [1]
7. The students collected data on the depth of surface runoff (in cm) at five different locations around the school. Their results are shown in the table below.
| Location | Depth of Runoff (cm) |
|---|---|
| A (Field) | 2 |
| B (Car Park) | 8 |
| C (Concrete Path) | 6 |
| D (Garden) | 3 |
| E (Basketball Court) | 7 |
(a) Which location had the greatest depth of surface runoff? [1]
(b) Calculate the mean depth of surface runoff across the five locations. Show your working. [2]
(c) Suggest one reason why the depth of runoff at Location B (Car Park) is higher than at Location A (Field). [2]
8. The students want to present their data on surface runoff depths using a bar graph.
(a) State what should be labelled on the x-axis and y-axis of the bar graph. [2]
x-axis: ______________________________________________________________________ y-axis: ______________________________________________________________________
(b) State one advantage of using a bar graph to present this data. [1]
9. During the fieldwork, a student recorded the following observation: "Water flows quickly across the basketball court but soaks into the garden soil."
(a) Identify the geographical concept (Space, Place, Environment, or Scale) that best relates to this observation about different surfaces affecting water movement. [1]
(b) Explain how this concept helps geographers understand surface runoff patterns. [2]
10. The students also measured infiltration rates (in mm/min) at the same five locations. Their results are shown below.
| Location | Infiltration Rate (mm/min) |
|---|---|
| A (Field) | 45 |
| B (Car Park) | 2 |
| C (Concrete Path) | 3 |
| D (Garden) | 38 |
| E (Basketball Court) | 5 |
(a) Which location had the highest infiltration rate? [1]
(b) Describe the relationship between surface runoff depth and infiltration rate based on the data in Questions 7 and 10. [2]
11. The students want to present the infiltration rate data using a pie chart.
(a) State one reason why a pie chart is not appropriate for presenting this data. [1]
(b) Suggest a more suitable graph for presenting the infiltration rate data and state one reason for your choice. [2]
Graph: ______________________________________________________________________ Reason: ______________________________________________________________________
Section C: Data Response and Evaluation (10 marks)
12. The students concluded: "Impermeable surfaces like concrete and asphalt cause higher surface runoff than permeable surfaces like soil and grass."
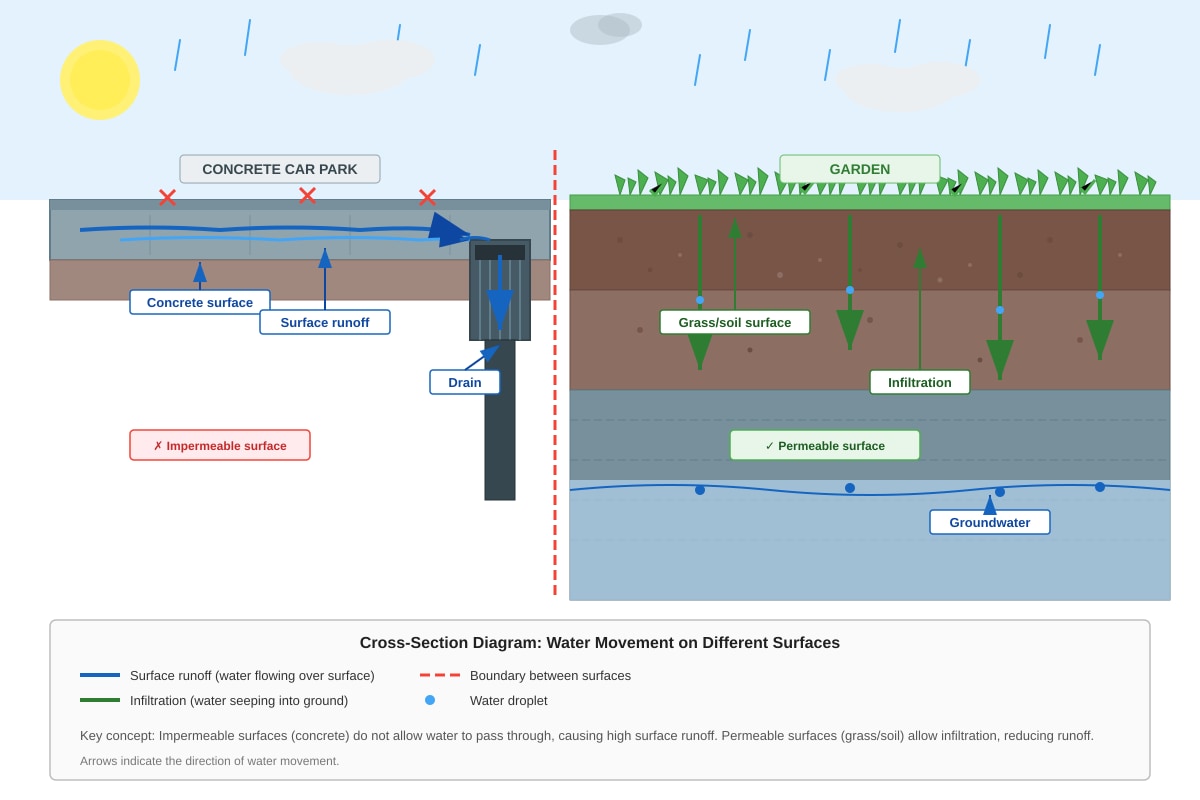
Generated diagram for Q12.
(a) Using the diagram, describe the difference in water movement between the concrete surface and the garden surface. [2]
(b) Explain why impermeable surfaces lead to a higher risk of flash floods in urban areas. [3]
13. The students evaluated their fieldwork investigation and identified the following limitations:
- They only collected data on one rainy day.
- They measured runoff depth at only five locations.
- The stopwatch used to time water flow had a delay of 1-2 seconds when starting/stopping.
(a) For each limitation, state one way the students could improve their investigation. [3]
Limitation 1 (one rainy day): ___________________________________________________
Limitation 2 (only five locations): _______________________________________________
Limitation 3 (stopwatch delay): _________________________________________________
(b) State one reason why it is important to evaluate a fieldwork investigation after completing it. [1]
14. A student from another school conducted a similar investigation on surface runoff but used secondary data from the national water agency (PUB) on rainfall and drainage records instead of collecting primary data.
(a) State one advantage of using secondary data for this investigation. [1]
(b) State one disadvantage of using secondary data for this investigation. [1]
Section D: Application and Extended Response (10 marks)
15. The school plans to redevelop an open grass field into a new covered basketball court with a concrete surface.
(a) Predict how this change will affect surface runoff and infiltration at that location. [2]
(b) Suggest one sustainable urban drainage feature the school could include in the design to reduce the impact of increased surface runoff. [1]
(c) Explain how your suggested feature helps to manage surface runoff. [2]
16. A student argues: "Since concrete surfaces cause flash floods, we should ban all concrete in cities."
(a) Identify one flaw in this argument. [1]
(b) Using the concept of Environment, explain a more balanced approach to managing surface runoff in urban areas. [3]
17. The students decided to repeat their investigation during the dry season to compare results.
(a) State one difference they would expect in their surface runoff depth measurements. [1]
(b) Explain why this difference would occur. [2]
18. The students used a quadrat to select sampling points for measuring infiltration rates.
(a) Name the sampling method used when a quadrat is placed at regular intervals (e.g., every 10 metres) along a line. [1]
(b) State one advantage of this sampling method over random sampling for this investigation. [1]
19. The students' teacher suggested they use GIS (Geographic Information Systems) to map their surface runoff data.
(a) State one benefit of using GIS to present fieldwork data. [1]
(b) Identify one type of spatial data (other than runoff depth) that could be added as a layer in the GIS to help analyse the results. [1]
20. Reflecting on the entire geographical inquiry process, arrange the following steps in the correct order by writing numbers 1 to 5 in the boxes.
☐ Data presentation
☐ Asking geographical questions
☐ Drawing conclusions
☐ Data collection
☐ Data analysis
[2]
End of Quiz
Answers
Secondary 1 Geography Quiz - Fieldwork (Answer Key)
Total Marks: 40
Section A: Multiple Choice Questions (5 marks)
1. C — Asking geographical questions
Marks: 1
Explanation: The geographical inquiry process begins with asking geographical questions about a phenomenon or issue. This is followed by forming a hypothesis, planning data collection, collecting data, presenting data, analysing data, and drawing conclusions.
Common mistake: Students often think data collection or hypothesis comes first.
2. B — Temperature will be higher at the car park than at the field.
Marks: 1
Explanation: A hypothesis must be a testable statement that predicts a relationship between variables. Option B compares two specific locations (car park vs field) and can be tested by measuring temperature at both. Option A is a general observation, not a comparative hypothesis. Option C compares school to an external park (not the focus). Option D is a statement of fact, not a testable prediction.
3. B — Conducting a questionnaire survey
Marks: 1
Explanation: Perceptions are subjective opinions/feelings. A questionnaire (or interview) is the appropriate method to gather people's views. A decibel meter (A) measures actual sound levels, not perceptions. Observation (C) records behaviour, not internal perceptions. Photographs (D) provide visual records, not perceptual data.
4. A — Primary data collection
Marks: 1
Explanation: Primary data is data collected first-hand by the researcher for a specific purpose. The student is directly measuring infiltration rates using a stopwatch. Secondary data (B) is data collected by someone else for another purpose. Data presentation (C) and analysis (D) occur after collection.
5. C — Respondents may not answer truthfully or may misunderstand questions.
Marks: 1
Explanation: This is a well-known limitation of questionnaires. Options A, B, and D are advantages (quantitative data, large sample, flexible administration). The question asks for a limitation.
Section B: Structured Questions (15 marks)
6.
(a) Sample answer: How does surface runoff vary across different surfaces around the school after heavy rain? / What is the relationship between surface type and surface runoff depth?
Marks: 1
Explanation: A geographical question should be open-ended, focus on a geographical phenomenon (surface runoff), and specify a location (school) and condition (after heavy rain). It should not be answerable by a simple yes/no.
(b) Sample answer: Surface runoff depth will be greater on impermeable surfaces (e.g., car park, concrete path) than on permeable surfaces (e.g., field, garden).
Marks: 1
Explanation: A testable hypothesis predicts a relationship between variables (surface type → runoff depth) and can be proven true or false through data collection. It must be specific and comparative.
(c) Equipment (any two):
- Ruler / measuring tape (to measure depth of runoff)
- Stopwatch (to measure flow speed/time)
- Infiltration ring / cylinder (to measure infiltration rate)
- Water container / bottle (to pour water for simulation)
Marks: 2 (1 each)
Explanation: Equipment must be appropriate for measuring runoff depth, speed, or infiltration. A thermometer or anemometer would be incorrect.
(d) Sample answer: Avoid standing near open drains or fast-flowing water to prevent falling in or being swept away. / Wear non-slip footwear to prevent slipping on wet surfaces. / Do not conduct fieldwork during lightning alerts.
Marks: 1
Explanation: Safety precautions must be specific to the hazard (drains, heavy rain, slippery surfaces). Generic answers like "be careful" are insufficient.
7.
(a) Location B (Car Park) — 8 cm
Marks: 1
Explanation: Direct reading from the table. Location B has the highest value (8 cm).
(b) Working:
Mean = (2 + 8 + 6 + 3 + 7) ÷ 5 = 26 ÷ 5 = 5.2 cm
Marks: 2 (1 for correct sum/count, 1 for correct answer with unit)
Explanation: Mean = Sum of all values ÷ Number of values. Always include the unit (cm).
(c) Sample answer: The car park has an impermeable concrete/asphalt surface that prevents water from infiltrating into the ground, so water flows over the surface as runoff. The field has permeable soil and grass that allow water to infiltrate, reducing surface runoff.
Marks: 2 (1 for identifying impermeable vs permeable surface, 1 for explaining infiltration vs runoff)
Explanation: Link surface material → permeability → infiltration capacity → runoff depth. Use geographical terms: impermeable, permeable, infiltrate, surface runoff.
8.
(a) x-axis: Location / Surface Type (A, B, C, D, E)
y-axis: Depth of Surface Runoff (cm)
Marks: 2 (1 each)
Explanation: The independent variable (categories/locations) goes on the x-axis. The dependent variable (measured numerical value with unit) goes on the y-axis.
(b) Sample answer: It allows easy comparison of runoff depths between different locations. / It shows the differences in magnitude clearly. / It is simple to construct and interpret.
Marks: 1
Explanation: Bar graphs are ideal for comparing discrete categories. Advantages include visual clarity for comparison and simplicity.
9.
(a) Environment
Marks: 1
Explanation: The concept of Environment refers to the natural and human-made surroundings and the interactions between them. The observation describes how different surface environments (concrete vs soil) affect water movement — a classic environment interaction.
(b) Sample answer: The concept of Environment helps geographers understand how natural elements (soil, vegetation) and human-made elements (concrete, asphalt) interact with physical processes like water flow. By analysing these interactions, geographers can explain why runoff patterns differ across spaces and predict flood risks in urban areas.
Marks: 2 (1 for defining Environment in this context, 1 for linking to understanding runoff patterns)
Explanation: Do not just define the concept; explain how it helps understanding — e.g., identifying cause-effect relationships between surface type and water movement, enabling prediction and management.
10.
(a) Location A (Field) — 45 mm/min
Marks: 1
Explanation: Direct reading from the table. Location A has the highest value (45 mm/min).
(b) Sample answer: There is an inverse relationship — locations with higher infiltration rates (e.g., Field, Garden) have lower surface runoff depths, while locations with lower infiltration rates (e.g., Car Park, Concrete Path, Basketball Court) have higher surface runoff depths.
Marks: 2 (1 for identifying inverse relationship, 1 for using data examples)
Explanation: Compare the two data sets: Field (45 mm/min, 2 cm runoff) vs Car Park (2 mm/min, 8 cm runoff). As infiltration increases, surface runoff decreases.
11.
(a) Sample answer: A pie chart shows proportions of a whole, but infiltration rates at different locations are independent measurements, not parts of a total. / The data are discrete categories with numerical values, not percentages summing to 100%.
Marks: 1
Explanation: Pie charts require data that represent parts of a whole (e.g., land use percentages). Infiltration rates are absolute measurements per location.
(b) Graph: Bar graph / Column graph
Reason: It allows easy comparison of infiltration rates between discrete locations, just like the runoff depth data.
Marks: 2 (1 for correct graph, 1 for valid reason)
Explanation: Bar graphs are ideal for comparing numerical values across categories. The same reasoning as Q8(b) applies.
Section C: Data Response and Evaluation (10 marks)
12.
(a) Sample answer: On the concrete surface, water flows over the surface as surface runoff directly into the drain. On the garden surface, water infiltrates into the soil and becomes groundwater, with little or no surface runoff.
Marks: 2 (1 for describing concrete → surface runoff, 1 for describing garden → infiltration/groundwater)
Explanation: Use the diagram labels: "surface runoff", "drain", "infiltration", "groundwater". Contrast the two pathways clearly.
(b) Sample answer: Impermeable surfaces (like concrete and asphalt) prevent rainwater from infiltrating into the ground. This causes a large volume of water to flow rapidly over the surface as surface runoff into drains and rivers. During heavy rain, the drainage system can be overwhelmed by the sudden increase in runoff volume and speed, causing water to overflow and result in flash floods.
Marks: 3 (1 for impermeable → no infiltration, 1 for rapid/large volume surface runoff, 1 for overwhelming drainage → flash flood)
Explanation: Chain the reasoning: Impermeable surface → no infiltration → increased surface runoff volume & speed → drainage capacity exceeded → flash flood. Use terms: infiltration, surface runoff, drainage system, overwhelm, flash flood.
13.
(a)
- Limitation 1 (one rainy day): Collect data on multiple rainy days / over a longer period to account for variations in rainfall intensity and duration.
- Limitation 2 (only five locations): Increase the number of sampling locations / use systematic sampling across a larger area to improve spatial representation.
- Limitation 3 (stopwatch delay): Use a digital sensor / flow meter / video recording with timestamps to measure flow time more accurately.
Marks: 3 (1 each)
Explanation: Improvements must directly address the stated limitation. "Do it better" is insufficient; be specific about method/equipment.
(b) Sample answer: To identify strengths and weaknesses so that future investigations can be improved / to assess the reliability and validity of the conclusions.
Marks: 1
Explanation: Evaluation is a key step in the inquiry process. It ensures learning from mistakes and improves geographical practice.
14.
(a) Sample answer: It saves time and effort / data is already available / can cover a larger area or longer time period than primary data collection allows.
Marks: 1
Explanation: Secondary data advantages: cost-effective, extensive coverage, historical data available.
(b) Sample answer: The data may not be specific to the school's exact locations / may not match the investigation's variables (e.g., runoff depth at specific surfaces) / may be outdated.
Marks: 1
Explanation: Secondary data disadvantages: not tailored to research question, different scale/resolution, possible outdatedness.
Section D: Application and Extended Response (10 marks)
15.
(a) Sample answer: Surface runoff will increase because concrete is impermeable. Infiltration will decrease because water cannot soak into the concrete surface.
Marks: 2 (1 for runoff increase, 1 for infiltration decrease)
Explanation: Direct application of permeable vs impermeable surface knowledge. Must mention both changes.
(b) Sample answer: Permeable paving / porous concrete / rain garden / bioswale / green roof / detention basin.
Marks: 1
Explanation: Any valid Sustainable Urban Drainage System (SUDS) feature. Must be a specific feature, not just "drainage system".
(c) Sample answer (for permeable paving): Permeable paving allows water to infiltrate through gaps in the surface into the ground below, reducing surface runoff volume and speed, and recharging groundwater.
Marks: 2 (1 for mechanism, 1 for outcome)
Explanation: Explain how it works (infiltration through surface) and effect (reduced runoff, groundwater recharge). Link to infiltration and runoff concepts.
16.
(a) Sample answer: It is an extreme/overgeneralised statement — concrete is essential for urban infrastructure (buildings, roads) and cannot be completely banned. / It ignores the need for balanced urban development.
Marks: 1
Explanation: Identify the logical flaw: false dilemma / overgeneralisation / impractical solution.
(b) Sample answer: The concept of Environment recognises that urban areas are human-made environments interacting with natural processes. A balanced approach uses sustainable urban drainage systems (SUDS) like permeable surfaces, rain gardens, and retention ponds to mimic natural infiltration while retaining necessary concrete infrastructure. This manages runoff by integrating natural processes (infiltration, storage) into the built environment, reducing flood risk without banning concrete entirely.
Marks: 3 (1 for Environment concept linking human/natural, 1 for SUDS/balanced approach, 1 for explaining integration)
Explanation: Use Environment concept: human-made (concrete) and natural (soil, water) interactions. Solution = integrate natural processes into urban design (SUDS). Not "ban" but "manage".
17.
(a) Sample answer: Surface runoff depth would be lower / there would be little to no surface runoff.
Marks: 1
Explanation: Dry season = less rain = less runoff.
(b) Sample answer: During the dry season, there is less rainfall, so less water falls on surfaces. The ground is also drier, so infiltration capacity is higher (especially in permeable areas), further reducing surface runoff.
Marks: 2 (1 for less rainfall, 1 for higher infiltration capacity/drier ground)
Explanation: Two factors: less input (rain) and higher absorption capacity (dry soil). Both reduce runoff.
18.
(a) Systematic sampling
Marks: 1
Explanation: Placing a quadrat at regular intervals along a line is the definition of systematic sampling.
(b) Sample answer: It ensures even spatial coverage across the study area / it is easier to replicate and less biased than random sampling for comparing specific surface types.
Marks: 1
Explanation: Systematic sampling advantages: good coverage, simple to implement, reduces clustering. For this investigation, it ensures all surface types are sampled.
19.
(a) Sample answer: It allows spatial patterns to be visualised and analysed / multiple data layers can be overlaid (e.g., surface type, slope, drainage) / it supports decision-making for flood management.
Marks: 1
Explanation: GIS benefits: spatial analysis, layering, pattern recognition, professional presentation.
(b) Sample answer: Surface type (permeable/impermeable) / land use / slope gradient / drainage network / soil type.
Marks: 1
Explanation: Any spatial data layer that helps explain runoff patterns. Surface type is most directly relevant.
20.
Correct order:
- ☐ Asking geographical questions
- ☐ Data collection
- ☐ Data presentation
- ☐ Data analysis
- ☐ Drawing conclusions
Marks: 2 (1 for correct first and last, 1 for correct middle sequence)
Explanation: The geographical inquiry process sequence is fixed: Question → Hypothesis → Plan → Collect → Present → Analyse → Conclude. This question tests the core sequence (omitting hypothesis/plan for brevity). Note: Data presentation comes before analysis in the standard school sequence (you present then analyse what you presented).
End of Answer Key
Free quiz and exam paper access
Enter your details to view this paper
Your access is remembered on this device.