From Real Exams Quiz
Secondary 1 Geography Fieldwork Quiz
Free Sec 1 Geography Fieldwork quiz, Kimi2.6 Exam version, with questions, answers, and syllabus-aligned practice for Singapore students.
These static practice materials are generated from the site's syllabus and paper-generation workflow, with source and model context shown so students and parents can evaluate the material before use.
Questions
Secondary 1 Geography Quiz - Fieldwork
Name: _____________________________ Class: __________ Date: __________
Score: ______ / 40 marks
Duration: 40 minutes
Instructions: Answer all questions. Write your answers in the spaces provided. For multiple-choice questions, circle the correct answer.
Section A: Fieldwork Skills and Concepts (Questions 1–5) [10 marks]
1. Define the term "fieldwork" in geography. [2 marks]
2. State two reasons why geographers conduct fieldwork instead of only using textbooks or the internet. [2 marks]
3. The following equipment is used in a water quality fieldwork investigation:
| Equipment | Purpose |
|---|---|
| Secchi disc | Measures water __________ |
| pH paper | Measures water __________ |
| Thermometer | Measures water __________ |
Complete the table by filling in the three blanks. [3 marks]
4. Explain why it is important to repeat measurements at least three times during fieldwork data collection. [2 marks]
5. Sally wants to study how litter varies across her school compound. She decides to count litter items in four different locations: the canteen, the field, the classroom block, and the car park.
(a) Identify the independent variable in Sally's investigation. [1 mark]
(b) Suggest one way Sally could make sure she collects fair data at each location. [1 mark]
Section B: Fieldwork Methods and Techniques (Questions 6–10) [10 marks]
6. A group of Secondary 1 students conducted a pedestrian count in Tiong Bahru estate. They stood at different points and counted the number of people passing by in 10 minutes.
(a) Suggest one advantage of using a tally chart to record pedestrian counts during fieldwork. [1 mark]
(b) The students counted pedestrians at Point A from 8:00 a.m. to 8:10 a.m. on Tuesday. Explain why their results might be different if they repeated the count at the same point on Saturday afternoon. [2 marks]
7. During a weather fieldwork investigation, students used the equipment shown below.
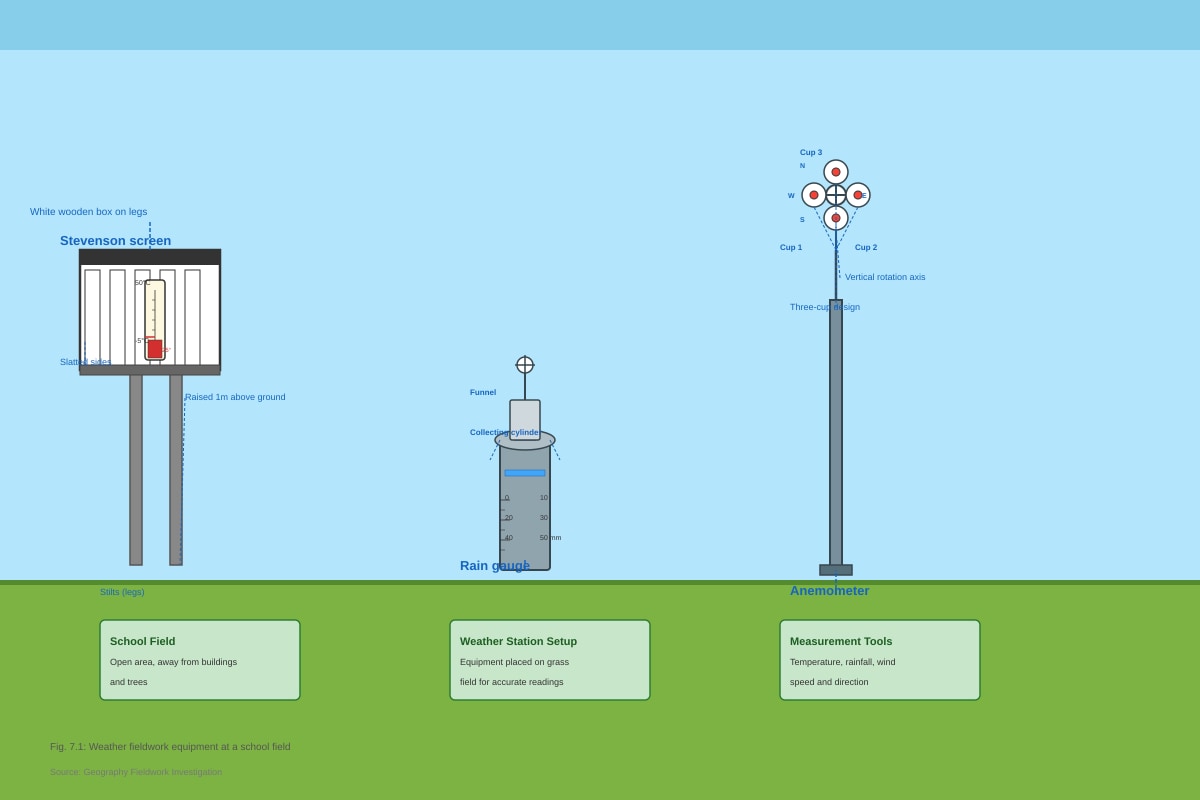
Generated diagram for Q7.
(a) State two features of the Stevenson screen that help ensure accurate temperature readings. [2 marks]
(b) Explain why the rain gauge needs to be placed in an open area away from buildings and trees. [2 marks]
8. Students conducted a land-use survey along a transect from the edge to the centre of Toa Payoh town.
(a) Explain what is meant by a "transect" in fieldwork. [1 mark]
(b) Suggest one difficulty the students might face when conducting a land-use survey along a busy road. [1 mark]
9. In a fieldwork investigation of water quality at three ponds, students recorded these results:
| Pond | pH | Dissolved oxygen (mg/l) | Turbidity (NTU) |
|---|---|---|---|
| A | 6.5 | 8.2 | 15 |
| B | 4.2 | 3.1 | 85 |
| C | 7.0 | 7.5 | 22 |
(a) Which pond has the poorest water quality? Give a reason for your answer using data from the table. [2 marks]
(b) Suggest one possible source of pollution that could cause low pH in a pond. [1 mark]
10. A student wants to investigate whether there is a relationship between distance from the MRT station and the rental prices of HDB flats in a town.
(a) Identify the dependent variable in this investigation. [1 mark]
(b) Name one piece of information the student would need to collect for each flat. [1 mark]
(c) Suggest one way the student could display the results to show the relationship between distance and rental price. [1 mark]
Section C: Data Presentation and Analysis (Questions 11–15) [10 marks]
11. The bar graph below shows litter counts from a fieldwork survey at East Coast Park.
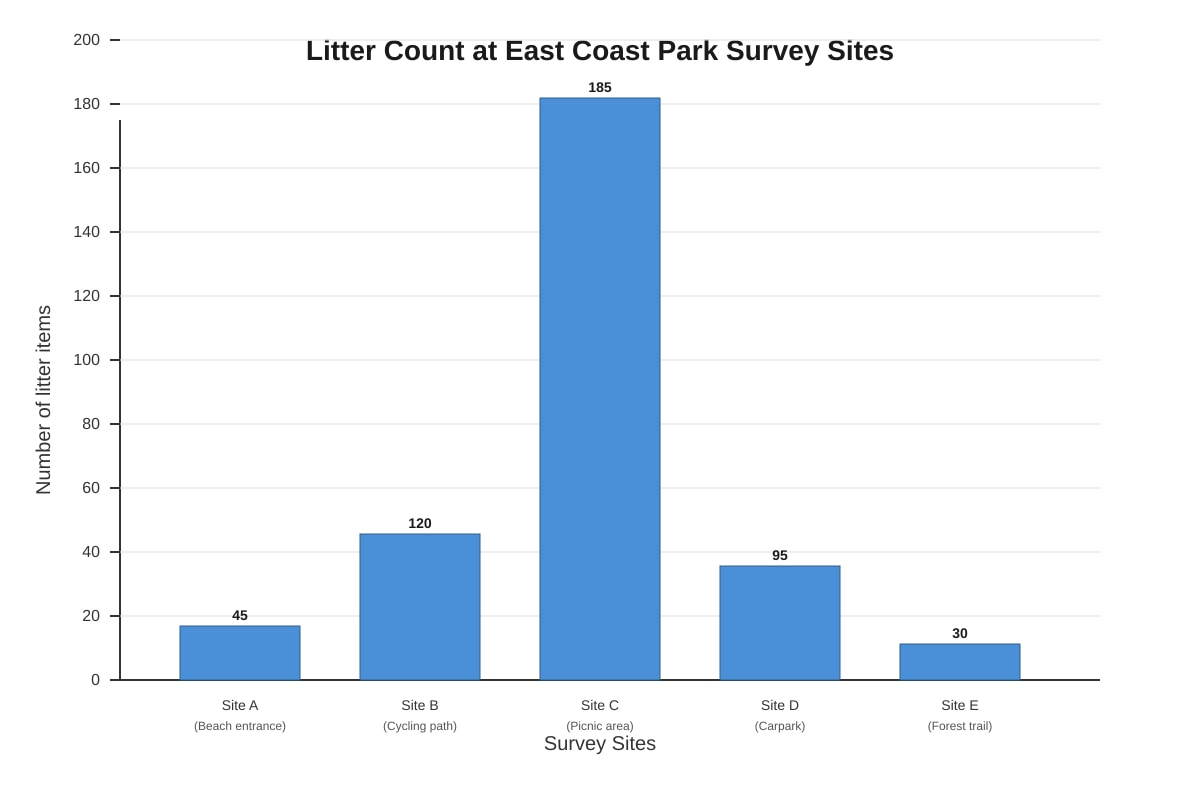
Generated graph for Q11.
(a) Which site had the highest amount of litter? [1 mark]
(b) Calculate the total number of litter items counted across all five sites. Show your working. [2 marks]
(c) Suggest one reason why the picnic area had more litter than the forest trail. [1 mark]
12. Students used a compass to find the direction of the sea breeze during fieldwork at Changi Beach.
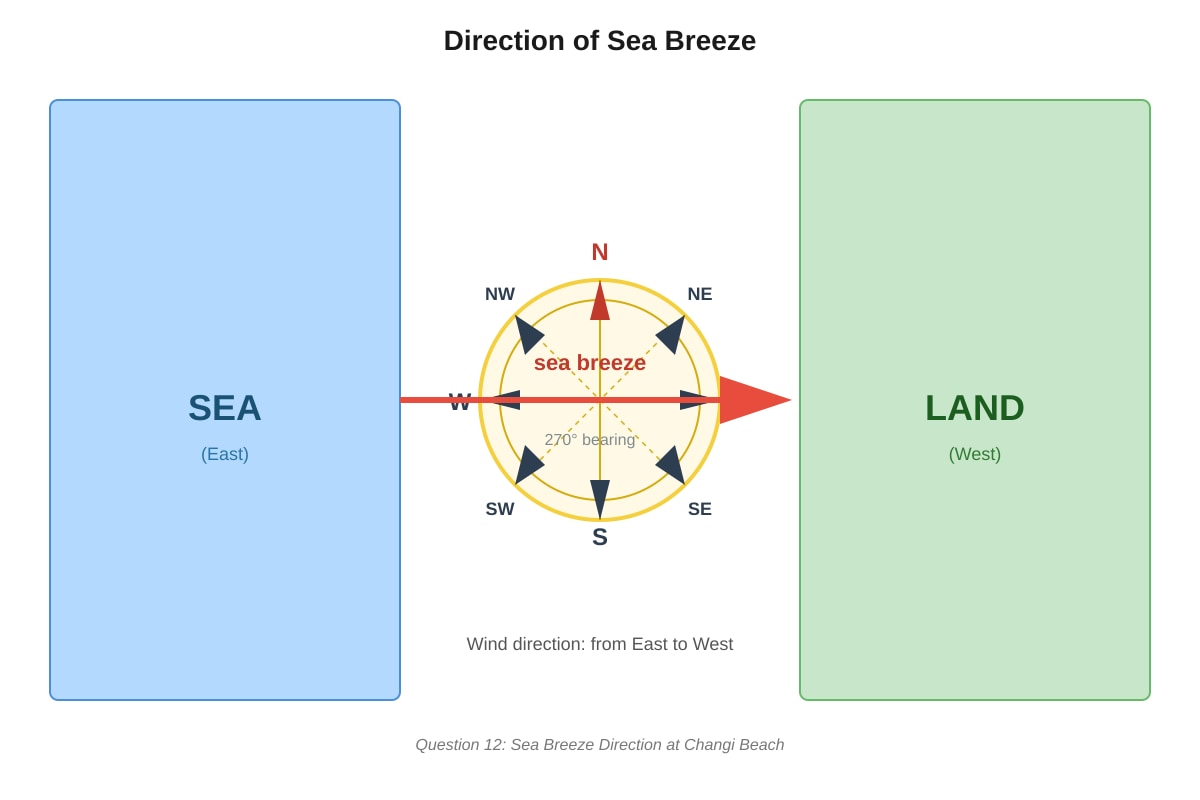
Generated diagram for Q12.
(a) State the direction from which the sea breeze is blowing. [1 mark]
(b) Explain why the wind is called a "sea breeze" rather than a "land breeze." [2 marks]
13. The table shows temperature readings taken every two hours during a fieldwork day at school.
| Time | Temperature (°C) |
|---|---|
| 0800 | 26.5 |
| 1000 | 29.0 |
| 1200 | 32.5 |
| 1400 | 33.0 |
| 1600 | 30.5 |
| 1800 | 27.0 |
(a) Plot these data as a line graph on the grid below. [2 marks]
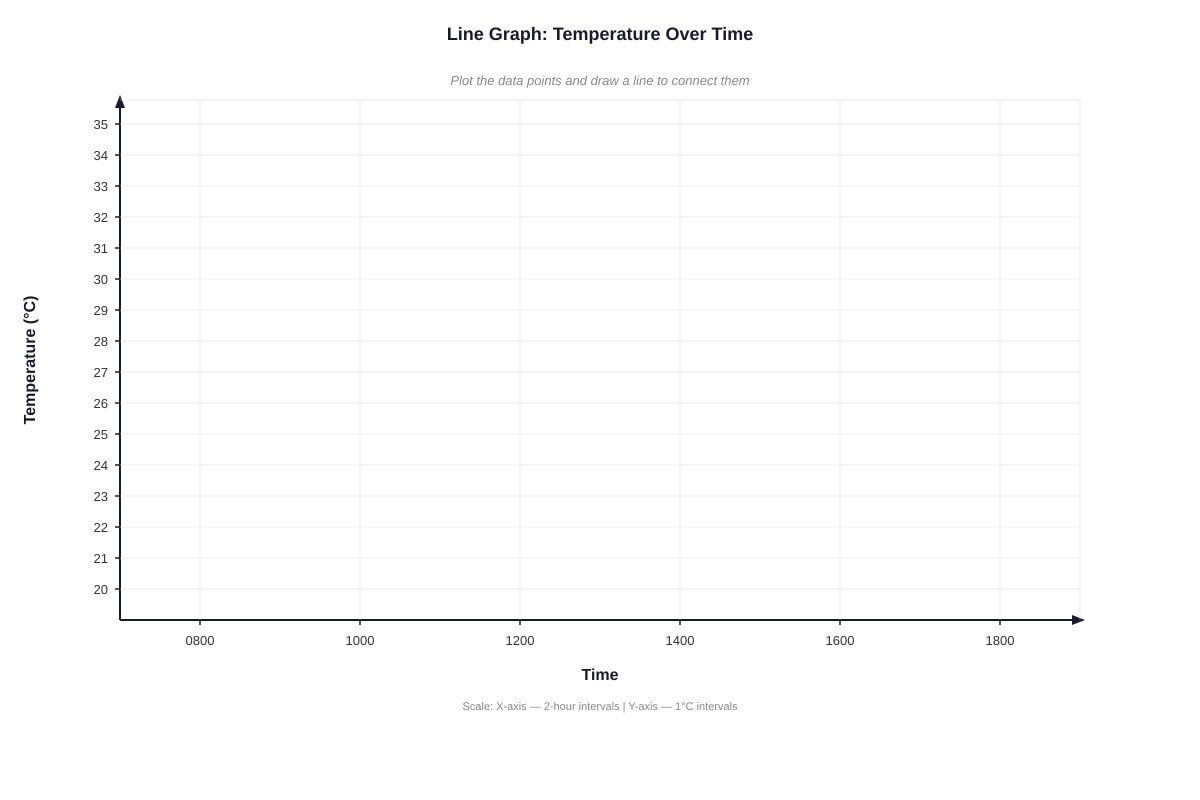
Generated graph for Q13.
(b) At what time was the highest temperature recorded? [1 mark]
(c) Calculate the temperature range for the day. Show your working. [1 mark]
14. During a fieldwork survey of building heights in two areas, students produced this field sketch.
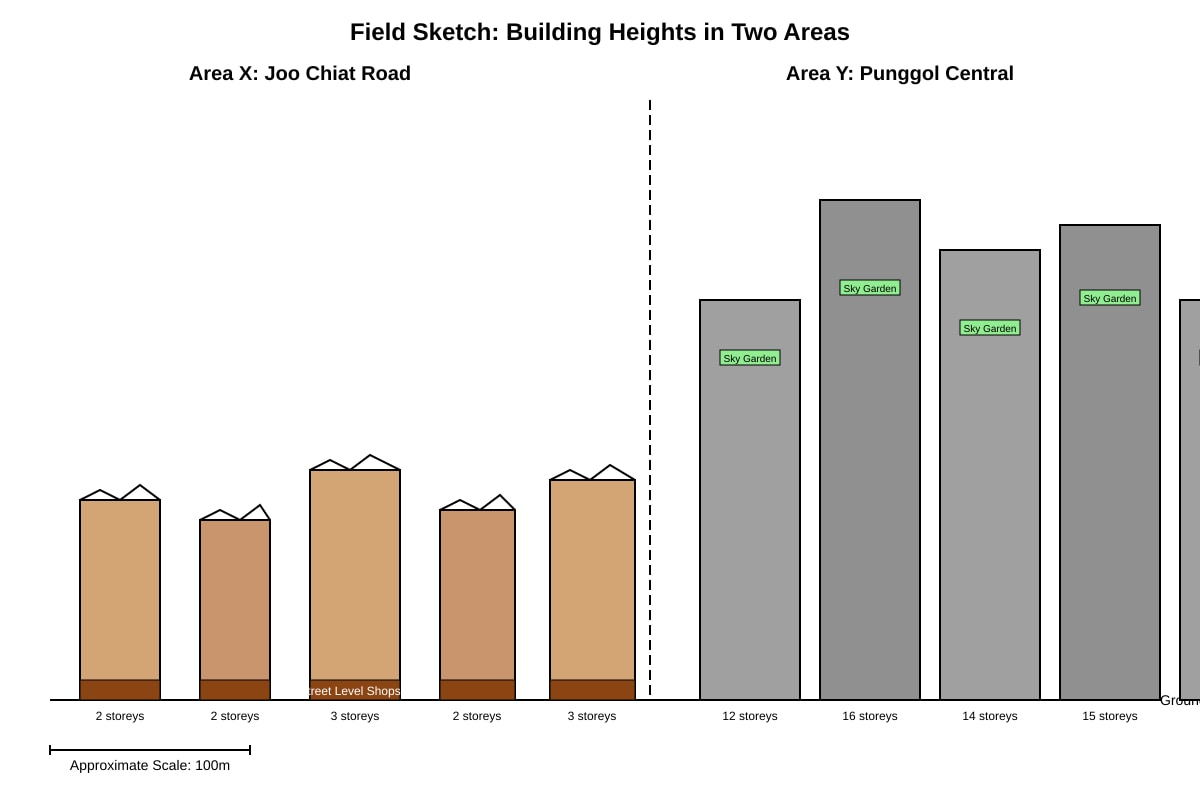
Generated diagram for Q14.
(a) State two differences between the buildings in Area X and Area Y that can be seen in the field sketch. [2 marks]
(b) Suggest one reason why field sketches are useful in geographical fieldwork. [1 mark]
15. A student recorded traffic noise levels at different distances from a busy road during fieldwork:
| Distance from road (m) | Noise level (dB) |
|---|---|
| 5 | 85 |
| 10 | 78 |
| 20 | 70 |
| 40 | 62 |
| 80 | 55 |
Describe the pattern shown by these data. [2 marks]
Section D: Evaluation and Application (Questions 16–20) [10 marks]
16. Three groups of students measured the width of the same stream at the same point using measuring tapes. Their results were:
- Group A: 4.2 m
- Group B: 4.5 m
- Group C: 7.8 m
(a) Calculate the mean (average) stream width if all three measurements are used. Give your answer to one decimal place. [1 mark]
(b) Explain why it would be better to calculate the mean without including Group C's result. [2 marks]
17. Rahim wants to investigate whether people think his neighbourhood is clean. He decides to interview people on the street.
(a) Suggest one advantage of using a questionnaire rather than an interview for this investigation. [1 mark]
(b) Rahim plans to stand outside the community centre on Tuesday morning to ask his questions. Give two reasons why this sampling method might not give him representative results. [2 marks]
18. During a fieldwork trip to a nature reserve, students were asked to evaluate the effectiveness of a sign that read "Do not litter — $300 fine."

Generated source_image for Q18.
(a) Using evidence from the photograph, explain whether the sign appears to be effective. [2 marks]
(b) Suggest one additional measure, other than a fine, that could help reduce littering in the nature reserve. [1 mark]
19. Students conducted fieldwork to compare the amount of shade in the school garden and the school field. They used a light meter at ground level at 12 noon on a sunny day.
(a) Explain why they chose to take measurements at 12 noon rather than at 9 a.m. [2 marks]
(b) The students found that the garden had lower light meter readings than the field. What does this tell them about the amount of shade in each area? [1 mark]
20. A class of 40 students planned to conduct fieldwork at three locations along the Singapore River. However, on the day, there was heavy rain and they could only visit one location.
Explain two ways this change in plan could affect the reliability of their fieldwork results. [4 marks]
END OF QUIZ
Answers
Secondary 1 Geography Quiz - Fieldwork: Answer Key
Total: 40 marks
Section A: Fieldwork Skills and Concepts [10 marks]
1. Define the term "fieldwork" in geography. [2 marks]
Answer: Fieldwork is the collection of data and information outside the classroom (1 mark) in a real-world environment or location being studied (1 mark). It involves geographers going to places to observe, measure, and record geographical phenomena directly.
Teaching note: Fieldwork is central to geography because it allows us to study actual places rather than just reading about them. The key idea is "going out into the field" — outdoors or into real environments.
2. State two reasons why geographers conduct fieldwork instead of only using textbooks or the internet. [2 marks]
Answer: Any two from:
- To collect primary data (data collected firsthand by the researcher) rather than using secondary data (1 mark)
- To observe real-world conditions that may be more current or accurate than published information (1 mark)
- To test theories or hypotheses in actual environments (1 mark)
- To develop practical skills in using geographical equipment (1 mark)
Common mistake: Students sometimes say "to get fresh air" or vague answers. Focus on the nature of data collection and geographical learning.
3. Complete the equipment table. [3 marks]
Answer:
| Equipment | Purpose |
|---|---|
| Secchi disc | Measures water clarity / turbidity / transparency |
| pH paper | Measures water acidity or alkalinity / pH level |
| Thermometer | Measures water temperature |
(1 mark each)
Teaching note:
- Secchi disc: A black-and-white disc lowered into water until it disappears; depth indicates clarity. Used in Singapore's reservoir monitoring.
- pH: Scale from 0 (acidic) to 14 (alkaline); 7 is neutral. Singapore's tap water is typically pH 8.0–8.5.
- Temperature: Important because it affects dissolved oxygen levels and aquatic life.
4. Explain why it is important to repeat measurements at least three times during fieldwork data collection. [2 marks]
Answer: Repeating measurements:
- Allows identification of anomalous results (unusual readings that may be errors) (1 mark)
- Enables calculation of a mean/average which is more reliable than a single reading (1 mark)
- Reduces the impact of random errors or temporary fluctuations in conditions (1 mark)
Marking: Two valid points for 2 marks. Accept equivalent reasoning about accuracy and reliability.
5(a) Identify the independent variable in Sally's investigation. [1 mark]
Answer: The location of the survey site / which area of the school compound (canteen, field, classroom block, car park) (1 mark)
Teaching note: The independent variable is what the investigator deliberately changes or selects. Sally chooses different locations; she does not choose how much litter there is.
5(b) Suggest one way Sally could make sure she collects fair data at each location. [1 mark]
Answer: Any one from:
- Use the same size of survey area/quadrat at each location (1 mark)
- Spend the same amount of time counting at each location (1 mark)
- Conduct the survey at the same time of day to avoid different usage patterns (1 mark)
- Have the same person do the counting to maintain consistent judgement (1 mark)
Section B: Fieldwork Methods and Techniques [10 marks]
6(a) Suggest one advantage of using a tally chart to record pedestrian counts during fieldwork. [1 mark]
Answer: Any one from:
- Quick and easy to use — can keep counting without losing track (1 mark)
- Allows running totals to be seen at a glance (1 mark)
- Easy to transfer to a frequency table later (1 mark)
6(b) Explain why their results might be different if they repeated the count at the same point on Saturday afternoon. [2 marks]
Answer:
- Different day and time = different types of people using the area (1 mark)
- Saturday afternoon likely has more leisure visitors/families compared to Tuesday morning which has commuters/workers (1 mark)
- Weekend vs weekday = different purposes for being in the area, so pedestrian numbers would differ (1 mark)
Marking: 1 mark for identifying a relevant difference in user group; 1 mark for explaining impact on count.
7(a) State two features of the Stevenson screen that help ensure accurate temperature readings. [2 marks]
Answer: Any two from:
- Painted white — reflects sunlight rather than absorbing heat, preventing overheating (1 mark)
- Louvred/slatted sides — allows air to flow through while keeping out direct rain and sunlight (1 mark)
- Raised on legs/stilts (typically 1.2–1.5m above ground) — avoids ground heat radiation affecting readings (1 mark)
- Double-louvred construction — provides insulation from external temperature changes (1 mark)
7(b) Explain why the rain gauge needs to be placed in an open area away from buildings and trees. [2 marks]
Answer:
- Buildings and trees can block rain from falling into the gauge, causing underestimates (1 mark)
- Trees can drip extra water from leaves into the gauge after rain stops, causing overestimates (1 mark)
- Splash from hard surfaces or overflow from roofs could contaminate readings (1 mark)
Marking: Any two distinct reasons for 2 marks. "Obstruction" and "splash/drip" are the main categories.
8(a) Explain what is meant by a "transect" in fieldwork. [1 mark]
Answer: A transect is a line across an area along which systematic measurements or observations are taken (1 mark). Students walk along this line and record changes at regular intervals.
8(b) Suggest one difficulty the students might face when conducting a land-use survey along a busy road. [1 mark]
Answer: Any one from:
- Traffic danger — risk of accidents when crossing roads or walking beside traffic (1 mark)
- Noise — difficulty communicating and concentrating (1 mark)
- Limited visibility of buildings behind walls or fences (1 mark)
- Privacy/security concerns when taking notes or photographs (1 mark)
9(a) Which pond has the poorest water quality? Give a reason using data. [2 marks]
Answer: Pond B (1 mark)
Reason: Pond B has the lowest pH (4.2, which is strongly acidic), the lowest dissolved oxygen (3.1 mg/l, too low for most fish and aquatic life), and the highest turbidity (85 NTU, meaning very cloudy water) (1 mark for any valid data-supported reason).
Teaching note: Dissolved oxygen below 5 mg/l stresses most aquatic life; pH below 6 is harmful. Turbidity blocks sunlight for photosynthesis.
9(b) Suggest one possible source of pollution that could cause low pH in a pond. [1 mark]
Answer: Any one from:
- Acid rain from air pollution (1 mark)
- Industrial discharge or chemical runoff (1 mark)
- Decomposition of large amounts of organic matter producing acids (1 mark)
- Runoff from fertilised fields/gardens causing algal blooms then decomposition (1 mark)
10(a) Identify the dependent variable. [1 mark]
Answer: Rental price of HDB flats (1 mark)
Teaching note: The dependent variable is what is measured or observed — it "depends on" the independent variable (distance from MRT).
10(b) Name one piece of information needed for each flat. [1 mark]
Answer: Any one from:
- Monthly rental price (1 mark)
- Exact distance from nearest MRT station (1 mark)
- Flat type (2-room, 3-room, etc.) to control for size differences (1 mark)
- Floor level as this affects price (1 mark)
10(c) Suggest one way to display results showing the relationship. [1 mark]
Answer: A scatter graph (1 mark) — this shows if there is a correlation between distance (x-axis) and rental price (y-axis).
Alternative: A line graph if distances are grouped, or a bar chart comparing average rents in distance bands.
Section C: Data Presentation and Analysis [10 marks]
11(a) Which site had the highest amount of litter? [1 mark]
Answer: Site C (Picnic area) (1 mark)
11(b) Calculate the total number of litter items. [2 marks]
Working: 45 + 120 + 185 + 95 + 30 = 165 + 185 + 95 + 30 = 350 + 95 + 30 = 445 + 30 = 475 items (1 mark for correct method/addition, 1 mark for correct answer)
11(c) Suggest one reason why the picnic area had more litter than the forest trail. [1 mark]
Answer: Any one from:
- More people gathering to eat at picnic areas, generating food packaging waste (1 mark)
- No bins nearby or bins overflowing (1 mark)
- Less frequent cleaning scheduled for picnic areas compared to main paths (1 mark)
12(a) State the direction from which the sea breeze is blowing. [1 mark]
Answer: East / from the sea / E / approximately 090° (1 mark)
12(b) Explain why it is called a "sea breeze" rather than a "land breeze." [2 marks]
Answer:
- During the day, land heats up faster than sea (1 mark)
- Air over the land becomes warmer, rises, and creates low pressure over land (1 mark)
- Cooler air from over the sea (high pressure) moves inland to replace it — this is the sea breeze blowing from sea to land (1 mark)
Marking: 2 marks for complete explanation of differential heating and pressure-driven air movement. Contrast with land breeze (night, land cools faster, wind blows from land to sea) not required but may be included.
13(a) Plot the line graph. [2 marks]
Answer features required (to be checked against visual):
- All six points correctly plotted (±0.5°C tolerance) — 1 mark
- Points joined with straight line or smooth curve, axes labelled with units, correct title — 1 mark
Marking points: Deduct if axes unlabelled or no units. Accept smooth curve showing single peak.
13(b) At what time was the highest temperature recorded? [1 mark]
Answer: 1400 / 2:00 p.m. (1 mark)
13(c) Calculate the temperature range. [1 mark]
Working: 33.0 − 26.5 = 6.5°C (1 mark)
Teaching note: Temperature range = maximum − minimum. The highest was 33.0°C at 1400; the lowest was 26.5°C at 0800.
14(a) State two differences between buildings in Area X and Area Y. [2 marks]
Answer: Any two from:
- Area X buildings are low-rise (2–3 storeys) while Area Y buildings are high-rise (12–16 storeys) (1 mark)
- Area X has irregular rooflines/varied heights while Area Y has uniform flat roofs/similar heights (1 mark)
- Area X has shops at street level while Area Y has sky gardens/communal facilities (1 mark)
- Area X appears older/historic (Joo Chiat shophouses) while Area Y appears newer/modern (Punggol HDB) (1 mark)
14(b) Suggest one reason why field sketches are useful. [1 mark]
Answer: Any one from:
- Quick to produce in the field without special equipment (1 mark)
- Can highlight key features by exaggerating important details (1 mark)
- Provides a visual record of what the area looked like at that time (1 mark)
- Helps remember spatial relationships between features (1 mark)
15. Describe the pattern shown by these data. [2 marks]
Answer:
- As distance from the road increases, noise level decreases (1 mark)
- The relationship is non-linear — noise drops rapidly at first (85 to 78 dB in first 5m, then 78 to 70 dB in next 10m) but the rate of decrease slows down at greater distances (1 mark)
- OR: The greatest decrease occurs in the first 15m from the road (1 mark)
Section D: Evaluation and Application [10 marks]
16(a) Calculate the mean stream width. [1 mark]
Working: (4.2 + 4.5 + 7.8) ÷ 3 = 16.5 ÷ 3 = 5.5 m (1 mark)
16(b) Explain why it would be better to calculate the mean without Group C's result. [2 marks]
Answer:
- Group C's measurement (7.8 m) is much higher than Groups A and B, suggesting it may be an anomalous result / error in measurement (1 mark)
- Including it would distort the mean and make it unrepresentative of the actual stream width — 5.0 m (from A and B) is more likely correct (1 mark)
- Possible reasons for C's error: measured at a different point, tape not straight, included a tributary, misread the scale (1 mark for any valid explanation)
17(a) Suggest one advantage of using a questionnaire rather than an interview. [1 mark]
Answer: Any one from:
- Anonymity — people may give more honest answers about sensitive topics like neighbourhood cleanliness (1 mark)
- Standardised questions — easier to compare responses quantitatively (1 mark)
- Quicker to distribute to many people, reaching larger sample size (1 mark)
- No interviewer bias — interviewer cannot influence answers by tone or expression (1 mark)
17(b) Give two reasons why this sampling method might not give representative results. [2 marks]
Answer: Any two from:
- Tuesday morning attracts mainly elderly residents and stay-home parents, missing working adults and students (1 mark)
- Community centre location biases sample toward people who visit community centres — gym users, library visitors — not typical residents (1 mark)
- Self-selection bias — only friendly or less busy people may agree to participate (1 mark)
- Small sample from one location cannot represent whole neighbourhood (1 mark)
18(a) Using evidence from the photograph, explain whether the sign appears effective. [2 marks]
Answer:
- The sign appears not very effective (1 mark for judgement supported by evidence)
- Evidence: There are 8–10 visible litter items within 10 metres of the sign (plastic bottles and food wrappers clearly visible), showing people are ignoring the warning despite the fine (1 mark)
Alternative acceptable judgement: "Partially effective" with evidence that some areas are clean but litter remains nearby.
18(b) Suggest one additional measure to reduce littering. [1 mark]
Answer: Any one from:
- More bins placed conveniently so people do not need to carry litter far (1 mark)
- Educational campaigns about wildlife harm from litter (1 mark)
- Volunteer clean-up days to build community ownership (1 mark)
- Redesign packaging to reduce single-use plastics entering the reserve (1 mark)
19(a) Explain why measurements were taken at 12 noon rather than 9 a.m. [2 marks]
Answer:
- 12 noon is when the sun is highest in the sky / near solar noon (1 mark)
- This produces the strongest, most direct sunlight, making the difference between shaded and unshaded areas most obvious and measurable (1 mark)
- At 9 a.m., lower sun angle means longer shadows and more diffuse light, making comparisons less clear (1 mark)
Marking: 2 marks for complete explanation. The key is understanding solar angle and measurement sensitivity.
19(b) What does this tell them about shade in each area? [1 mark]
Answer: The garden has more shade than the field (1 mark) — lower light readings indicate less direct sunlight reaching the ground, meaning more vegetation or structures are blocking light.
20. Explain two ways this change in plan could affect reliability of results. [4 marks]
Answer: Any two valid points, developed with explanation:
Point 1: Reduced sample size and representativeness
- Only one location instead of three means less data to analyse (1 mark)
- Results cannot show patterns or differences along the river — e.g., whether water quality improves or worsens downstream — reducing reliability of any conclusions (1 mark)
Point 2: Weather conditions affecting measurements
- Heavy rain could dilute pollutants temporarily, giving unrepresentative water quality readings (1 mark)
- Alternatively, rain could wash more litter and runoff into the river, temporarily worsening readings in ways not typical of normal conditions (1 mark)
- Students cannot compare wet-weather vs dry-weather conditions (1 mark)
Point 3: Time pressure and rushed measurements
- With less time at one location, students may rush their procedures and make more errors (1 mark)
- Fewer repeated measurements = greater chance of random errors affecting results (1 mark)
Marking: 2 marks per well-developed point. Maximum 4 marks.
END OF ANSWER KEY
Free quiz and exam paper access
Enter your details to view this paper
Your access is remembered on this device.