From Real Exams Quiz
Secondary 1 Geography Fieldwork Quiz
Free Sec 1 Geography Fieldwork quiz, HY3 Exam version, with questions, answers, and syllabus-aligned practice for Singapore students.
These static practice materials are generated from the site's syllabus and paper-generation workflow, with source and model context shown so students and parents can evaluate the material before use.
Questions
Secondary 1 Geography Quiz - Fieldwork
Name:
Class:
Date:
Score:
Duration: 45 minutes
Total Marks: 40
Instructions:
- This quiz has 20 questions on the topic of Fieldwork.
- Section A: Multiple Choice (Questions 1–5)
- Section B: Short Answer (Questions 6–10)
- Section C: Data & Structured Response (Questions 11–20)
- Write your answers in the spaces provided.
Section A: Multiple Choice (1 mark each)
-
What is the main purpose of conducting fieldwork in Geography?
A. To memorise textbook definitions
B. To collect first-hand data about a place or environment
C. To avoid using maps
D. To copy information from the internetAnswer: ______
-
Which of the following is a primary source of data collected during fieldwork?
A. A textbook map
B. A newspaper article
C. Water temperature measured at a river
D. A teacher's lecture notesAnswer: ______
-
When using a 4-figure grid reference, which direction is read first?
A. Northing then easting
B. Easting then northing
C. Contour then scale
D. Scale then contourAnswer: ______
-
Why is it important to record the time of day when measuring water temperature in fieldwork?
A. To fill the notebook with extra writing
B. Because temperature can change during the day
C. To match the school timetable
D. It is not important at allAnswer: ______
-
What does a higher turbidity value in a water sample usually indicate?
A. The water is very clear
B. The water has more suspended particles
C. The water has low temperature
D. The water has more dissolved oxygenAnswer: ______
Section B: Short Answer (2 marks each)
-
State one advantage of using a field sketch compared to a photograph during fieldwork.
Answer: ___________________________________________________________
-
Give two examples of equipment a Secondary 1 student may use to test water quality at a reservoir.
Answer: ___________________________________________________________
-
Explain why a class should take more than one reading at each fieldwork site.
Answer: ___________________________________________________________
-
What is a 4-figure grid reference used for on a fieldwork map?
Answer: ___________________________________________________________
-
State one safety precaution students should follow when doing fieldwork near water.
Answer: ___________________________________________________________
Section C: Data & Structured Response
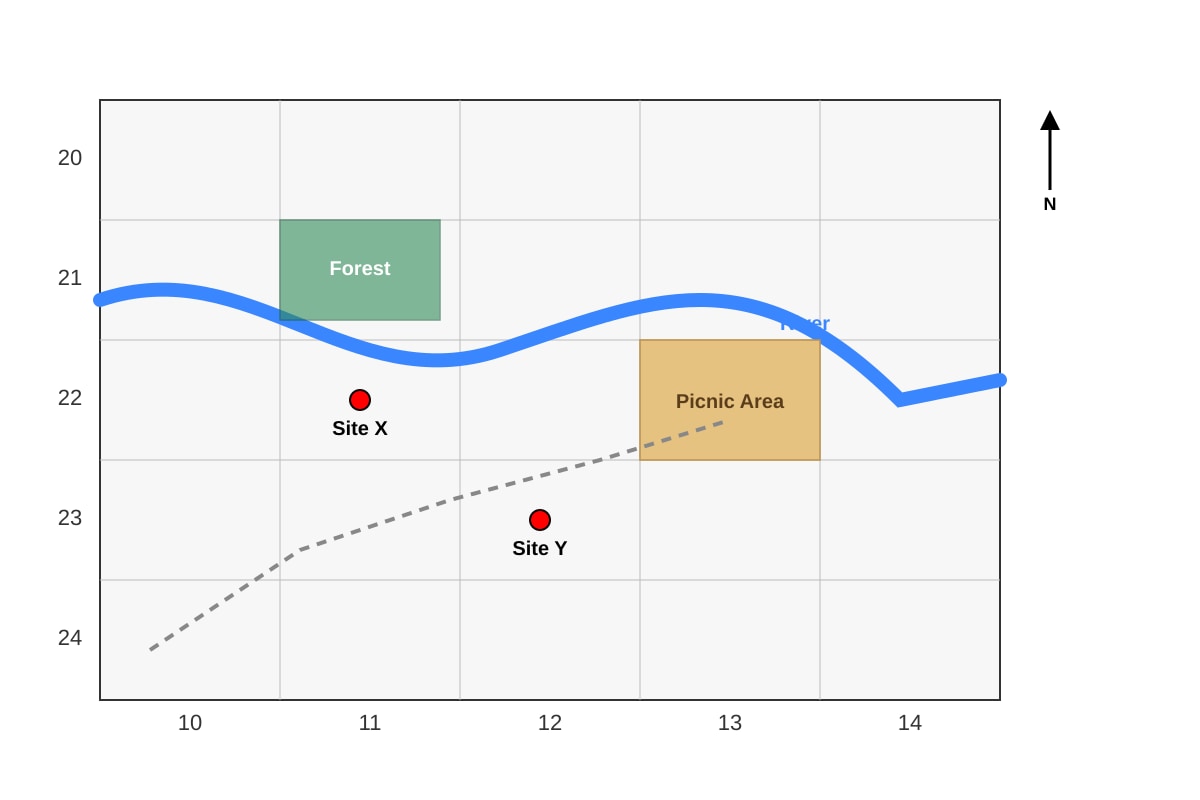
The map below shows two water testing sites at a local park used by a Secondary 1 class.

Generated map for Q11.
-
(a) State the 4-figure grid reference of Site X. (1 mark)
Answer: ______
(b) State the 4-figure grid reference of Site Y. (1 mark)
Answer: ______ -
The class recorded the following water quality data:
| Site | Temperature (°C) | Turbidity (NTU) | Dissolved Oxygen (mg/L) |
|---|---|---|---|
| X | 27.5 | 8 | 6.2 |
| Y | 28.1 | 15 | 4.8 |
Describe one difference between the water quality at Site X and Site Y. (2 marks)
Answer: ___________________________________________________________
- Using the table in Q12, explain which site has healthier water for aquatic life. (3 marks)
Answer: ___________________________________________________________
- Suggest one reason why Site Y has higher turbidity than Site X, using map evidence. (2 marks)
Answer: ___________________________________________________________
- A student measured the width of the river at Site X using a metre tape. The left bank was at 0.0 m and the right bank at 4.6 m. Calculate the river width. (2 marks)
Answer: ___________________________________________________________
- The class counted 12 litter items at Site X and 27 litter items at Site Y. Calculate the difference in litter count between the two sites. (2 marks)
Answer: ___________________________________________________________
- Field sketches should include certain features. State three features a good field sketch must show. (3 marks)
Answer: ___________________________________________________________
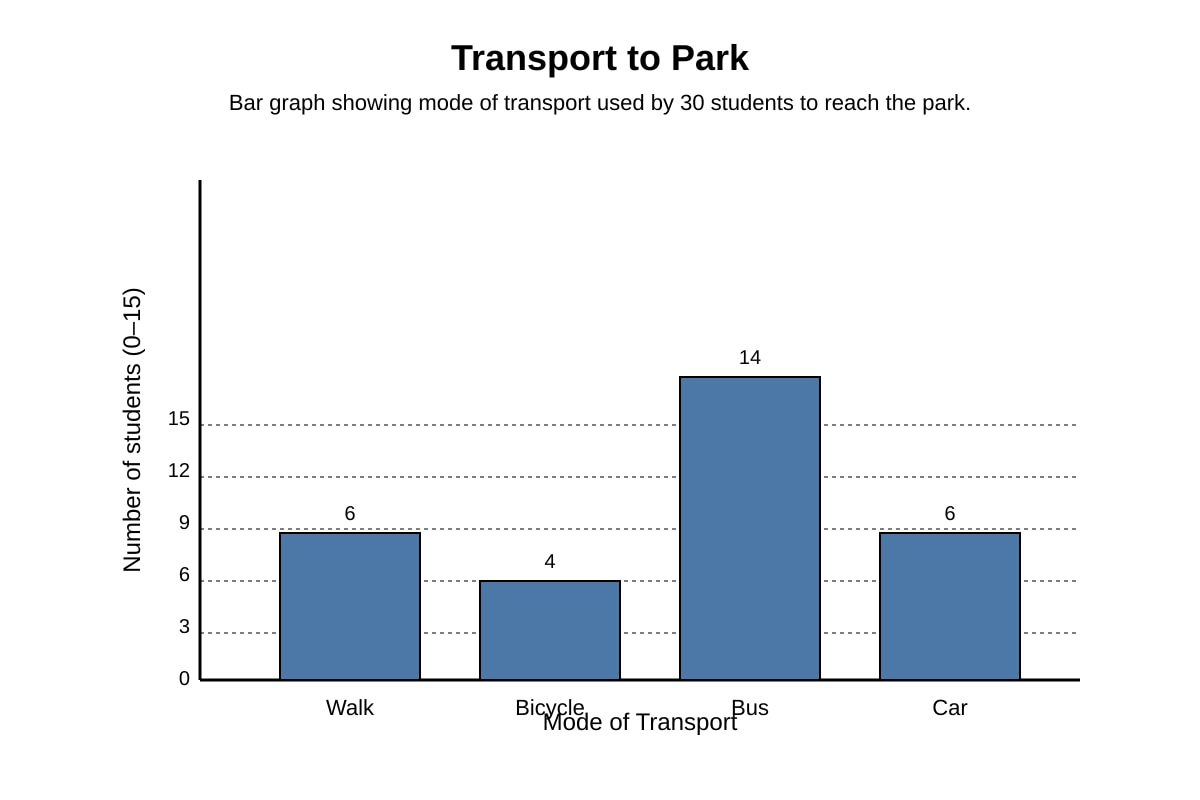
- Study the bar graph of student survey results on transport to the park.

Generated graph for Q18.
With reference to the graph, state the most common transport and how many students used it. (2 marks)
Answer: ___________________________________________________________
- Explain why a fieldworker should label a photograph with date, time, and location. (2 marks)
Answer: ___________________________________________________________
- A Secondary 1 class did fieldwork at a mangrove. Give two fieldwork methods they could use to study the mangroves. (2 marks)
Answer: ___________________________________________________________
Answers
Secondary 1 Geography Quiz - Fieldwork (Answer Key)
Total Marks: 40
Topic: Fieldwork
Section A: Multiple Choice
-
B (1 mark)
Teaching note: Fieldwork means going out to a real place to observe and collect data yourself. It is not about memorising or copying from books. Choice B is correct because geographers use fieldwork to get first-hand information. -
C (1 mark)
Teaching note: A primary source is data you collect directly. Water temperature measured at a river is first-hand data. Textbook maps and newspaper articles are secondary sources. -
B (1 mark)
Teaching note: Grid references always read easting (horizontal, left-to-right) first, then northing (vertical, bottom-to-top). This is a common exam trap—do not reverse the order. -
B (1 mark)
Teaching note: Air and water temperatures rise and fall during the day. Recording time helps others understand why a reading was high or low. -
B (1 mark)
Teaching note: Turbidity measures how cloudy water is. Higher NTU means more suspended soil or particles, not clearer water.
Section B: Short Answer
-
(Any one) A field sketch can highlight only important features; it is not distracted by extra background; it can show direction and labels clearly. (2 marks)
Marking: 1 mark for valid advantage, 1 mark for brief explanation if needed. -
Any two: thermometer, turbidity tube, pH paper, measuring tape, notebook, camera. (2 marks: 1 mark each)
Teaching note: These are common Sec 1 fieldwork tools for water study. -
To check accuracy / reduce error / because one reading may be a mistake. (2 marks: 1 for point, 1 for reason)
Teaching note: Repeated readings let students find an average and spot odd results. -
To show the location of a place on a map using easting and northing numbers. (2 marks)
Teaching note: 4-figure grid reference gives the grid square (e.g., 1222). -
Any one: Stay with a buddy; wear non-slip shoes; do not go into deep water; listen to teacher. (2 marks)
Section C: Data & Structured Response
-
(a) 1222 (1 mark)
(b) 1323 (1 mark)
Teaching note: Read easting (12 / 13) first, then northing (22 / 23). Use lower-left corner of square. -
One difference e.g., Site Y has higher turbidity (15 NTU) than Site X (8 NTU); OR Site X has higher dissolved oxygen (6.2) than Site Y (4.8). (2 marks: 1 for correct value comparison, 1 for naming the variable)
-
Site X has healthier water. (1 mark)
Reasons: Lower turbidity (8 vs 15) means clearer water; higher dissolved oxygen (6.2 vs 4.8) supports fish and plants. (2 marks)
Teaching note: Aquatic life needs oxygen and clear water with less suspended dirt. -
Site Y is near the Picnic Area (from map), so more soil or litter may wash in; OR less forest cover near Y. (2 marks: 1 for map link, 1 for reason)
-
Width = 4.6 m − 0.0 m = 4.6 m (2 marks: 1 for subtraction, 1 for unit)
Working: Right bank 4.6 m − left bank 0.0 m = 4.6 m. -
Difference = 27 − 12 = 15 items (2 marks: 1 for calculation, 1 for unit/answer)
-
Any three: title, north arrow, scale, labels of features, simple drawings of landforms, date. (3 marks: 1 each)
-
Most common: Bus (14 students). (2 marks: 1 for mode, 1 for number)
Teaching note: Bar graph shows Bus bar tallest at 14. -
So others know when and where the photo was taken; helps in writing the report. (2 marks)
-
Any two: field sketch of mangrove trees, count aerial roots, measure salinity, record species, take photos. (2 marks: 1 each)
Free quiz and exam paper access
Enter your details to view this paper
Your access is remembered on this device.