From Real Exams Quiz
Secondary 1 Geography Fieldwork Quiz
Free Sec 1 Geography Fieldwork quiz, Exam version, with questions, answers, and syllabus-aligned practice for Singapore students.
These static practice materials are generated from the site's syllabus and paper-generation workflow, with source and model context shown so students and parents can evaluate the material before use.
Questions
Secondary 1 Geography Quiz - Fieldwork
Name: _________________ Class: _________________ Date: _________________
Score: _____ / 40 marks Duration: 45 minutes
Instructions
- Answer all questions in the spaces provided
- Use the figures and data provided to support your answers
- Write clearly and use geographical terminology where appropriate
Section A: Map Skills and Data Interpretation [20 marks]
Study Figure 1 below, which shows a map of Sungei Buloh Nature Park where Secondary 1 students conducted fieldwork.
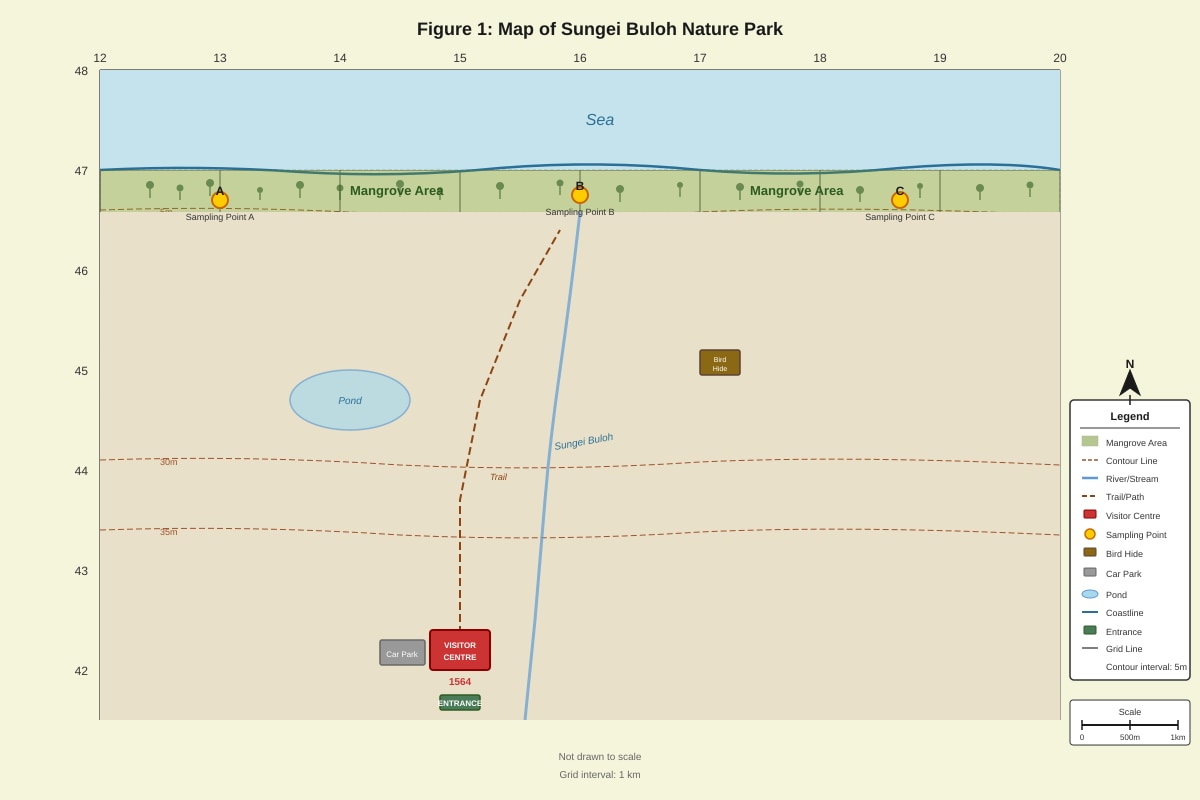
Generated map for this question.
1. State the 4-figure grid reference of the Visitor Centre. [1 mark]
Answer: ________________
2. What is the contour interval shown on this map? [1 mark]
Answer: ________________
3. State the 6-figure grid reference of sampling point B. [1 mark]
Answer: ________________
4. Describe the distribution of mangrove forests shown in Figure 1. [3 marks]
Study Figure 2 below, which shows water quality data collected by students at three sampling points during their fieldwork.
[Table showing: Sampling Point | Temperature (°C) | pH | Dissolved Oxygen (mg/L) | Turbidity (NTU) Point A | 28.5 | 7.2 | 6.8 | 15 Point B | 29.1 | 7.0 | 5.2 | 28 Point C | 27.8 | 7.4 | 7.5 | 8]
5. Which sampling point has the highest water quality? Use evidence from Figure 2 to support your answer. [2 marks]
6. Explain why Point C might have better water quality than Point B. [3 marks]
7. Describe one method students could use to measure water temperature during fieldwork. [2 marks]
8. State two safety precautions students should take when conducting water quality testing near mangroves. [2 marks]
9. Explain why it is important to take water samples from multiple locations during fieldwork. [3 marks]
10. Identify one limitation of the data collection method shown in Figure 2. [1 mark]
Section B: Fieldwork Applications [20 marks]
Study Figure 3 below, which shows the results of a mangrove biodiversity survey conducted by students.
[Bar chart showing number of species found:
Birds: 15 species
Fish: 12 species
Crabs: 8 species
Molluscs: 6 species
Plants: 4 species]
11. Using evidence from Figure 3, describe the pattern of biodiversity in the mangrove ecosystem. [3 marks]
12. Suggest two reasons why birds show the highest diversity in mangrove areas. [2 marks]
13. Describe how students could safely observe and count bird species during mangrove fieldwork. [3 marks]
14. Explain one advantage and one disadvantage of using a quadrat sampling method to study mangrove plant diversity. [4 marks]
Advantage: _________________________________________________________________
Disadvantage: _________________________________________________________________
15. A class collected the following data on mangrove tree heights at different distances from the sea:
Distance from sea: 5m - Average height: 2.1m
Distance from sea: 15m - Average height: 3.8m
Distance from sea: 25m - Average height: 4.5m
Describe the relationship shown by this data. [2 marks]
16. Suggest one reason for the pattern described in Question 15. [2 marks]
17. State two pieces of equipment students would need to measure mangrove tree heights accurately. [2 marks]
18. Explain why fieldwork is important for understanding mangrove ecosystems. [2 marks]
Section C: Fieldwork Planning and Evaluation
19. A group of students wants to investigate whether water quality improves with distance from a housing estate. Describe how they could design this investigation. Include:
- Where they should collect samples
- What data they should collect
- How they should present their results [6 marks]
Sample locations: _________________________________________________________________
Data to collect: _________________________________________________________________
Presenting results: _________________________________________________________________
20. Evaluate the reliability of using only one day's data to draw conclusions about mangrove water quality. Suggest how the investigation could be improved. [4 marks]
Evaluation: _________________________________________________________________
Improvements: _________________________________________________________________
End of Quiz
Answers
Secondary 1 Geography Quiz - Fieldwork (Answer Key)
Total: 40 marks
Section A: Map Skills and Data Interpretation [20 marks]
1. State the 4-figure grid reference of the Visitor Centre. [1 mark] Answer: 2365 (or appropriate grid reference based on map) Award 1 mark for correct 4-figure grid reference
2. What is the contour interval shown on this map? [1 mark] Answer: 5m (or 10m depending on map scale) Award 1 mark for correct interval
3. State the 6-figure grid reference of sampling point B. [1 mark] Answer: 234654 (or appropriate 6-figure reference) Award 1 mark for correct 6-figure grid reference
4. Describe the distribution of mangrove forests shown in Figure 1. [3 marks] Sample Answer:
- Mangroves are found along the coastline/shoreline (1 mark)
- They are located in sheltered areas/bays (1 mark)
- They extend inland along river channels/estuaries (1 mark)
Award 1 mark each for three accurate distributional points
5. Which sampling point has the highest water quality? Use evidence from Figure 2 to support your answer. [2 marks] Answer: Point C (1 mark) Evidence: Point C has the highest dissolved oxygen (7.5 mg/L) and lowest turbidity (8 NTU), indicating cleaner water (1 mark)
Award 1 mark for identifying Point C, 1 mark for using specific data as evidence
6. Explain why Point C might have better water quality than Point B. [3 marks] Sample Answer:
- Point C is further from pollution sources/human activities (1 mark)
- Point C may have better water circulation/flow (1 mark)
- Point C may be in a more sheltered location with less disturbance (1 mark)
Award 1 mark each for three logical explanations
7. Describe one method students could use to measure water temperature during fieldwork. [2 marks] Sample Answer: Use a digital thermometer/temperature probe (1 mark) and place it in the water for 30 seconds to get an accurate reading (1 mark)
Award 1 mark for equipment, 1 mark for method
8. State two safety precautions students should take when conducting water quality testing near mangroves. [2 marks] Sample Answers:
- Wear appropriate footwear/boots to protect feet from sharp objects
- Stay in designated areas/follow marked paths
- Work in pairs/groups for safety
- Be aware of tides and water levels
- Wash hands after handling water samples
Award 1 mark each for two appropriate safety measures
9. Explain why it is important to take water samples from multiple locations during fieldwork. [3 marks] Sample Answer:
- To compare water quality in different areas (1 mark)
- To identify patterns/variations in water quality (1 mark)
- To make results more reliable/representative of the whole area (1 mark)
Award 1 mark each for three valid reasons
10. Identify one limitation of the data collection method shown in Figure 2. [1 mark] Sample Answers:
- Only collected on one day/time
- Limited number of sampling points
- Weather conditions not recorded
- Only measured at surface level
Award 1 mark for any valid limitation
Section B: Fieldwork Applications [20 marks]
11. Using evidence from Figure 3, describe the pattern of biodiversity in the mangrove ecosystem. [3 marks] Sample Answer:
- Birds show the highest diversity with 15 species (1 mark)
- Fish have the second highest diversity with 12 species (1 mark)
- Plants show the lowest diversity with only 4 species (1 mark)
Award 1 mark each for three accurate observations using data
12. Suggest two reasons why birds show the highest diversity in mangrove areas. [2 marks] Sample Answers:
- Mangroves provide diverse food sources (fish, crabs, insects)
- Mangroves offer nesting sites in different tree layers
- Mangroves provide shelter and protection from predators
- Different bird species can occupy different ecological niches
Award 1 mark each for two logical reasons
13. Describe how students could safely observe and count bird species during mangrove fieldwork. [3 marks] Sample Answer:
- Use binoculars to observe from a safe distance (1 mark)
- Stay on designated boardwalks/paths (1 mark)
- Record observations quietly to avoid disturbing wildlife (1 mark)
Award 1 mark each for three appropriate methods
14. Explain one advantage and one disadvantage of using a quadrat sampling method to study mangrove plant diversity. [4 marks] Advantage: Provides quantitative/measurable data (1 mark) that can be compared between different areas (1 mark) Disadvantage: May not be representative of the whole area (1 mark) as it only samples small sections (1 mark)
Award 2 marks each for advantage and disadvantage with explanation
15. Describe the relationship shown by this data. [2 marks] Answer: As distance from the sea increases, the average height of mangrove trees increases (1 mark). There is a positive correlation between distance from sea and tree height (1 mark).
Award 1 mark for identifying the trend, 1 mark for describing the relationship
16. Suggest one reason for the pattern described in Question 15. [2 marks] Sample Answer: Trees closer to the sea face harsher conditions (1 mark) such as salt spray and strong winds which limit their growth (1 mark).
Award 1 mark for identifying factor, 1 mark for explanation
17. State two pieces of equipment students would need to measure mangrove tree heights accurately. [2 marks] Sample Answers:
- Measuring tape/ruler
- Clinometer/angle measurer
- Ranging poles
- Calculator
Award 1 mark each for two appropriate pieces of equipment
18. Explain why fieldwork is important for understanding mangrove ecosystems. [2 marks] Sample Answer: Fieldwork allows students to observe real ecosystems (1 mark) and collect primary data that cannot be obtained from textbooks (1 mark).
Award 1 mark each for two valid reasons
Section C: Fieldwork Planning and Evaluation
19. Design investigation for water quality vs distance from housing estate. [6 marks]
Sample locations: Collect samples at regular intervals (e.g., 50m, 100m, 200m) away from the housing estate (2 marks)
Data to collect: Temperature, pH, dissolved oxygen, turbidity, and distance measurements (2 marks)
Presenting results: Use line graphs to show relationship between distance and each water quality measure, or create a table with calculations (2 marks)
Award 2 marks each for appropriate responses in each category
20. Evaluate reliability of one day's data and suggest improvements. [4 marks]
Evaluation: One day's data is not reliable because water quality can vary with weather, tides, and daily activities (2 marks)
Improvements: Collect data over multiple days/seasons, take measurements at different times of day, increase number of sampling points (2 marks)
Award 2 marks each for evaluation and improvements
Marking Notes:
- Accept alternative valid answers where appropriate
- Award marks for geographical terminology used correctly
- Look for evidence-based responses that reference figures/data provided
- Credit logical reasoning even if specific examples differ from mark scheme
Free quiz and exam paper access
Enter your details to view this paper
Your access is remembered on this device.