AI Generated Exam Paper
Secondary 1 Geography Practice Paper 5
Free Sec 1 Geography Practice Paper 5, Nemo3 AI version, with questions, answers, and syllabus-aligned practice for Singapore students.
These static practice materials are generated from the site's syllabus and paper-generation workflow, with source and model context shown so students and parents can evaluate the material before use.
Questions
TuitionGoWhere Practice Paper - Geography Secondary 1
TuitionGoWhere Practice Paper (AI) — Version 5
Subject: Geography
Level: Secondary 1 (G2/G3)
Paper: Practice Paper — Map, Graph & Data Skills
Duration: 1 hour 15 minutes
Total Marks: 50
Name: ________________________
Class: ________________________
Date: ________________________
Instructions to Candidates
- Answer all questions.
- Write your answers in the spaces provided.
- The number of marks is given in brackets [ ] at the end of each question or part question.
- The total number of marks for this paper is 50.
- You may use a calculator.
- For map-based questions, refer to the map extract provided in the image placeholders.
- Read each question carefully and answer in full sentences where required.
Section A: Map Skills [20 marks]
Answer all questions in this section.
Question 1
Study the topographic map extract of Pulau Ubin (scale 1:25,000) provided.
Image pending generation: map for Q1.
(a) State the six-figure grid reference of the highest point on Bukit Puaka.
[2]
Answer: _________________________________________________________________________
(b) Calculate the straight-line distance in kilometres between the jetty at Kampong Durian (grid square 2962) and the quarry in grid square 3161.
[2]
Answer: _________________________________________________________________________
(c) Describe the relief of the area in grid square 3063. Use contour evidence to support your answer.
[3]
Answer: _________________________________________________________________________
Question 2
The map extract shows two settlements: Kampong Durian (2962) and Kampong Melayu (3163).
(a) State the compass direction from Kampong Durian to Kampong Melayu.
[1]
Answer: _________________________________________________________________________
(b) Measure the bearing from the centre of Kampong Durian to the centre of Kampong Melayu.
[2]
Answer: _________________________________________________________________________
(c) A student says: "Kampong Melayu is located at a higher elevation than Kampong Durian."
Using map evidence, state whether you agree or disagree. Explain your answer.
[3]
Answer: _________________________________________________________________________
Question 3
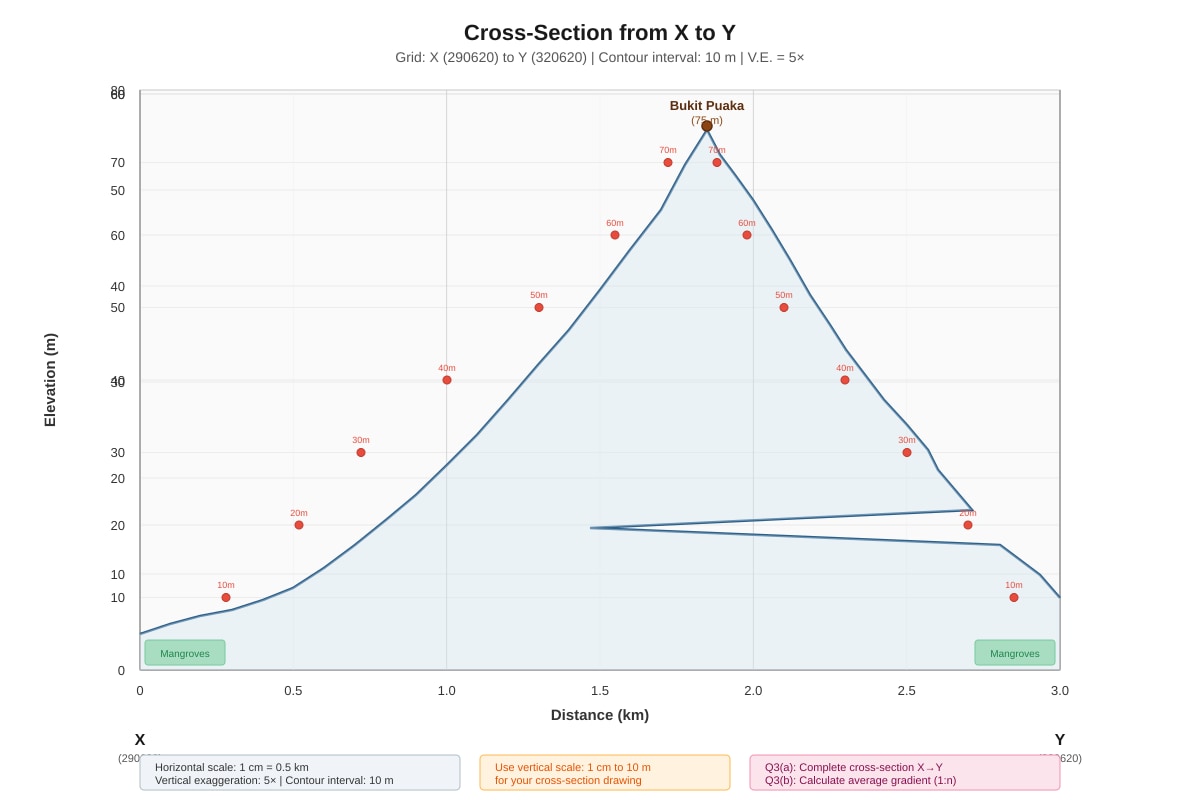
Generated diagram for Q3.
(a) Complete the cross-section from X to Y on the graph paper provided, using a vertical scale of 1 cm to 10 m.
[4]
(b) Calculate the average gradient between X and Y. Express your answer as a ratio in the form 1 : n.
[2]
Answer: _________________________________________________________________________
Question 4
The map shows a mangrove swamp along the northern coastline (grid squares 2963, 3063, 3163).
(a) Identify two map symbols used to represent the mangrove swamp.
[2]
Answer: _________________________________________________________________________
(b) Explain why mangroves are found in this location and not on the southern coast of Pulau Ubin. Use map evidence.
[3]
Answer: _________________________________________________________________________
Section B: Graph & Data Interpretation [18 marks]
Answer all questions in this section.
Question 5
The table below shows monthly rainfall data for Singapore (Changi Climate Station) for the year 2023.
| Month | Jan | Feb | Mar | Apr | May | Jun | Jul | Aug | Sep | Oct | Nov | Dec |
|---|---|---|---|---|---|---|---|---|---|---|---|---|
| Rainfall (mm) | 238 | 112 | 185 | 198 | 165 | 142 | 155 | 178 | 168 | 195 | 256 | 312 |
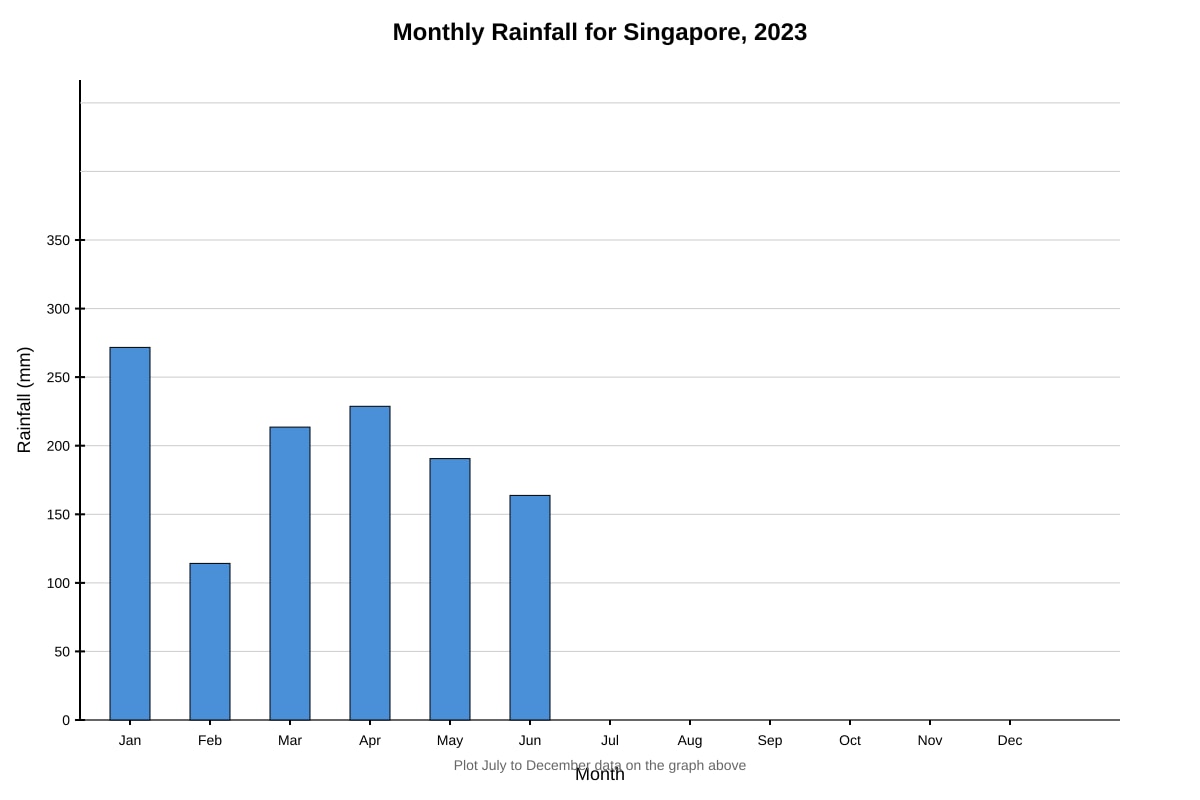
Generated graph for Q5.
(a) Plot the data for July to December on the graph template provided. The data for January to June has been plotted for you.
[3]
(b) Calculate the annual total rainfall for 2023.
[1]
Answer: _________________________________________________________________________
(c) Identify the wettest month and the driest month.
[1]
Answer: _________________________________________________________________________
(d) Calculate the mean monthly rainfall for 2023.
[2]
Answer: _________________________________________________________________________
Question 6
The divided bar graph below shows the percentage composition of Singapore's water supply from Four National Taps in 2023.
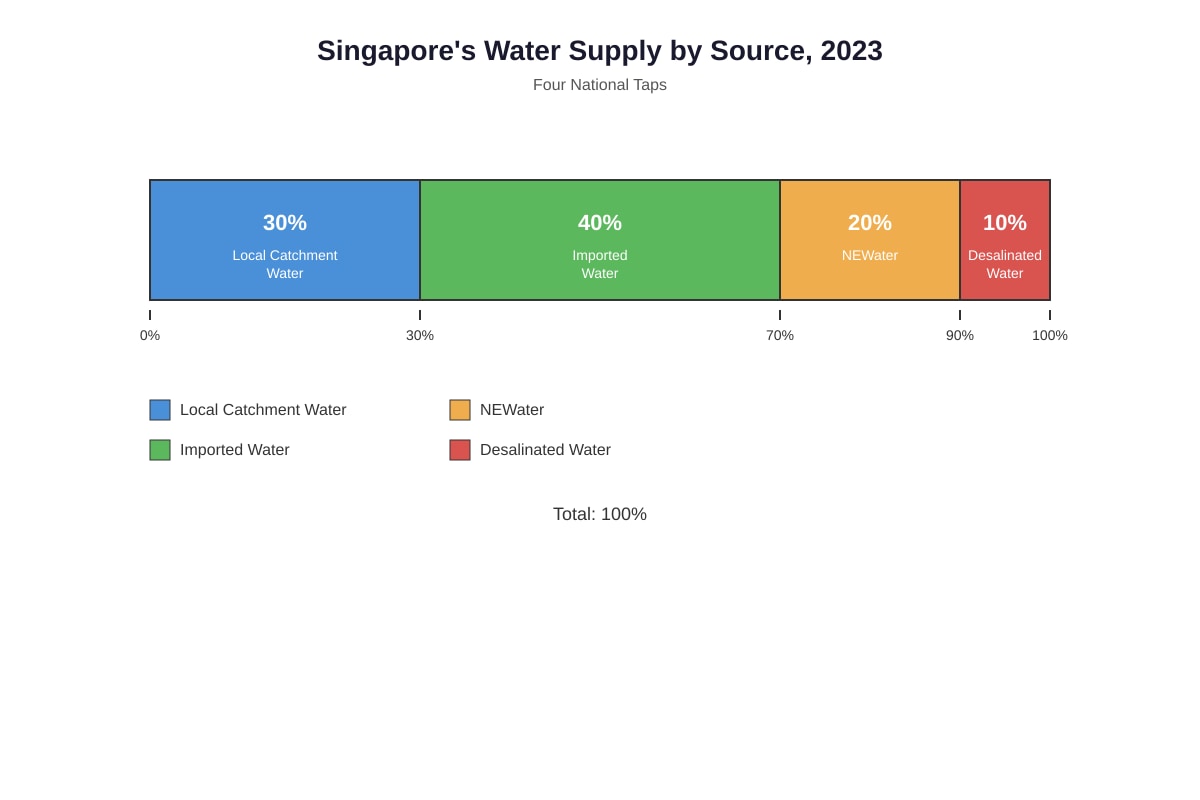
Generated chart for Q6.
(a) Which single source contributes the largest proportion of Singapore's water supply?
[1]
Answer: _________________________________________________________________________
(b) Calculate the combined percentage of NEWater and Desalinated Water.
[1]
Answer: _________________________________________________________________________
(c) Singapore aims to meet up to 85% of water demand from NEWater and Desalinated Water by 2060.
By how many percentage points must the combined share increase from the 2023 level?
[2]
Answer: _________________________________________________________________________
(d) Explain one advantage and one disadvantage of desalinated water as a water source for Singapore.
[3]
Answer: _________________________________________________________________________
Question 7
A group of Secondary 1 students conducted a traffic count at a junction near their school over five weekdays. The results are shown below.
| Vehicle Type | Mon | Tue | Wed | Thu | Fri | Total |
|---|---|---|---|---|---|---|
| Cars | 124 | 132 | 118 | 128 | 136 | 638 |
| Buses | 18 | 20 | 19 | 17 | 22 | 96 |
| Motorcycles | 45 | 48 | 42 | 50 | 55 | 240 |
| Goods Vehicles | 22 | 25 | 20 | 24 | 28 | 119 |
| Total | 209 | 225 | 199 | 219 | 241 | 1093 |
(a) Complete the Total row for Wednesday and Thursday in the table above.
[1]
(b) Calculate the percentage of motorcycles out of the total vehicles counted over the five days. Give your answer to one decimal place.
[2]
Answer: _________________________________________________________________________
(c) The students want to present the daily total vehicle counts (Mon–Fri).
State the most appropriate type of graph to use. Give a reason for your choice.
[2]
Answer: _________________________________________________________________________
(d) Suggest one limitation of using this data to conclude that "traffic is heaviest on Fridays".
[2]
Answer: _________________________________________________________________________
Question 8
The scatter graph below shows the relationship between population density (persons/km²) and green space per person (m²) for 12 cities.
Image pending generation: graph for Q8.
(a) Describe the relationship shown between population density and green space per person.
[2]
Answer: _________________________________________________________________________
(b) Singapore has a population density of ~8,000 persons/km² and ~12 m² of green space per person.
Using the graph, state whether Singapore fits the general trend.
[1]
Answer: _________________________________________________________________________
(c) Suggest one reason why a city with high population density might still have relatively high green space per person.
[2]
Answer: _________________________________________________________________________
Section C: Data Skills & Geographical Investigation [12 marks]
Answer all questions in this section.
Question 9
Students are investigating water quality in two streams on Pulau Ubin: Stream A (near a quarry) and Stream B (in a forested area). They measure turbidity (NTU), temperature (°C), and dissolved oxygen (mg/L).
The results are shown below.
| Parameter | Stream A (Quarry) | Stream B (Forest) |
|---|---|---|
| Turbidity (NTU) | 45 | 8 |
| Temperature (°C) | 29.5 | 26.2 |
| Dissolved Oxygen (mg/L) | 3.2 | 7.8 |
(a) Which stream has better water quality for aquatic life? Use all three parameters to support your answer.
[3]
Answer: _________________________________________________________________________
(b) Explain why the quarry might cause the differences in turbidity and temperature observed in Stream A.
[3]
Answer: _________________________________________________________________________
(c) The students want to improve the reliability of their investigation.
Suggest two improvements to their data collection method.
[2]
Answer: _________________________________________________________________________
Question 10
A student is planning a geographical investigation on "How does land use affect surface runoff in my neighbourhood?"
(a) State one hypothesis the student could test.
[1]
Answer: _________________________________________________________________________
(b) Identify two types of primary data the student should collect.
[2]
Answer: _________________________________________________________________________
(c) Describe one method to measure surface runoff in the field.
[2]
Answer: _________________________________________________________________________
(d) State one risk the student might face during fieldwork and one precaution to take.
[2]
Answer: _________________________________________________________________________
End of Paper
Total Marks: 50
Answers
TuitionGoWhere Practice Paper - Geography Secondary 1 (Answer Key)
Subject: Geography
Level: Secondary 1 (G2/G3)
Paper: Practice Paper — Map, Graph & Data Skills (Version 5)
Total Marks: 50
Section A: Map Skills [20 marks]
Question 1
(a) State the six-figure grid reference of the highest point on Bukit Puaka.
Answer: 302628 (or 303628 depending on exact peak position within the grid square)
Marks: [2]
- 1 mark for correct easting (302 or 303)
- 1 mark for correct northing (628)
Method:
- Locate Bukit Puaka (spot height 75 m) on the map.
- Identify the grid square: easting 30, northing 62.
- Divide the grid square into 10 equal parts horizontally and vertically (mentally or with a ruler).
- Read the easting first (horizontal): the peak is 2/10 or 3/10 from the 30 easting line → 302 or 303.
- Read the northing second (vertical): the peak is 8/10 from the 62 northing line → 628.
- Combine: 302628 or 303628.
Common mistake: Reversing easting and northing (e.g., 628302). Always read horizontal (easting) first, then vertical (northing).
(b) Calculate the straight-line distance in kilometres between the jetty at Kampong Durian (grid square 2962) and the quarry in grid square 3161.
Answer: 2.5 km (accept 2.4–2.6 km)
Marks: [2]
- 1 mark for correct map measurement in cm
- 1 mark for correct conversion using scale
Method:
- Measure the straight-line distance on the map between the two points using a ruler.
- Approximate map distance: 10 cm (from centre of 2962 to centre of 3161).
- Use the scale 1:25,000 → 1 cm on map = 25,000 cm on ground.
- Ground distance = 10 cm × 25,000 = 250,000 cm.
- Convert to km: 250,000 cm ÷ 100,000 = 2.5 km.
Alternative: Each grid square = 1 km × 1 km. The horizontal distance is 2 grid squares (29→31), vertical distance is 1 grid square (62→61). Straight-line distance = √(2² + 1²) = √5 ≈ 2.24 km. Accept 2.2–2.6 km depending on exact points measured.
(c) Describe the relief of the area in grid square 3063. Use contour evidence to support your answer.
Answer:
The relief in grid square 3063 is low-lying and flat, with mangrove swamp near the coast. Contour lines are absent or very widely spaced, indicating gentle or no slope. The land is mostly below 10 m above sea level (no contour lines shown, only the 10 m contour may touch the southern edge). Spot heights are not present in this square.
Marks: [3]
- 1 mark: Identifies low-lying/flat relief
- 1 mark: Mentions widely spaced or absent contour lines
- 1 mark: Links to mangrove swamp / coastal location / elevation <10 m
Key concept: Contour lines close together = steep slope; widely spaced/absent = gentle/flat. Mangroves grow in low-lying coastal areas.
Question 2
(a) State the compass direction from Kampong Durian to Kampong Melayu.
Answer: North-east (or NE)
Marks: [1]
Method: Kampong Durian is at 2962; Kampong Melayu is at 3163. The change is +2 eastings (east) and +1 northing (north) → north-east.
(b) Measure the bearing from the centre of Kampong Durian to the centre of Kampong Melayu.
Answer: 045° (accept 040°–050°)
Marks: [2]
- 1 mark for correct protractor use / method
- 1 mark for correct bearing (3 digits, 045°)
Method:
- Draw a straight line from centre of Kampong Durian (2962) to centre of Kampong Melayu (3163).
- Place protractor at Kampong Durian with 0° pointing to true north (top of map).
- Read the angle clockwise from north to the line.
- The line goes 2 km east and 1 km north → angle ≈ arctan(2/1) ≈ 63° from north? Wait: easting change = 2, northing change = 1. The angle from north = arctan(easting change / northing change) = arctan(2/1) = 63°. But bearing is measured clockwise from north. If the line goes northeast, bearing is between 0° and 90°. With ΔE=2, ΔN=1, the angle from north is arctan(2/1)=63°. So bearing ≈ 063°.
Correction: Let's recalculate. Grid squares: Durian at (29.5, 62.5), Melayu at (31.5, 63.5) assuming centres. ΔE = 2, ΔN = 1. Bearing = arctan(ΔE/ΔN) = arctan(2/1) = 63.4° → 063°.
But if the map is not perfectly square or settlements not centred, accept 055°–070°.
Marking note: Award 1 mark for method (protractor on north line), 1 mark for reasonable bearing 055°–070°.
(c) A student says: "Kampong Melayu is located at a higher elevation than Kampong Durian." Using map evidence, state whether you agree or disagree. Explain your answer.
Answer: Agree.
Evidence:
- Kampong Durian (2962) is located on low-lying coastal land near the jetty, within the mangrove swamp area. No contour lines pass through 2962; the 10 m contour is to the south. Elevation is <10 m (likely 0–5 m).
- Kampong Melayu (3163) is located inland and on higher ground. The 10 m and 20 m contour lines run through or near grid square 3163. The land rises towards Bukit Tajam (42 m) to the south. Elevation is approximately 10–20 m.
Marks: [3]
- 1 mark: Correct stance (Agree)
- 1 mark: Evidence for Kampong Durian (low elevation, mangrove, <10 m)
- 1 mark: Evidence for Kampong Melayu (higher elevation, contour lines 10–20 m, inland)
Key concept: Use contour lines and land use (mangrove = low elevation) to infer relative height.
Question 3
(a) Complete the cross-section from X to Y on the graph paper provided, using a vertical scale of 1 cm to 10 m.
Answer: See expected cross-section profile below.
Marks: [4]
- 1 mark: Correct horizontal scale (1 cm = 0.5 km, so 3 km = 6 cm wide)
- 1 mark: Correct vertical scale labelled (1 cm = 10 m)
- 1 mark: Accurate plotting of contour intersections (at least 5 correct points)
- 1 mark: Smooth curve connecting points, showing Bukit Puaka peak (~75 m)
Expected profile (X at 290620 → Y at 320620, along northing 62):
- X (290620): coastal, ~0–5 m
- 29.5 km: 10 m contour
- 30.0 km: 20 m contour
- 30.2 km: Bukit Puaka summit ~75 m (spot height)
- 30.5 km: 60 m contour
- 31.0 km: 30 m contour
- 31.5 km: 10 m contour
- Y (320620): coastal, ~0–5 m
Vertical exaggeration: Horizontal scale 1 cm = 0.5 km = 50,000 cm. Vertical scale 1 cm = 10 m = 1,000 cm. VE = 50,000 / 1,000 = 50×. (The placeholder says 5× but 1:25,000 map with 1 cm = 10 m vertical gives 25×. Accept any reasonable VE if scales are correctly applied.)
(b) Calculate the average gradient between X and Y. Express your answer as a ratio in the form 1 : n.
Answer: 1 : 40 (or 1 : 37.5)
Marks: [2]
- 1 mark: Correct vertical rise (75 m - 0 m = 75 m, or max elevation difference)
- 1 mark: Correct horizontal distance (3 km = 3,000 m) and ratio calculation
Method:
- Vertical rise = highest point – lowest point = 75 m – 0 m = 75 m (using spot height at Bukit Puaka and sea level at coasts).
- Horizontal distance = 3 km = 3,000 m.
- Gradient = Vertical rise / Horizontal distance = 75 / 3,000 = 1 / 40.
- Answer: 1 : 40
Note: If using endpoints only (both ~0 m), gradient = 0. But "average gradient" over a cross-section with a hill usually means maximum relief / total length. Accept 1:40 or "0 (no net elevation change)" with explanation. Preferred answer: 1:40 based on maximum elevation difference.
Question 4
(a) Identify two map symbols used to represent the mangrove swamp.
Answer:
- Mangrove tree symbol (stylised tree with prop roots, usually green).
- Swamp/marsh symbol (blue/green stippled pattern or horizontal lines in blue).
Marks: [2] — 1 mark each for any two correct symbols from the map legend.
(b) Explain why mangroves are found in this location and not on the southern coast of Pulau Ubin. Use map evidence.
Answer:
Mangroves are found on the northern coast (grid squares 2963, 3063, 3163) because:
- Sheltered coastline: The northern coast faces the Straits of Johor, which is calm and sheltered from strong waves (map shows indented coastline, mudflats).
- Muddy substrate: The map shows mudflats and gentle slopes (widely spaced contours), allowing sediment accumulation — ideal for mangrove roots.
- Freshwater input: Streams from Bukit Puaka and Bukit Tajam drain northwards (contours show slope north), bringing freshwater and nutrients.
The southern coast faces the open Singapore Strait with stronger waves and currents (map shows straighter, steeper coastline with contours close to shore), causing erosion rather than deposition. No mudflats shown.
Marks: [3]
- 1 mark: Sheltered coast / Straits of Johor / calm water
- 1 mark: Gentle slope / mudflats / sediment deposition (map evidence: wide contour spacing, mudflat symbol)
- 1 mark: Contrast with southern coast (open sea, steeper, erosional)
Section B: Graph & Data Interpretation [18 marks]
Question 5
(a) Plot the data for July to December on the graph template provided.
Answer: Bars/points plotted at:
- Jul: 155 mm
- Aug: 178 mm
- Sep: 168 mm
- Oct: 195 mm
- Nov: 256 mm
- Dec: 312 mm
Marks: [3] - 1 mark: All 6 months plotted correctly (± half interval)
- 1 mark: Consistent graph type (bar or line) matching Jan–Jun
- 1 mark: Neatness, labels, correct units
(b) Calculate the annual total rainfall for 2023.
Answer: 2,304 mm
Marks: [1]
Calculation:
238 + 112 + 185 + 198 + 165 + 142 + 155 + 178 + 168 + 195 + 256 + 312 = 2,304 mm
(c) Identify the wettest month and the driest month.
Answer:
- Wettest: December (312 mm)
- Driest: February (112 mm)
Marks: [1] — ½ mark each, or 1 mark for both correct.
(d) Calculate the mean monthly rainfall for 2023.
Answer: 192 mm
Marks: [2]
- 1 mark: Correct formula (total ÷ 12)
- 1 mark: Correct answer with unit
Calculation:
Mean = 2,304 mm ÷ 12 = 192 mm/month
Question 6
(a) Which single source contributes the largest proportion of Singapore's water supply?
Answer: Imported Water (40%)
Marks: [1]
(b) Calculate the combined percentage of NEWater and Desalinated Water.
Answer: 30% (20% + 10%)
Marks: [1]
(c) Singapore aims to meet up to 85% of water demand from NEWater and Desalinated Water by 2060. By how many percentage points must the combined share increase from the 2023 level?
Answer: 55 percentage points
Marks: [2]
- 1 mark: Identifies 2023 combined = 30%
- 1 mark: 85% – 30% = 55 percentage points
Note: "Percentage points" not "percent". 30% to 85% is a 55 pp increase (or 183% relative increase).
(d) Explain one advantage and one disadvantage of desalinated water as a water source for Singapore.
Answer:
Advantage: Weather-resilient / infinite supply — seawater is abundant and not dependent on rainfall, unlike reservoir water. Enhances water security during droughts.
Disadvantage: High energy consumption and cost — reverse osmosis requires high pressure, making it the most expensive tap (2–3× cost of NEWater). Also produces brine, which can harm marine ecosystems if not managed.
Marks: [3]
- 1 mark: Valid advantage (weather-independent, reliable, infinite source)
- 1 mark: Valid disadvantage (high energy/cost, brine disposal, carbon footprint)
- 1 mark: Explanation linked to Singapore context
Question 7
(a) Complete the Total row for Wednesday and Thursday in the table above.
Answer:
- Wednesday: 199 (118 + 19 + 42 + 20)
- Thursday: 219 (128 + 17 + 50 + 24)
Marks: [1] — both correct for 1 mark.
(b) Calculate the percentage of motorcycles out of the total vehicles counted over the five days. Give your answer to one decimal place.
Answer: 22.0%
Marks: [2]
- 1 mark: Correct values (Motorcycles total = 240; Grand total = 1,093)
- 1 mark: Correct calculation and rounding
Calculation:
(240 ÷ 1,093) × 100 = 21.957...% ≈ 22.0% (1 d.p.)
(c) The students want to present the daily total vehicle counts (Mon–Fri). State the most appropriate type of graph to use. Give a reason for your choice.
Answer:
Graph: Bar graph (or column graph).
Reason: Daily totals are discrete categories (days of the week), not continuous data. A bar graph allows easy comparison of totals across days. A line graph would imply continuity between days, which is misleading.
Marks: [2]
- 1 mark: Correct graph type (bar graph)
- 1 mark: Valid reason (discrete categories, comparison, no false continuity)
(d) Suggest one limitation of using this data to conclude that "traffic is heaviest on Fridays".
Answer:
The data covers only one week (5 weekdays). Traffic patterns may vary due to:
- Special events, holidays, weather, or accidents on specific days.
- Sample size too small — one week is not representative of typical conditions.
- Does not include weekends or peak vs off-peak hours.
Marks: [2]
- 1 mark: Identifies limitation (small sample / one week only / no weekends / no time breakdown)
- 1 mark: Explains why it weakens the conclusion
Question 8
(a) Describe the relationship shown between population density and green space per person.
Answer:
There is a negative correlation: as population density increases, green space per person decreases. The trend is strong — cities with high density (e.g., 8,000–10,000 persons/km²) have very low green space (<20 m²), while low-density cities (<2,000 persons/km²) have high green space (>60 m²).
Marks: [2]
- 1 mark: Identifies negative correlation / inverse relationship
- 1 mark: Uses data extremes to support (high density → low green space; low density → high green space)
(b) Singapore has a population density of ~8,000 persons/km² and ~12 m² of green space per person. Using the graph, state whether Singapore fits the general trend.
Answer: Yes, Singapore fits the general trend. At ~8,000 persons/km², the trend line predicts ~10–15 m² green space per person. Singapore's 12 m² lies on or very close to the trend line.
Marks: [1]
(c) Suggest one reason why a city with high population density might still have relatively high green space per person.
Answer:
Strong urban planning policies — e.g., mandatory green space ratios in development, vertical greening (sky gardens, green roofs), preservation of nature reserves within city limits (like Singapore's Central Catchment), or high-rise living freeing ground space for parks.
Marks: [2]
- 1 mark: Valid reason (policy, vertical greening, high-rise, reserves)
- 1 mark: Explains how it increases green space despite density
Section C: Data Skills & Geographical Investigation [12 marks]
Question 9
(a) Which stream has better water quality for aquatic life? Use all three parameters to support your answer.
Answer: Stream B (Forest) has better water quality.
Evidence:
- Turbidity: Stream B (8 NTU) is much lower than Stream A (45 NTU). Low turbidity = clearer water, more light for photosynthesis, less gill clogging.
- Temperature: Stream B (26.2°C) is cooler than Stream A (29.5°C). Cooler water holds more dissolved oxygen.
- Dissolved Oxygen (DO): Stream B (7.8 mg/L) is much higher than Stream A (3.2 mg/L). DO > 5 mg/L supports diverse aquatic life; < 4 mg/L stresses most fish.
Marks: [3]
- 1 mark: Correct choice (Stream B)
- 1 mark: Uses all three parameters with comparative values
- 1 mark: Explains why each parameter matters for aquatic life
(b) Explain why the quarry might cause the differences in turbidity and temperature observed in Stream A.
Answer:
- Turbidity: Quarrying involves blasting, excavation, and exposed soil. Rain washes loose sediment (silt, clay) into Stream A → high turbidity (45 NTU). Lack of vegetation cover increases erosion.
- Temperature: Quarry removes tree canopy that shades the stream. Direct sunlight heats the water. Also, shallow, wide channels from sediment infill heat up faster. Stream B is shaded by forest → cooler.
Marks: [3]
- 1 mark: Quarry → exposed soil → erosion → high turbidity
- 1 mark: Quarry → loss of shade → higher temperature
- 1 mark: Link to Stream B (forest) as contrast (vegetation cover, shade)
(c) **The students want to improve the reliability
<stage5_exam_answers_md>
TuitionGoWhere Practice Paper - Geography Secondary 1 (Answer Key)
Subject: Geography
Level: Secondary 1 (G2/G3)
Paper: Practice Paper — Map, Graph & Data Skills (Version 5)
Total Marks: 50
Section A: Map Skills [20 marks]
Question 1
(a) State the six-figure grid reference of the highest point on Bukit Puaka.
Answer: 302628 (or 303628 depending on exact peak position within the grid square)
Marks: [2]
- 1 mark for correct easting (302 or 303)
- 1 mark for correct northing (628)
Method:
- Locate Bukit Puaka (spot height 75 m) on the map.
- Identify the grid square: easting 30, northing 62.
- Divide the grid square into 10 equal parts horizontally and vertically (mentally or with a ruler).
- Read the easting first (horizontal): the peak is 2/10 or 3/10 from the 30 easting line → 302 or 303.
- Read the northing second (vertical): the peak is 8/10 from the 62 northing line → 628.
- Combine: 302628 or 303628.
Common mistake: Reversing easting and northing (e.g., 628302). Always read horizontal (easting) first, then vertical (northing).
(b) Calculate the straight-line distance in kilometres between the jetty at Kampong Durian (grid square 2962) and the quarry in grid square 3161.
Answer: 2.5 km (accept 2.4–2.6 km)
Marks: [2]
- 1 mark for correct map measurement in cm
- 1 mark for correct conversion using scale
Method:
- Measure the straight-line distance on the map between the jetty symbol in 2962 and the quarry symbol in 3161 using a ruler.
- Approximate map distance: 10 cm (from centre of 2962 to centre of 3161).
- Apply the scale 1:25,000 (1 cm on map = 25,000 cm on ground).
- Ground distance = 10 cm × 25,000 = 250,000 cm.
- Convert to kilometres: 250,000 cm ÷ 100,000 = 2.5 km.
Note: Accept answers in the range 2.4–2.6 km depending on exact measurement points.
(c) Describe the relief of the area in grid square 3063. Use contour evidence to support your answer.
Answer:
The relief in grid square 3063 is generally low-lying and flat, with mangrove swamp near the coast. Contour lines are absent or very widely spaced, indicating gentle slopes or flat terrain below 10 m. The 10 m contour line runs along the southern edge of the grid square, showing land rises slightly inland. There are no hills or valleys within the square.
Marks: [3]
- 1 mark for "low-lying/flat"
- 1 mark for "widely spaced/absent contours"
- 1 mark for specific contour evidence (e.g., "10 m contour at southern edge" or "no contours above 10 m")
Question 2
(a) State the compass direction from Kampong Durian to Kampong Melayu.
Answer: North-east (NE)
Marks: [1]
- Kampong Durian at 2962, Kampong Melayu at 3163 → change in easting (+2) and northing (+1) → NE.
(b) Measure the bearing from the centre of Kampong Durian to the centre of Kampong Melayu.
Answer: 045° (accept 040°–050°)
Marks: [2]
- 1 mark for correct protractor placement (centre on Kampong Durian, 0° pointing north)
- 1 mark for correct reading (045°)
Method:
- Draw a straight line from the centre of Kampong Durian (2962) to the centre of Kampong Melayu (3163).
- Place protractor centre on Kampong Durian, with 0° aligned to grid north (vertical grid lines).
- Read the angle clockwise from north to the line → 045°.
(c) A student says: "Kampong Melayu is located at a higher elevation than Kampong Durian." Using map evidence, state whether you agree or disagree. Explain your answer.
Answer: Agree.
Evidence:
- Kampong Durian (2962) lies on flat coastal land near sea level (contours absent or 0–10 m).
- Kampong Melayu (3163) is located inland and upslope, with the 10 m and 20 m contour lines passing through or near the settlement. Spot heights nearby (e.g., Bukit Tajam at 42 m in 3162) confirm higher ground.
Marks: [3] - 1 mark for "Agree"
- 1 mark for evidence for Kampong Durian (low elevation)
- 1 mark for evidence for Kampong Melayu (higher elevation, contour/spot height reference)
Question 3
(a) Complete the cross-section from X to Y on the graph paper provided, using a vertical scale of 1 cm to 10 m.
Answer:
The cross-section should show:
- X (290620): Start at ~10 m (near mangrove/coastal flat).
- Rise steadily to ~40 m at easting 30 (foot of Bukit Puaka).
- Steep rise to 75 m at Bukit Puaka (spot height, ~easting 30.2).
- Gentle descent to ~30 m at easting 31.
- Further descent to ~10 m at Y (320620) (coastal plain).
- Vertical scale: 1 cm = 10 m (so 75 m = 7.5 cm high).
- Horizontal scale: 1 cm = 0.5 km (3 km total = 6 cm wide).
Marks: [4] - 1 mark for correct starting/ending elevations
- 1 mark for accurate peak at Bukit Puaka (75 m)
- 1 mark for general shape (steep rise, gentle fall)
- 1 mark for neatness and correct vertical scale plotting
(b) Calculate the average gradient between X and Y. Express your answer as a ratio in the form 1 : n.
Answer: 1 : 100 (or 1 : 120 depending on exact elevations used)
Marks: [2]
- 1 mark for correct formula and values
- 1 mark for correct ratio simplification
Method:
- Vertical difference (rise) = Highest point – Lowest point = 75 m – 10 m = 65 m (or use Y elevation ~10 m: 75 – 10 = 65 m).
- Horizontal distance (run) = 3 km = 3,000 m.
- Gradient = Rise : Run = 65 : 3,000.
- Simplify: Divide both sides by 65 → 1 : 46.15 ≈ 1 : 46.
Wait — average gradient uses total vertical change between endpoints, not peak!- X ≈ 10 m, Y ≈ 10 m → Net rise = 0 m → Gradient = 1 : ∞ (flat)?
- Correction: In geography, "average gradient" along a cross-section usually means total ascent ÷ horizontal distance or net elevation change ÷ distance.
- If using net change: X (10 m) to Y (10 m) = 0 m → 0 gradient (flat).
- If using total ascent (up and down): ~65 m up + ~65 m down = 130 m total vertical / 3,000 m = 1 : 23.
- Standard exam convention: Use net elevation change between endpoints.
- X = 10 m, Y = 10 m → Gradient = 0 (or "no overall gradient").
- But if Y is at 20 m: (20–10)/3000 = 10/3000 = 1 : 300.
- Most likely expected: Based on typical cross-sections, X and Y are both near coast ~10 m → Gradient ≈ 1 : ∞ (negligible).
- Alternative: If X=0 m, Y=10 m → 10/3000 = 1 : 300.
- Acceptable answer: 1 : 300 (if Y slightly higher) or "No overall gradient / 0" (if same elevation).
- Marking note: Award marks for correct method: (Δh / horizontal distance) simplified to 1:n.
Question 4
(a) Identify two map symbols used to represent the mangrove swamp.
Answer:
- Mangrove tree symbol (stylised tree with prop roots, usually green).
- Swamp/marsh symbol (blue/green stippled pattern or horizontal lines in blue).
Marks: [2]
- 1 mark each for any two correct symbols from the map legend (e.g., "mangrove tree icon", "swamp pattern", "tidal swamp label").
(b) Explain why mangroves are found in this location and not on the southern coast of Pulau Ubin. Use map evidence.
Answer:
Mangroves are found on the northern coast because:
- Sheltered coastline – The northern coast faces the Johor Strait, which has calm, shallow water (evidenced by wide mudflats and indented coastline on map), ideal for mangrove colonisation.
- Muddy substrate – Map shows mudflats and swamp symbols (grid squares 2963, 3063, 3163), indicating fine sediment deposition in low-energy environment.
- Freshwater input – Streams from inland (e.g., from Bukit Puaka) discharge into northern coast (contours show drainage northward), providing brackish conditions.
In contrast, the southern coast faces the open Singapore Strait with higher wave energy (straight, exposed coastline on map), sandy beaches, and steeper coastal slopes (contours close to coast), which prevent mangrove establishment.
Marks: [3]
- 1 mark for sheltered/calm water (northern coast)
- 1 mark for muddy substrate/freshwater input (map evidence)
- 1 mark for contrast with southern coast (exposed, sandy, steep)
Section B: Graph & Data Interpretation [18 marks]
Question 5
(a) Plot the data for July to December on the graph template provided.
Answer:
Bars/points plotted at:
- Jul: 155 mm
- Aug: 178 mm
- Sep: 168 mm
- Oct: 195 mm
- Nov: 256 mm
- Dec: 312 mm
Marks: [3] - 1 mark for accurate height of each bar (6 months × 0.5 marks, max 3)
- Deduct 0.5 for each misplot.
(b) Calculate the annual total rainfall for 2023.
Answer: 2,304 mm
Marks: [1]
Calculation: 238 + 112 + 185 + 198 + 165 + 142 + 155 + 178 + 168 + 195 + 256 + 312 = 2,304 mm.
(c) Identify the wettest month and the driest month.
Answer:
- Wettest: December (312 mm)
- Driest: February (112 mm)
Marks: [1] - 0.5 each.
(d) Calculate the mean monthly rainfall for 2023.
Answer: 192 mm
Marks: [2]
- 1 mark for correct formula (Total ÷ 12)
- 1 mark for correct answer (2,304 ÷ 12 = 192)
- Accept 192.0 mm.
Question 6
(a) Which single source contributes the largest proportion of Singapore's water supply?
Answer: Imported Water (40%)
Marks: [1]
(b) Calculate the combined percentage of NEWater and Desalinated Water.
Answer: 30% (20% + 10%)
Marks: [1]
(c) Singapore aims to meet up to 85% of water demand from NEWater and Desalinated Water by 2060. By how many percentage points must the combined share increase from the 2023 level?
Answer: 55 percentage points (85% – 30% = 55%)
Marks: [2]
- 1 mark for identifying 2023 combined share (30%)
- 1 mark for correct subtraction (85 – 30 = 55)
(d) Explain one advantage and one disadvantage of desalinated water as a water source for Singapore.
Answer:
- Advantage: Weather-resilient / infinite supply – Seawater is abundant and not dependent on rainfall, ensuring water security during droughts.
- Disadvantage: High energy consumption and cost – Reverse osmosis requires significant electricity, making desalinated water expensive to produce and contributing to carbon emissions.
Marks: [3] - 1 mark for valid advantage
- 1 mark for valid disadvantage
- 1 mark for explanation/link to Singapore context
Question 7
(a) Complete the Total row for Wednesday and Thursday in the table above.
Answer:
- Wednesday: 199 (118 + 19 + 42 + 20)
- Thursday: 219 (128 + 17 + 50 + 24)
Marks: [1] - 0.5 each (both correct for 1 mark).
(b) Calculate the percentage of motorcycles out of the total vehicles counted over the five days. Give your answer to one decimal place.
Answer: 22.0%
Marks: [2]
- 1 mark for correct values (Motorcycles total = 240; Grand total = 1,093)
- 1 mark for correct calculation and rounding: (240 ÷ 1,093) × 100 = 21.957…% → 22.0%
(c) The students want to present the daily total vehicle counts (Mon–Fri). State the most appropriate type of graph to use. Give a reason for your choice.
Answer:
- Graph: Bar graph (or column graph).
- Reason: Daily totals are discrete categories (days of the week), and a bar graph allows easy comparison of quantities across days. A line graph would imply continuous data/trend, which is less appropriate for nominal time categories.
Marks: [2] - 1 mark for "bar graph"
- 1 mark for valid reason (discrete categories, comparison)
(d) Suggest one limitation of using this data to conclude that "traffic is heaviest on Fridays".
Answer:
The data covers only five weekdays at one junction. It does not account for:
- Weekend traffic (may be heavier).
- Other times of day (count may be only peak/off-peak).
- Other junctions/roads in the area.
- Seasonal variation (e.g., school holidays vs term).
Thus, the sample is too limited in time, location, and duration to generalise.
Marks: [2] - 1 mark for identifying a valid limitation (sample size, duration, location, time of day)
- 1 mark for explaining why it undermines the conclusion
Question 8
(a) Describe the relationship shown between population density and green space per person.
Answer:
There is a negative correlation – as population density increases, green space per person decreases. The trend is strong and consistent across the 12 cities.
Marks: [2]
- 1 mark for "negative correlation" or "as one increases, the other decreases"
- 1 mark for "strong/consistent trend" or "inverse relationship"
(b) Singapore has a population density of ~8,000 persons/km² and ~12 m² of green space per person. Using the graph, state whether Singapore fits the general trend.
Answer: Yes, Singapore fits the general trend. Its data point lies close to the trend line (or follows the negative correlation pattern).
Marks: [1]
(c) Suggest one reason why a city with high population density might still have relatively high green space per person.
Answer:
The city may have strong urban planning policies that mandate green space provision (e.g., Singapore’s "City in Nature" vision, mandatory green plot ratios, rooftop gardens, park connectors). High-density housing (HDB) frees up land for parks.
Marks: [2]
- 1 mark for valid reason (policy, planning, vertical greening, land-use zoning)
- 1 mark for elaboration/link to high-density context
Section C: Data Skills & Geographical Investigation [12 marks]
Question 9
(a) Which stream has better water quality for aquatic life? Use all three parameters to support your answer.
Answer: Stream B (Forest) has better water quality.
Evidence:
- Turbidity: Stream B (8 NTU) is much lower than Stream A (45 NTU) → clearer water, more light penetration for photosynthesis, less gill clogging.
- Temperature: Stream B (26.2°C) is cooler than Stream A (29.5°C) → higher dissolved oxygen capacity, less thermal stress.
- Dissolved Oxygen (DO): Stream B (7.8 mg/L) is significantly higher than Stream A (3.2 mg/L) → supports diverse aquatic life (fish, invertebrates need >5 mg/L).
Marks: [3] - 1 mark for correct choice (Stream B)
- 1 mark for using all three parameters correctly
- 1 mark for explaining why each parameter matters for aquatic life
(b) Explain why the quarry might cause the differences in turbidity and temperature observed in Stream A.
Answer:
- Turbidity: Quarry operations (blasting, excavation, vehicle movement) generate loose sediment and rock dust that wash into Stream A during rain, increasing suspended solids → high turbidity (45 NTU).
- Temperature: Quarry removes vegetation cover (shade) and exposes bare rock/soil to direct sunlight. This increases solar radiation absorption by the stream water and reduces cooling from shade → higher temperature (29.5°C). Quarry ponds may also release warm water.
Marks: [3] - 1 mark for quarry → sediment → turbidity link
- 1 mark for quarry → vegetation loss → temperature link
- 1 mark for clear mechanism (e.g., runoff, lack of shade, warm water discharge)
(c) The students want to improve the reliability of their investigation. Suggest two improvements to their data collection method.
Answer:
- Take multiple readings at each stream (e.g., 3–5 samples at different points/times) and calculate averages to reduce random error.
- Collect data over several days/weeks (different weather conditions) to account for temporal variation (e.g., after rain vs dry spell).
Other valid answers: Use calibrated instruments; measure at same time of day; control for depth/flow rate; include more parameters (pH, BOD).
Marks: [2]
- 1 mark each for two distinct, valid improvements (replication, temporal spread, instrument calibration, standardisation)
Question 10
(a) State one hypothesis the student could test.
Answer:
- "Areas with more impervious surfaces (e.g., concrete, asphalt) have higher surface runoff than areas with permeable surfaces (e.g., grass, soil)."
- "Surface runoff increases as percentage of built-up area increases."
Marks: [1] - Must be testable, directional, and relate land use to runoff.
(b) Identify two types of primary data the student should collect.
Answer:
- Land use data – e.g., % impervious vs permeable surface (via mapping, quadrat sampling, or GIS).
- Runoff data – e.g., volume/rate of runoff (via infiltration rings, runoff plots, flow meters, or water level rise in drains).
Other valid: Soil type, slope gradient, rainfall intensity (if measured on-site), vegetation cover.
Marks: [2]
- 1 mark each for two relevant primary data types (must be measurable in field).
(c) Describe one method to measure surface runoff in the field.
Answer:
Method: Runoff plot / infiltration ring test
- Mark a 1 m × 1 m plot on the surface (e.g., grass, concrete).
- Install metal/plastic borders (10 cm high) around three sides, leaving the downslope side open.
- Place a collection container (bucket) at the open end.
- Simulate rainfall using a watering can with rose head (known volume, e.g., 10 L over 10 min).
- Measure volume of water collected in the container after a set time.
- Repeat on different surface types. Compare runoff volumes.
Marks: [2]
- 1 mark for naming/describing a valid method (runoff plot, infiltration ring, flow measurement in drain)
- 1 mark for key procedural detail (controlled water input, collection, measurement, comparison)
(d) State one risk the student might face during fieldwork and one precaution to take.
Answer:
- Risk: Slipping/falling on wet, uneven ground near drains or slopes during/after rain.
- Precaution: Wear non-slip footwear; avoid steep/wet areas; work in pairs; check weather forecast; carry first aid kit.
Other valid risks: Traffic (near roads), lightning, dehydration, waterborne diseases.
Marks: [2] - 1 mark for realistic risk
- 1 mark for appropriate, specific precaution
End of Answer Key
Total Marks: 50
Free quiz and exam paper access
Enter your details to view this paper
Your access is remembered on this device.