AI Generated Exam Paper
Secondary 1 Geography Practice Paper 4
Free Sec 1 Geography Practice Paper 4, HY3 AI version, with questions, answers, and syllabus-aligned practice for Singapore students.
These static practice materials are generated from the site's syllabus and paper-generation workflow, with source and model context shown so students and parents can evaluate the material before use.
Questions
TuitionGoWhere Practice Paper - Geography Secondary 1
TuitionGoWhere Practice Paper (AI) — Version 4
Subject: Geography
Level: Secondary 1
Paper: Practice Paper (Map Graph Data Skills)
Duration: 45 minutes
Total Marks: 40
Name: ________________________
Class: ________
Date: ____________
Instructions:
- This practice paper has 20 questions in three sections.
- Answer all questions in the spaces provided.
- Use the maps, tables, and figures given. Read axes and labels carefully.
- Section marks and question marks add up to 40.
Section A: Map Reading (Questions 1–8) [8 marks]
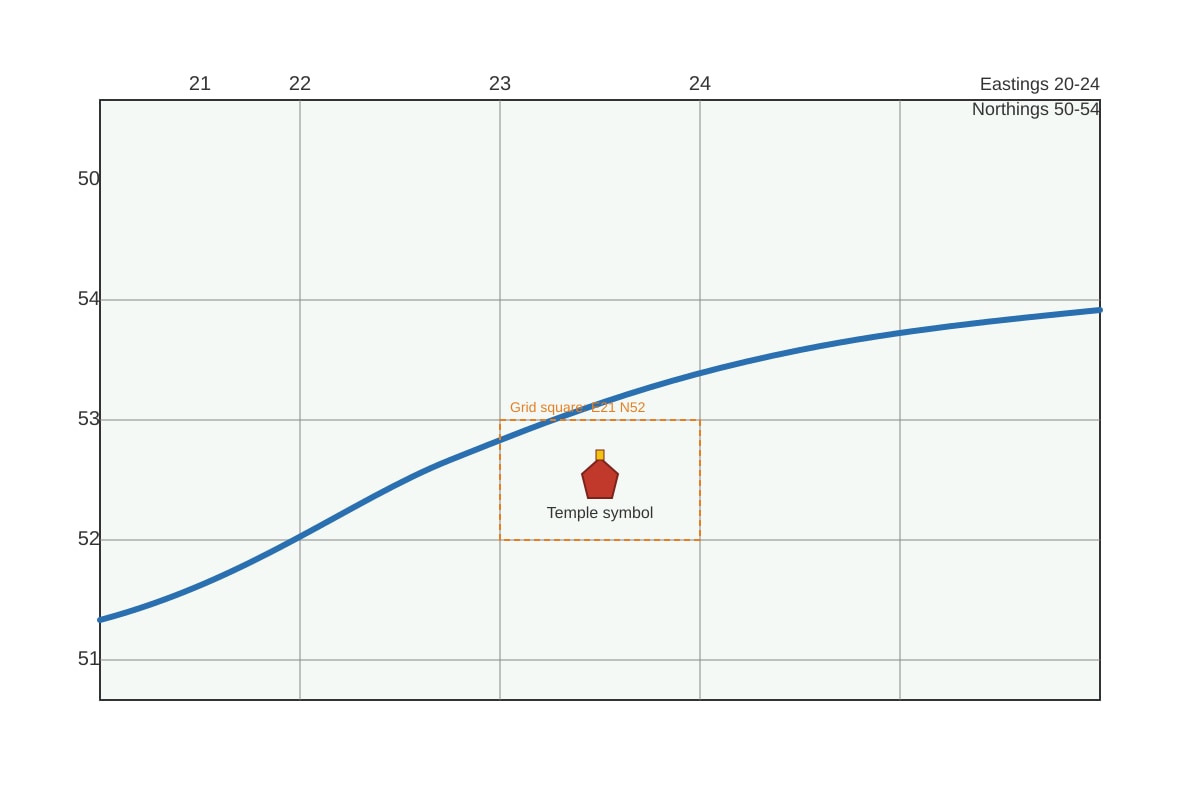
1. State the 4-figure grid reference of the temple shown on the map below. [1]
Image pending generation: map for Q1.
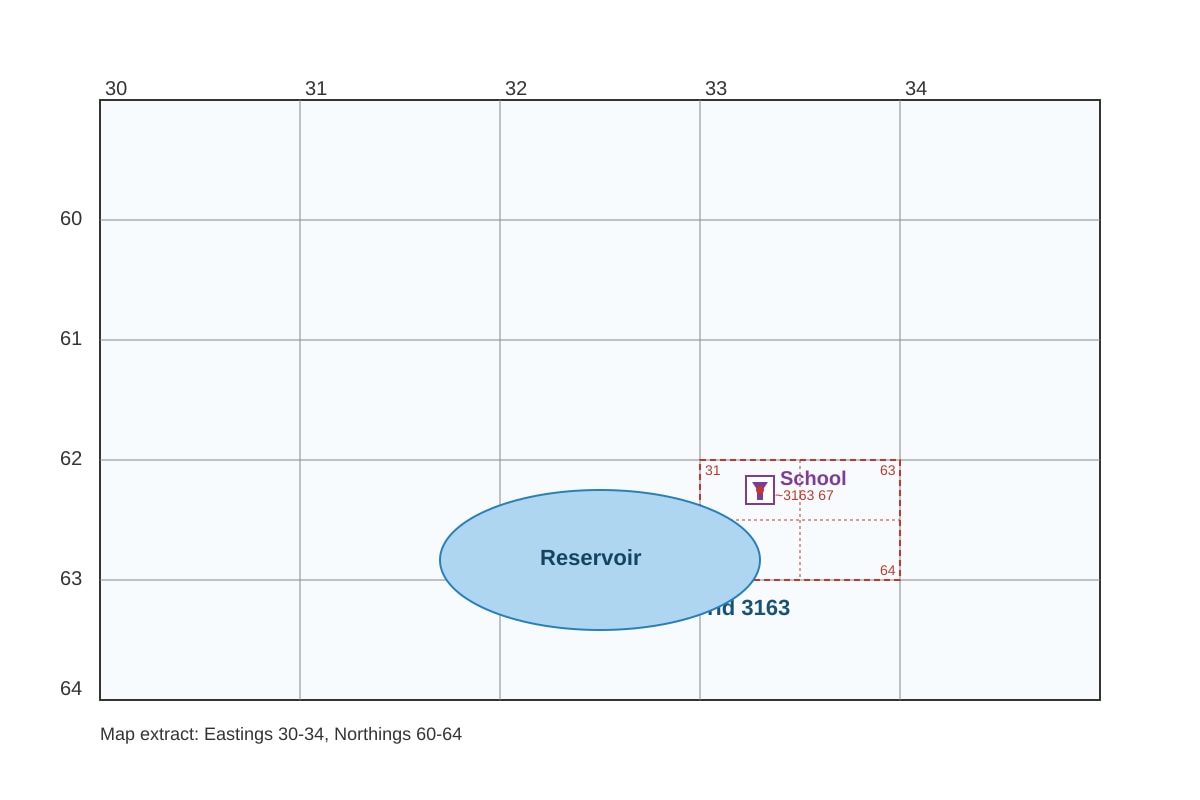
2. State the 6-figure grid reference of the school north of the reservoir. [1]
Image pending generation: map for Q2.
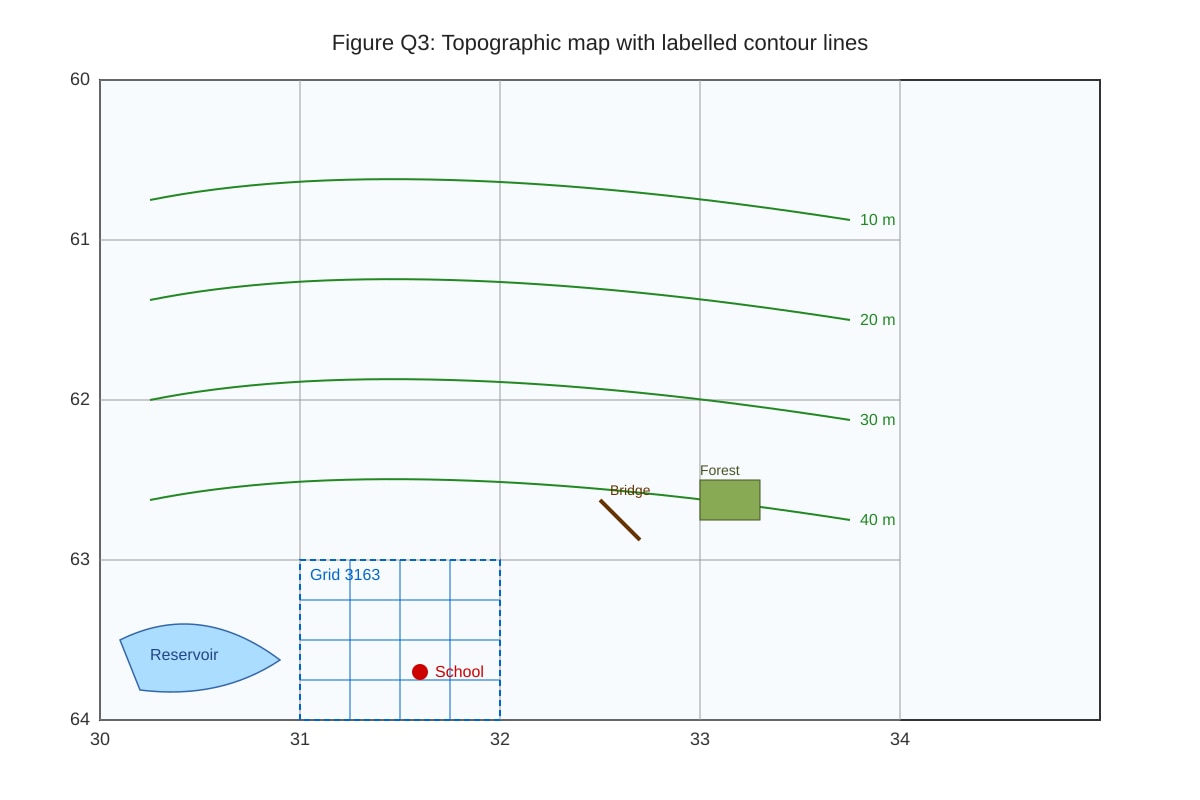
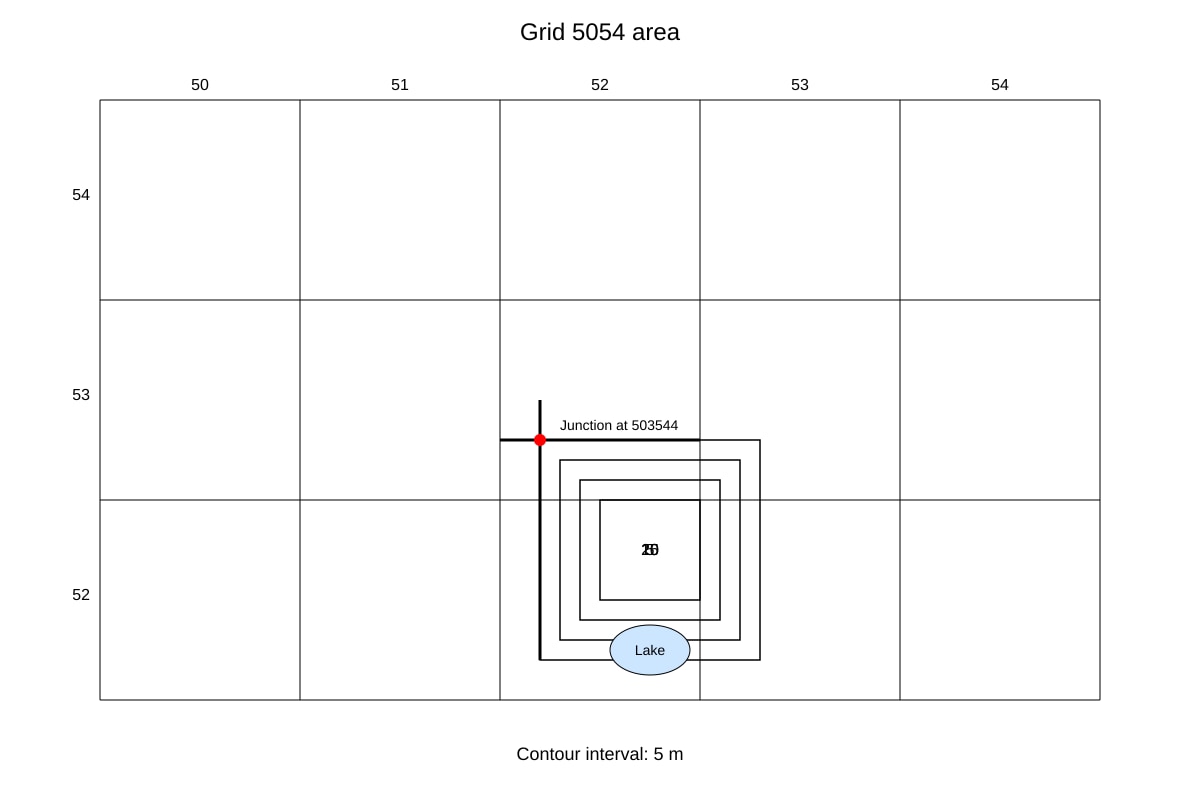
3. State the contour interval of the map in Figure Q3. [1]
Image pending generation: map for Q3.
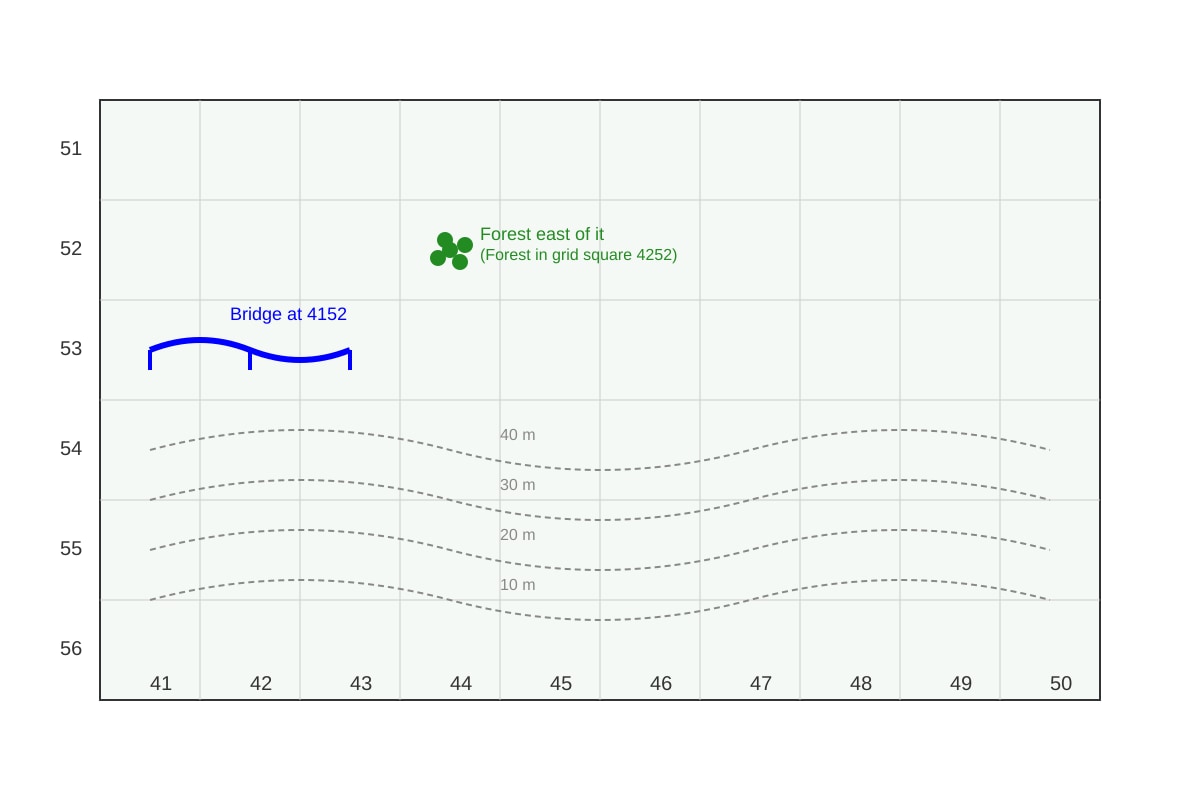
4. Give the 4-figure grid reference of the forest that is east of the bridge. [1]
Image pending generation: map for Q4.
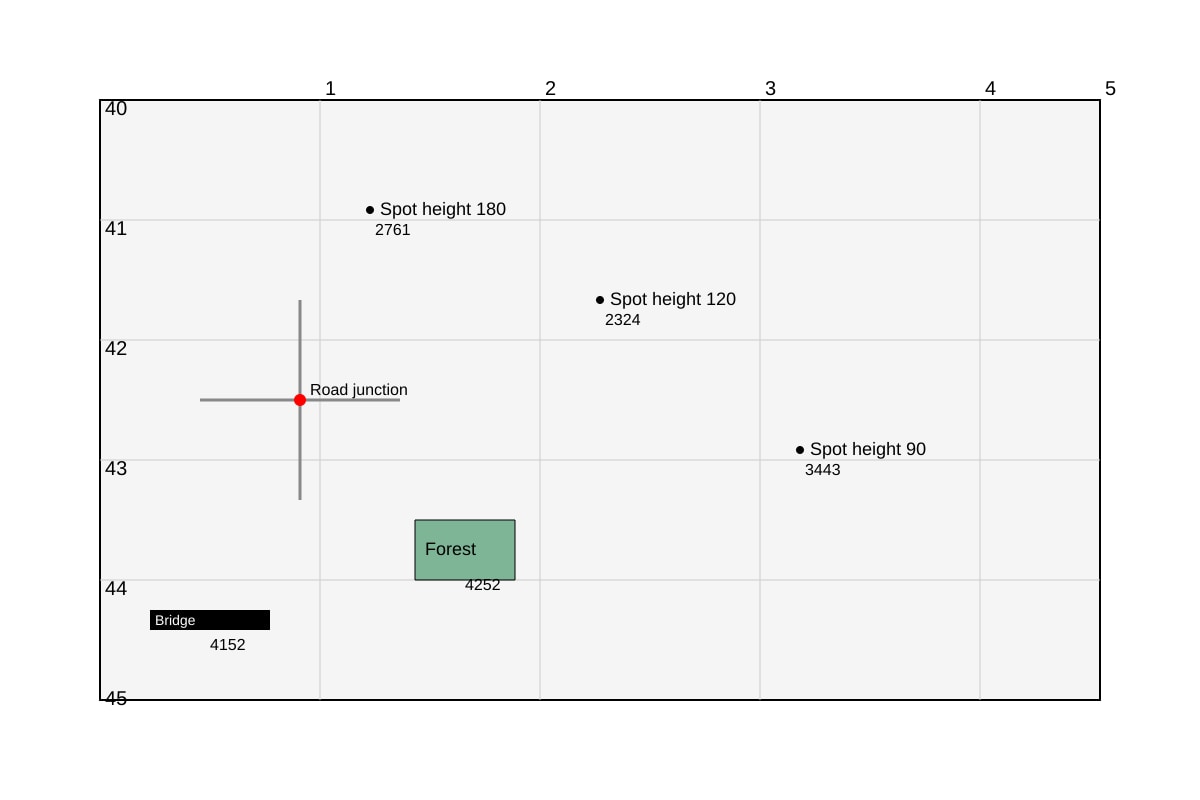
5. State the 4-figure grid reference of the highest point labelled on the map. [1]
Image pending generation: map for Q5.
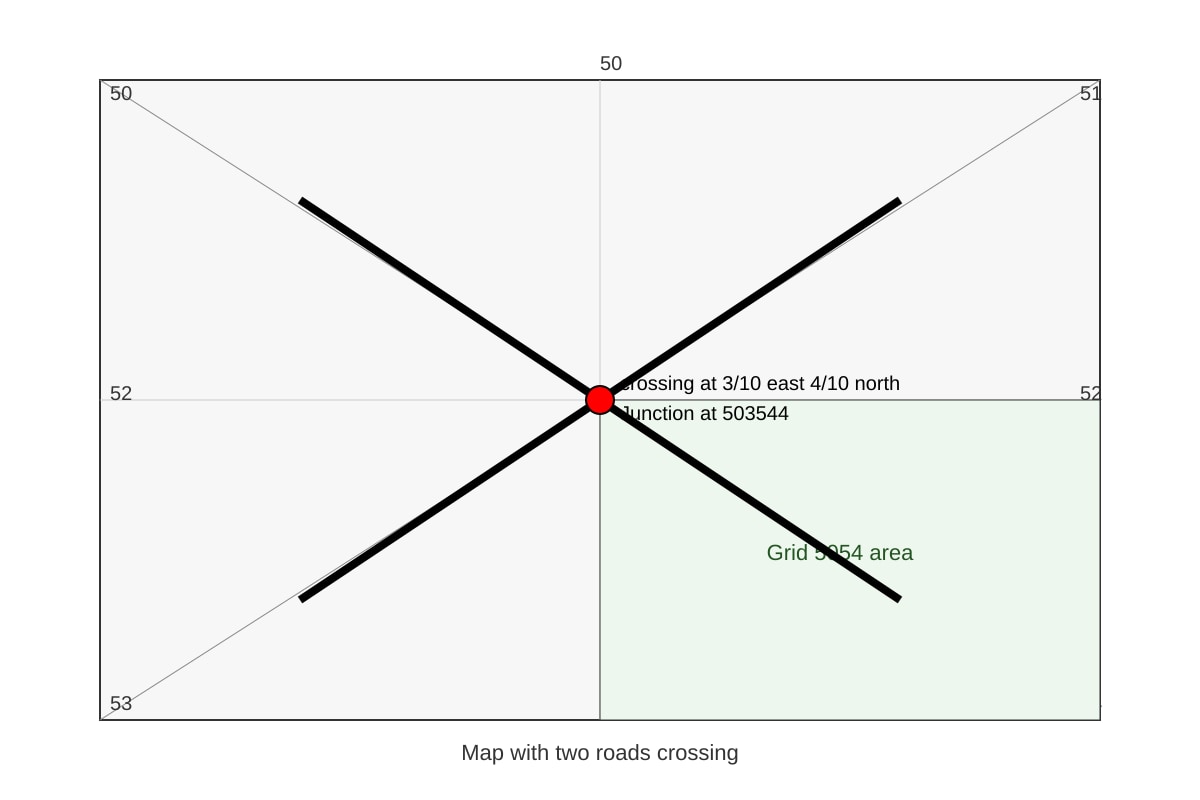
6. State the 6-figure grid reference of the junction of the two roads. [1]
Image pending generation: map for Q6.
7. What is the contour interval shown? [1]
Image pending generation: map for Q7.
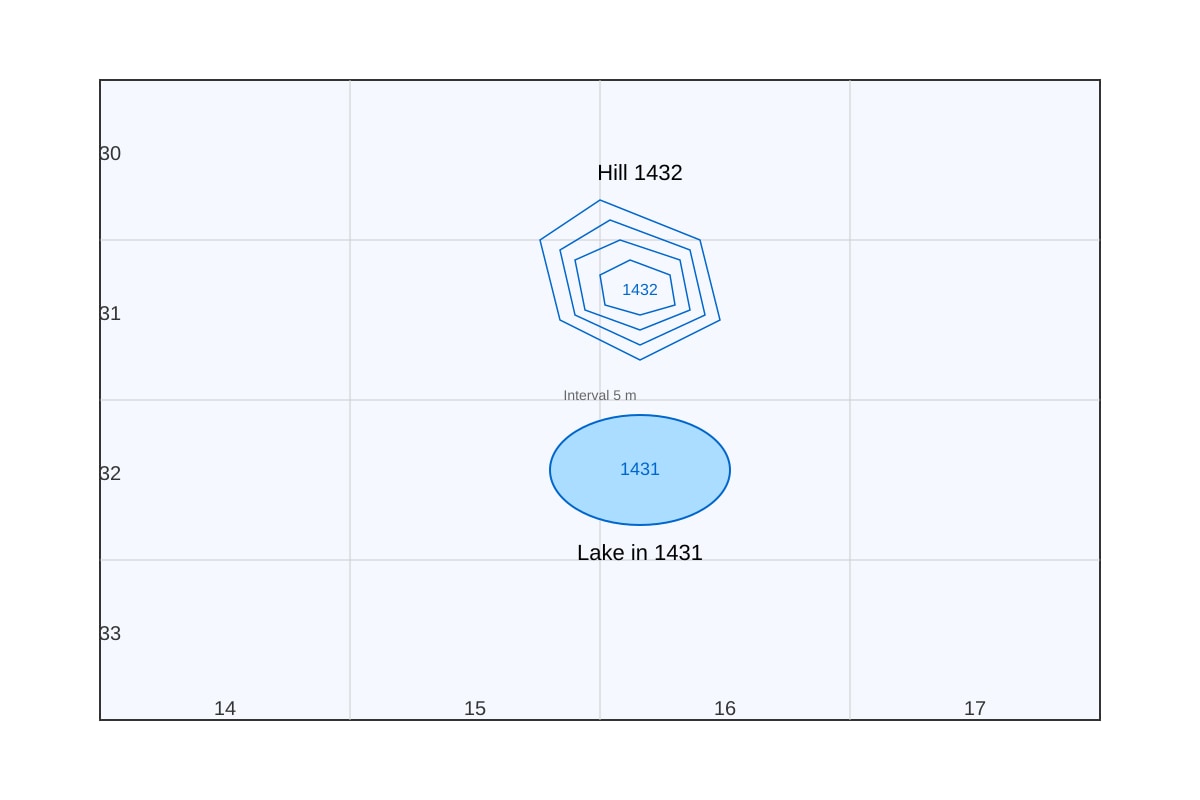
8. State the 4-figure grid reference of the lake south of the hill. [1]
Image pending generation: map for Q8.
Section B: Data Interpretation (Questions 9–14) [12 marks]
9. Study the table below. State the planet with the greatest number of moons. [1]
| Planet | Distance from Sun (million km) | Number of Moons | Diameter (km) |
|---|---|---|---|
| Mercury | 58 | 0 | 4879 |
| Venus | 108 | 0 | 12104 |
| Earth | 150 | 1 | 12756 |
| Mars | 228 | 2 | 6794 |
| Jupiter | 778 | 95 | 142984 |
10. Using the table in Q9, describe two patterns in the data. [2]
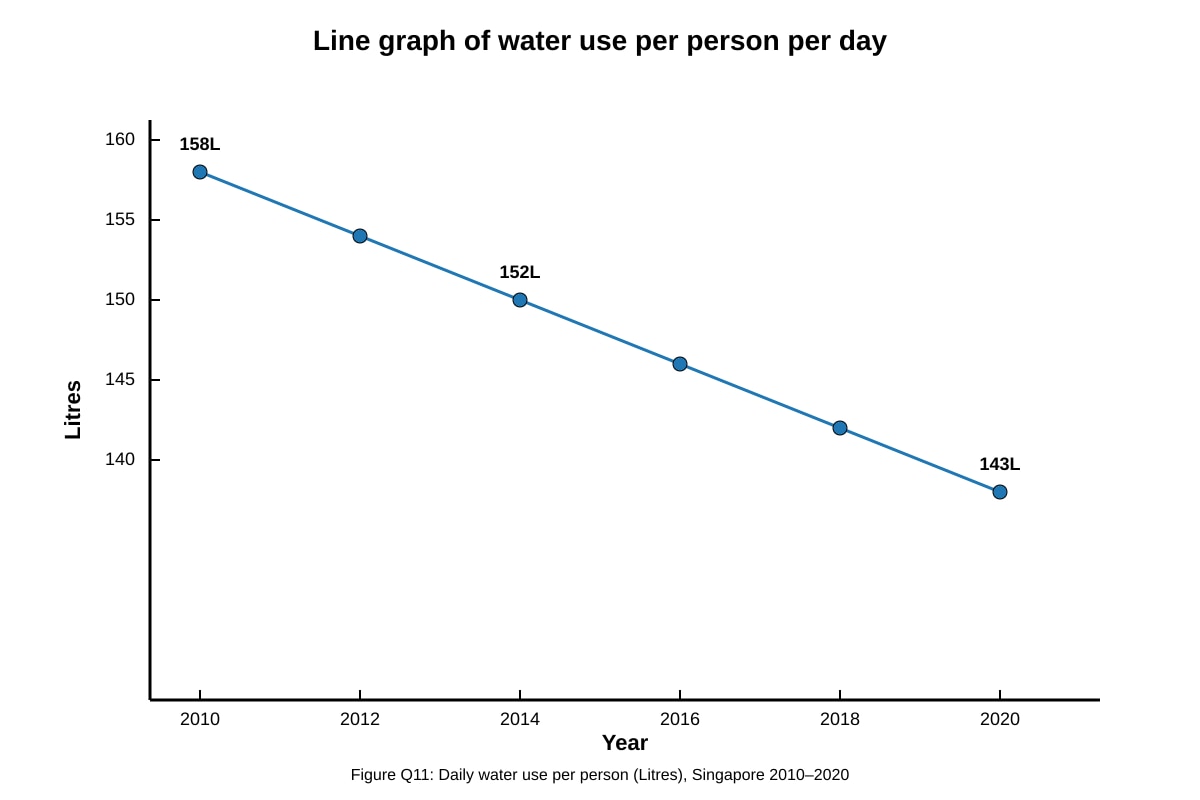
11. Study Figure Q11. Describe the trend in Singapore's daily water use per person from 2010 to 2020. [3]
Image pending generation: graph for Q11.
12. A class tested water quality at Site X (forest stream) and Site Y (urban canal). Turbidity: X=2 NTU, Y=15 NTU. Dissolved oxygen: X=8 mg/L, Y=4 mg/L. Which site has healthier water? Give two reasons. [3]
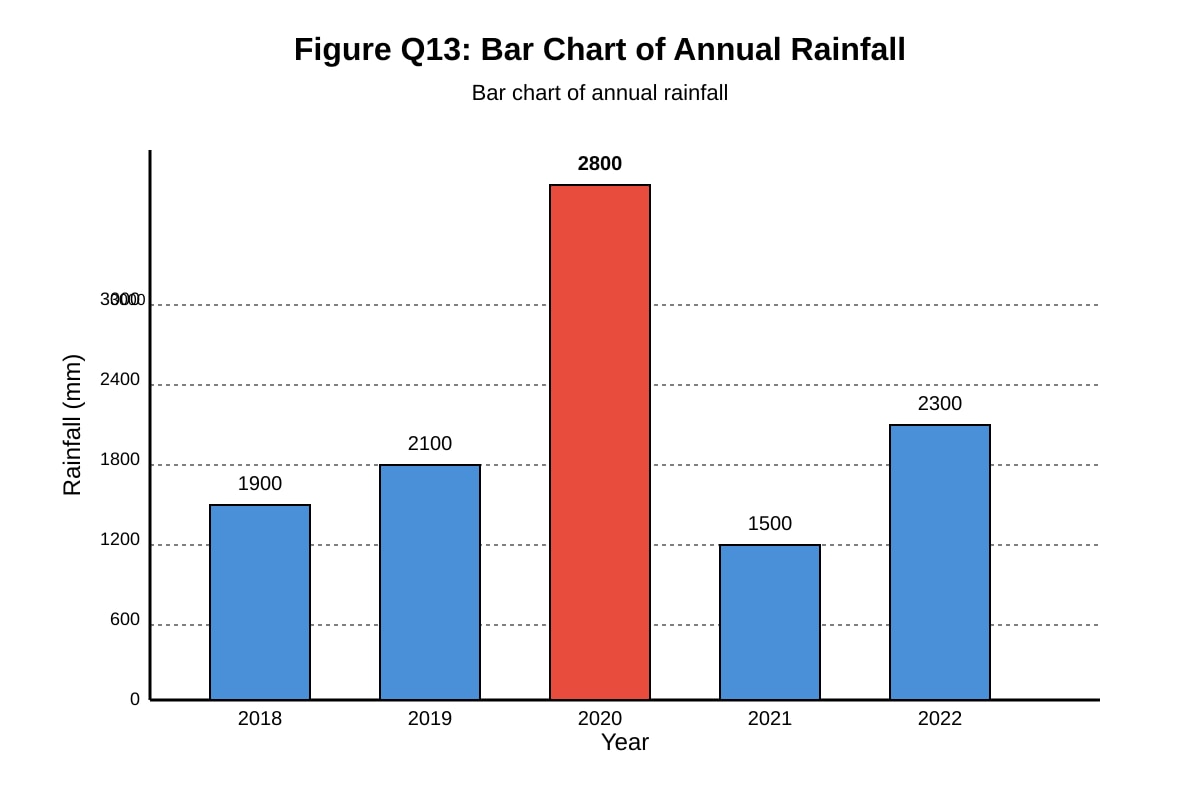
13. Study the bar chart in Figure Q13. State which year had the highest rainfall and the amount. [2]
Image pending generation: chart for Q13.
14. Using the table below, calculate the mean temperature for the four months. [3]
| Month | Temperature (°C) |
|---|---|
| Jan | 26 |
| Apr | 28 |
| Jul | 27 |
| Oct | 27 |
Section C: Graph and Map Application (Questions 15–20) [20 marks]
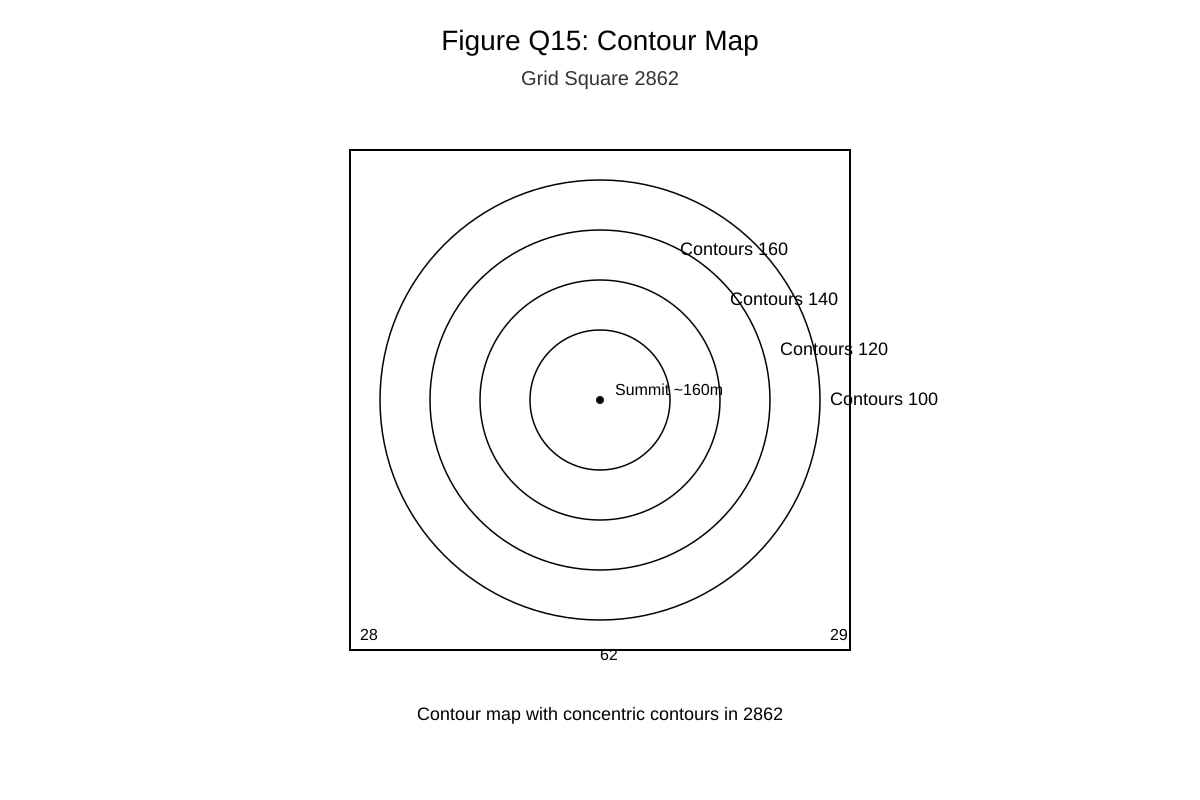
15. Study the contour map in Figure Q15. Describe the landform in grid square 2862 and explain how you know. [3]
Image pending generation: map for Q15.
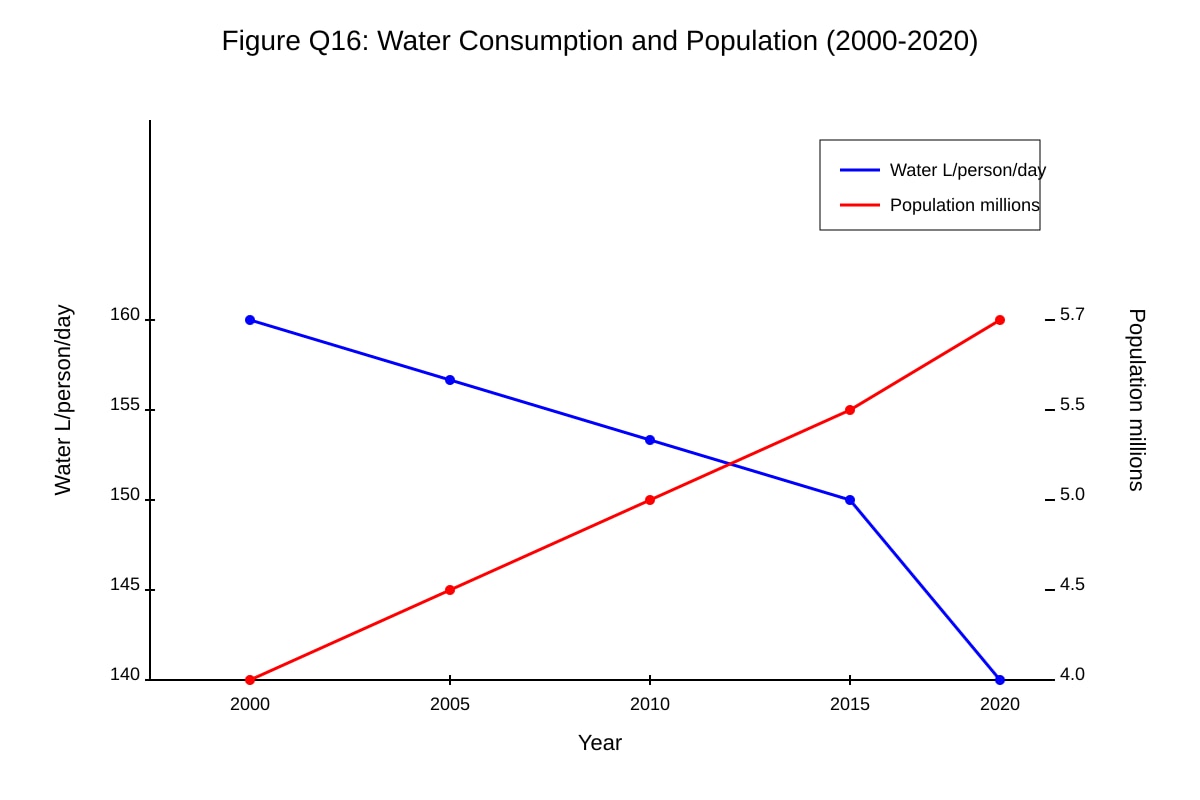
16. Compare the trends in water consumption and population from 2000 to 2020 using Figure Q16. [4]
Image pending generation: graph for Q16.
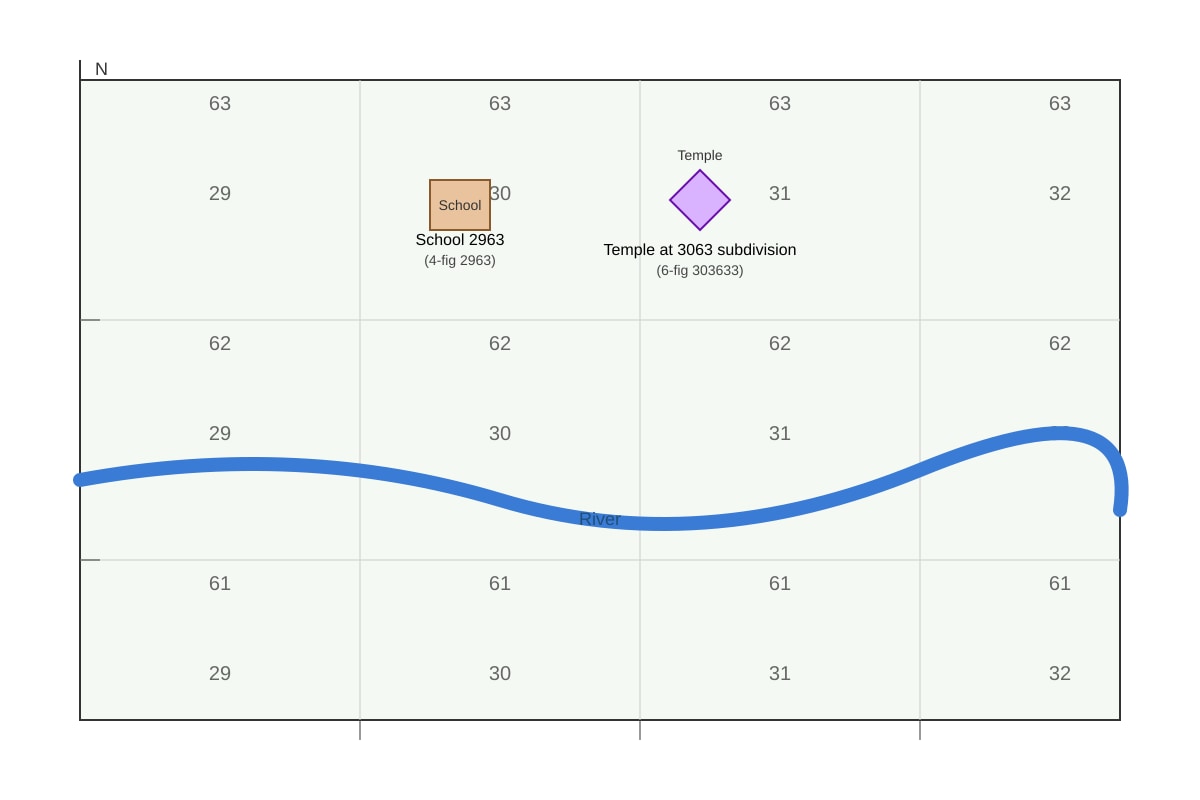
17. State the 4-figure grid reference of the school that is north of the river, then state the 6-figure reference of the temple east of it. [2]
Image pending generation: map for Q17.
18. A geography class wants to investigate water quality at an urban stream and a forest stream. Suggest two methods and explain why each is suitable. [4]
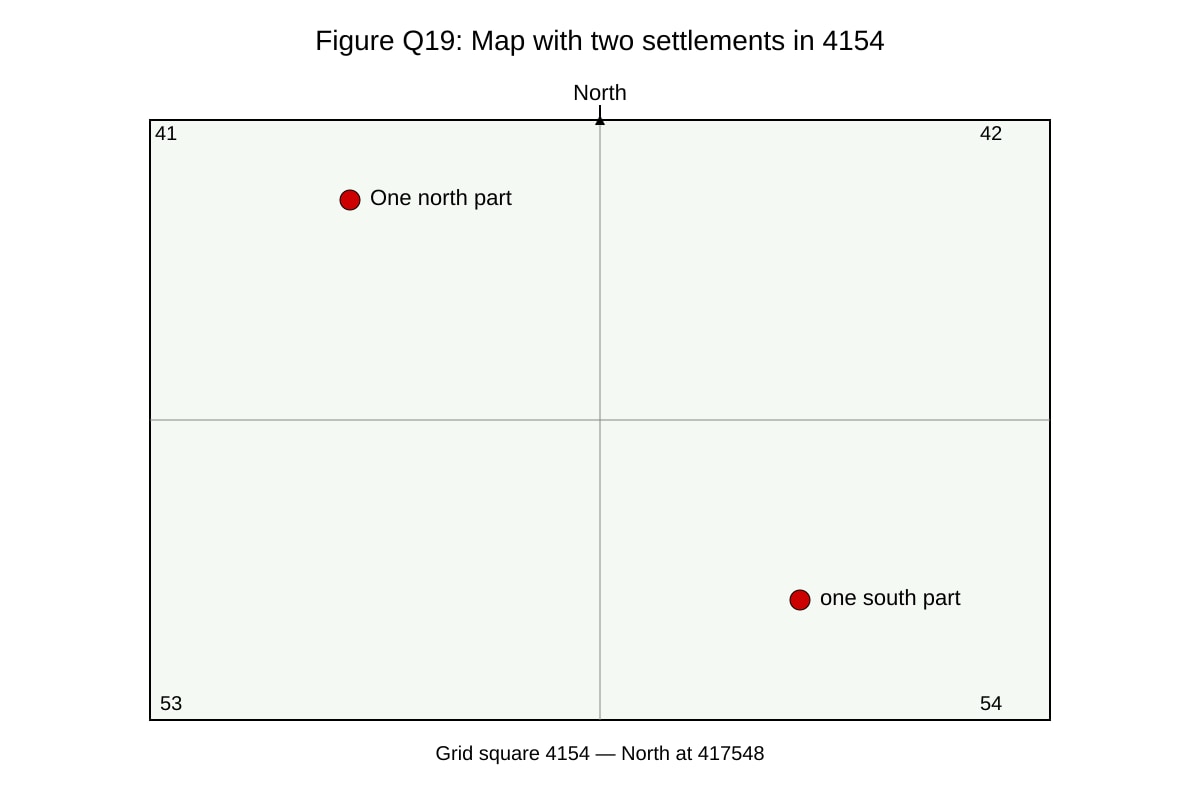
19. Study Figure Q19. State the 6-figure grid reference of the northernmost settlement in grid square 4154. [2]
Image pending generation: map for Q19.
20. Using the data below, describe the relationship between temperature and visitor numbers at a park. [5]
| Temperature (°C) | Visitors |
|---|---|
| 24 | 120 |
| 27 | 200 |
| 30 | 310 |
| 33 | 400 |
[End of Paper — Total 40 marks]
Answers
TuitionGoWhere Practice Paper Answer Key — Geography Secondary 1 (Version 4)
Total Marks: 40
Section A: Map Reading (8 marks)
Q1. 2152
Teaching note: Read easting (21) first, then northing (52). Common mistake: reversing order. [1]
Q2. 316637 (acceptable 316636–316638)
Method: 4-fig = 3163, school at 6/10 east, 7/10 north → 316637. [1]
Q3. 10 m
Method: Difference between adjacent labelled contours (20–10). [1]
Q4. 4252
Forest east of bridge at 4152 → grid square 4252. [1]
Q5. 2761
Highest spot height 180 m at that grid. [1]
Q6. 503544
Junction at 3/10 east, 4/10 north of 5035. [1]
Q7. 5 m
Contours 5,10,15 → interval 5 m. [1]
Q8. 1431
Lake south of hill 1432 → 1431. [1]
Section B: Data Interpretation (12 marks)
Q9. Jupiter
Table shows 95 moons, highest. [1]
Q10. [2 total]
- Pattern 1: Number of moons increases with distance from Sun (Mercury 0 → Jupiter 95). [1]
- Pattern 2: Diameter is largest for Jupiter (142984 km) and smaller for inner planets. [1]
Marking: 1 mark each clear pattern with evidence.
Q11. [3]
- Water use fell from 158 L (2010) to 143 L (2020). [1]
- Steady decrease over time. [1]
- Drop of 15 L per person per day. [1]
Marking descriptors: trend stated (1), evidence used (1), quantification (1).
Q12. [3]
Site X (forest stream) healthier. [1]
Reason 1: Lower turbidity (2 NTU vs 15) = clearer water. [1]
Reason 2: Higher dissolved oxygen (8 vs 4 mg/L) = better for aquatic life. [1]
Q13. [2]
Year: 2020 [1]; Amount: 2800 mm [1].
Q14. [3]
Mean = (26+28+27+27) / 4 = 108/4 = 27 °C. [2 for calculation, 1 for unit/answer]
Step-by-step: sum = 108, divide by 4.
Section C: Graph and Map Application (20 marks)
Q15. [3]
Landform: Hill. [1]
Explanation: Concentric contours with values increasing to centre (100→160 m). [1]
Summit ~160 m, slopes all around. [1]
Q16. [4]
- Water consumption decreased (160→140 L). [1]
- Population increased (4.0→5.7 million). [1]
- Opposite trends. [1]
- Singapore reduced per capita use despite growth. [1]
Q17. [2]
4-fig school: 2963 [1]; 6-fig temple: 303633 [1].
Q18. [4]
Method 1: Measure turbidity with tube — shows suspended particles, suits comparing clarity. [2]
Method 2: Test dissolved oxygen with kit — indicates pollution level, suits health check. [2]
Q19. [2]
416548 (or 417547–417549). Northernmost in square = higher northing. [2]
Q20. [5]
- As temperature rises, visitors increase. [1]
- 24°C→120, 33°C→400. [1]
- Positive relationship. [1]
- From 24 to 33°C, visitors more than triple. [1]
- Likely warmer weather attracts park visitors. [1]
Marking: description (2), data evidence (2), conclusion (1).
Free quiz and exam paper access
Enter your details to view this paper
Your access is remembered on this device.