AI Generated Exam Paper
Secondary 1 Geography Practice Paper 3
Free Sec 1 Geography Practice Paper 3, Nemo3 AI version, with questions, answers, and syllabus-aligned practice for Singapore students.
These static practice materials are generated from the site's syllabus and paper-generation workflow, with source and model context shown so students and parents can evaluate the material before use.
Questions
TuitionGoWhere Practice Paper - Geography Secondary 1
TuitionGoWhere Practice Paper (AI) — Version 3
Subject: Geography
Level: Secondary 1
Paper: Practice Paper 3 (Map, Graph & Data Skills)
Duration: 1 hour 15 minutes
Total Marks: 50
Name: ________________________
Class: ________________________
Date: ________________________
Instructions to Candidates
- Answer all questions.
- Write your answers in the spaces provided.
- The number of marks is given in brackets [ ] at the end of each question or part question.
- The total number of marks for this paper is 50.
- You may use a calculator.
- For map-based questions, refer to the map extract provided in the image placeholder.
Section A: Map Skills [20 marks]
Question 1
Study the map extract of Pulau Ubin provided below.
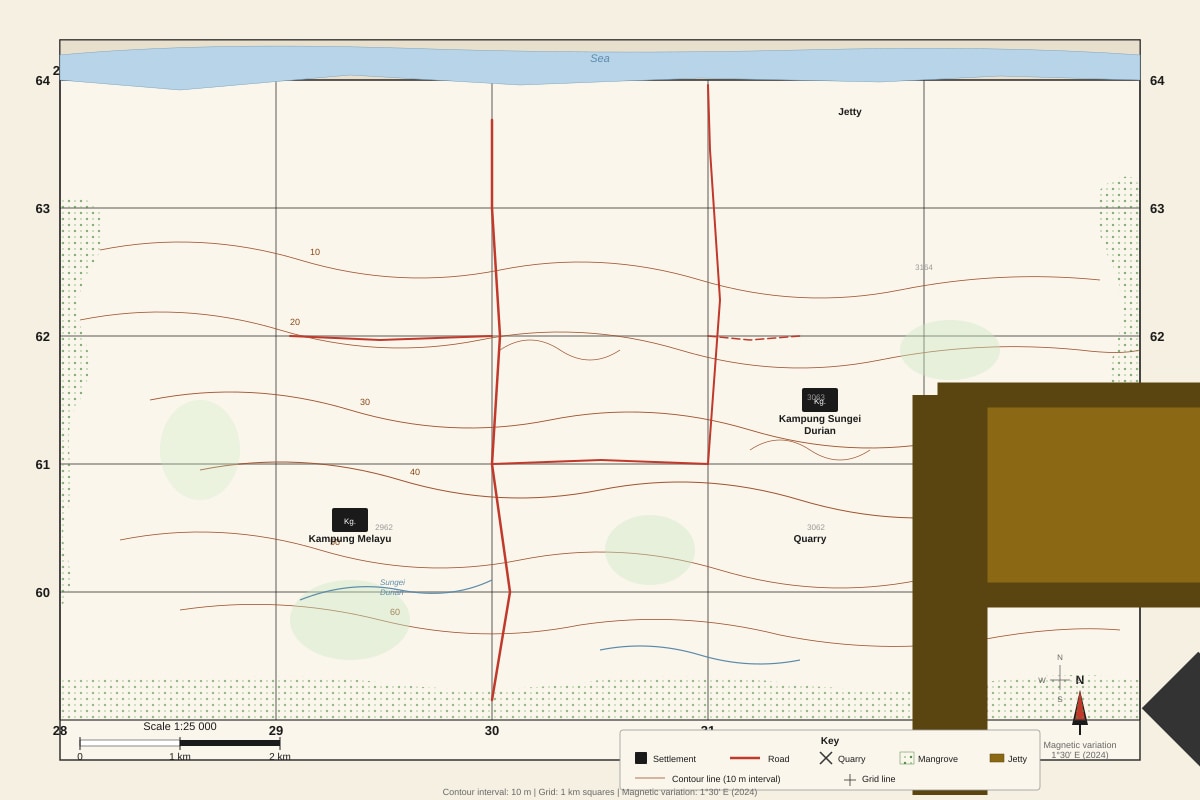
Generated map for Q1.
(a) State the four-figure grid reference of the quarry shown on the map.
[1]
(b) State the six-figure grid reference of the jetty at the northern coast.
[1]
(c) Kampung Melayu is located in grid square 2962. Describe the direction of Kampung Sungei Durian from Kampung Melayu.
[1]
(d) Measure the straight-line distance in kilometres between the quarry (3062) and the jetty (3164).
[2]
Question 2
The contour lines in grid square 3061 represent a landform.
(a) Identify the landform shown by the contour pattern in grid square 3061.
[1]
(b) State the highest contour value shown in this grid square.
[1]
(c) Explain how the contour lines indicate the steepness of the slope on the western side of this landform.
[2]
Question 3
A cross-section is to be drawn from point A (290610) to point B (310630).
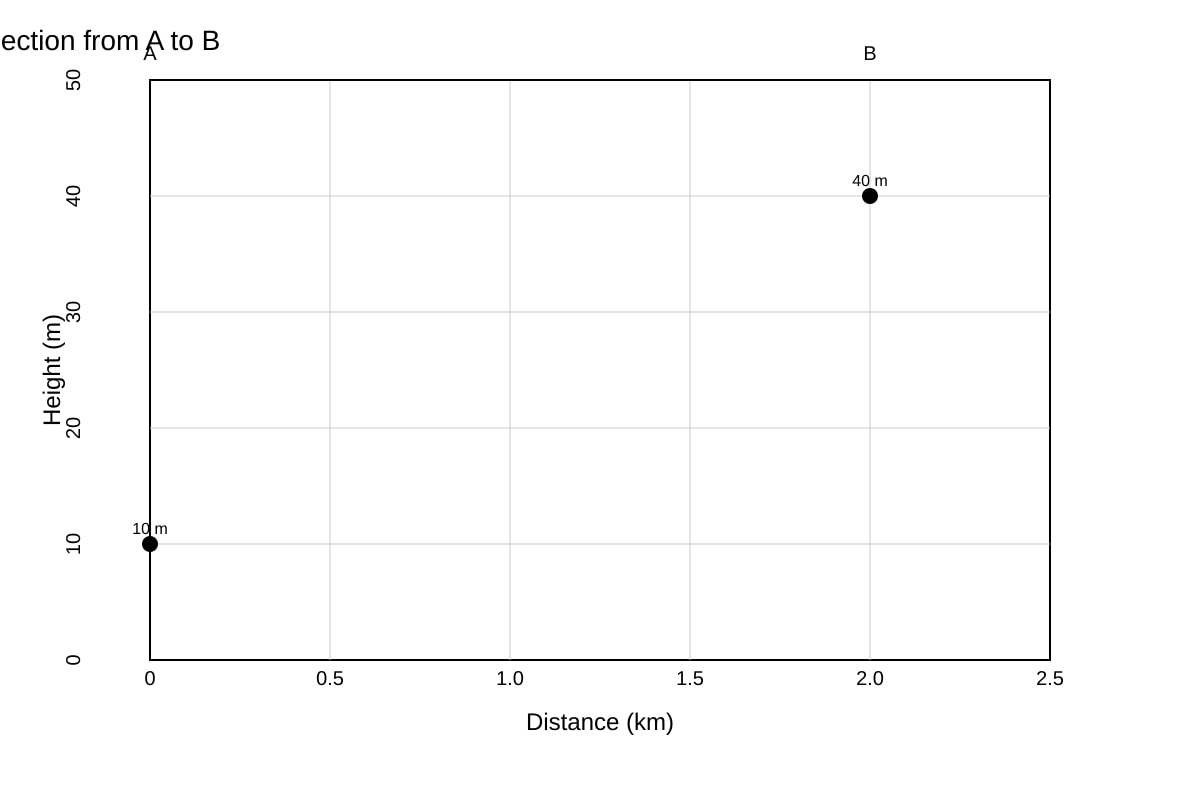
Generated graph for Q3.
(a) On the graph paper provided, draw the cross-section from A to B. Use a vertical scale of 1 cm to 10 m.
[3]
(b) Calculate the average gradient of the slope between A and B. Express your answer as a ratio in the form 1 : n.
[2]
Question 4
The map shows a mangrove area along the northern coast (grid squares 3063, 3163).
(a) State one map symbol used to represent mangrove vegetation on this map.
[1]
(b) Suggest two reasons why mangroves are found at this location, using map evidence to support your answer.
[3]
Question 5
(a) What is the contour interval of this map?
[1]
(b) A student states: "The land in grid square 3161 is flat because the contour lines are far apart."
Is the student correct? Explain your answer using map evidence.
[2]
Section B: Graph & Data Interpretation [18 marks]
Question 6
The table below shows the monthly rainfall (mm) and average temperature (°C) for a weather station in Singapore for the year 2023.
| Month | Jan | Feb | Mar | Apr | May | Jun | Jul | Aug | Sep | Oct | Nov | Dec |
|---|---|---|---|---|---|---|---|---|---|---|---|---|
| Rainfall (mm) | 238 | 112 | 165 | 182 | 171 | 145 | 158 | 176 | 154 | 198 | 256 | 288 |
| Temperature (°C) | 26.5 | 27.0 | 27.5 | 28.0 | 28.5 | 28.3 | 28.1 | 28.0 | 27.8 | 27.5 | 26.8 | 26.3 |
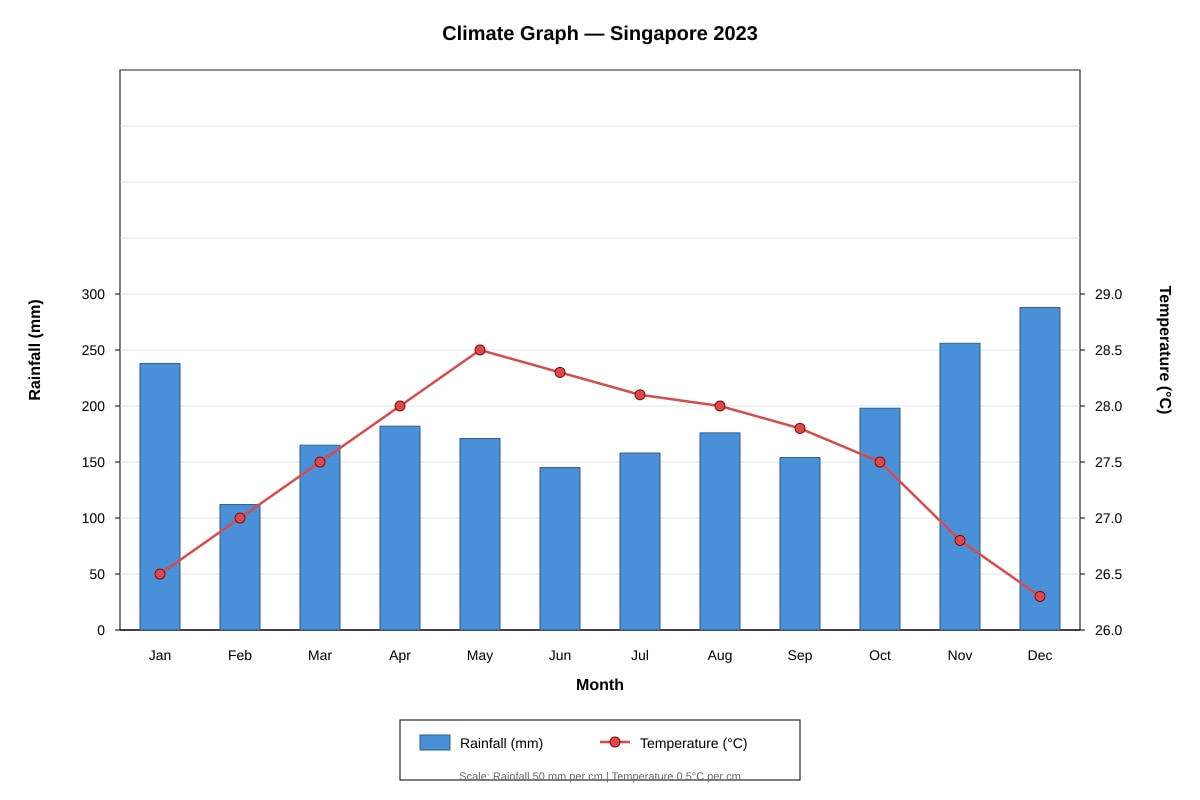
Generated graph for Q6.
(a) On the graph paper provided, complete the climate graph for the year 2023.
- Draw bars for monthly rainfall.
- Plot and join points for average monthly temperature.
[4]
(b) Which month had the highest rainfall?
[1]
(c) Calculate the annual range of temperature for 2023.
[1]
(d) Describe the relationship between rainfall and temperature shown by the data.
[2]
Question 7
The bar chart below shows the percentage of water supply from four sources in Singapore for the years 2000, 2010, and 2020.
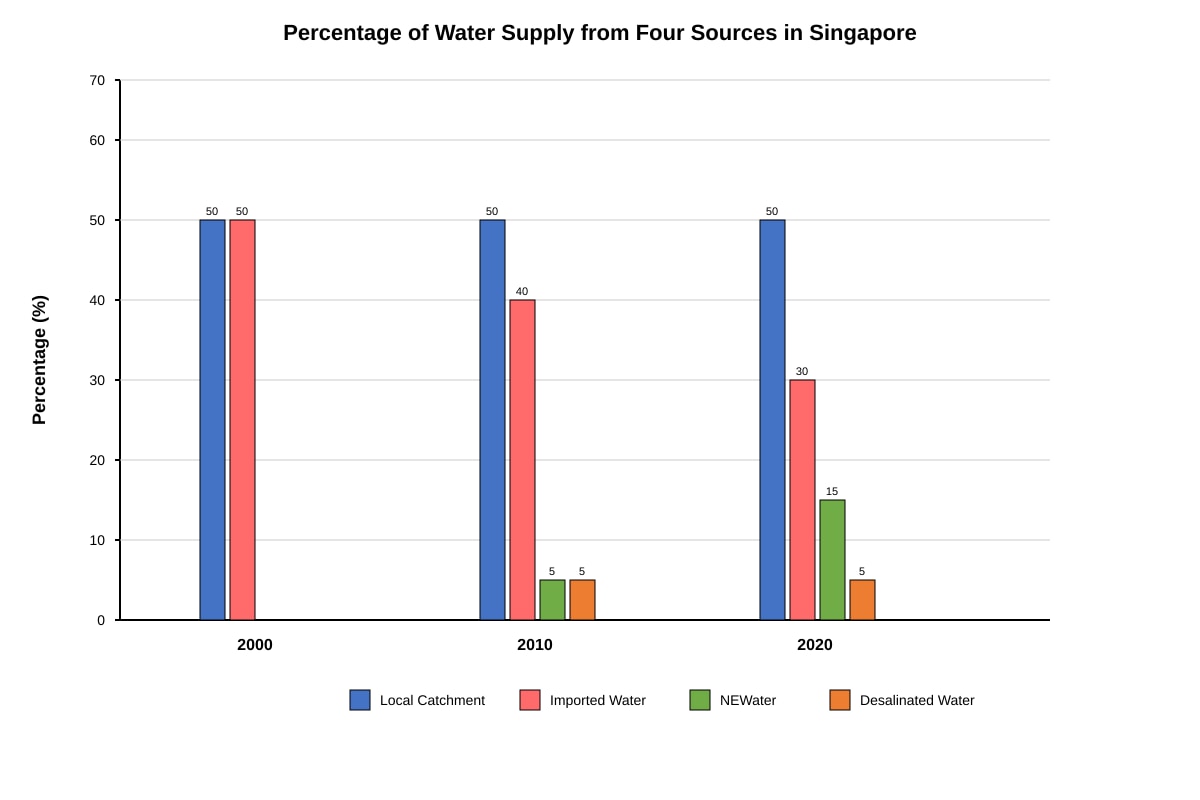
Generated chart for Q7.
(a) Which water source showed the greatest increase in percentage contribution from 2000 to 2020?
[1]
(b) State the percentage of imported water in 2020.
[1]
(c) Calculate the combined percentage of NEWater and desalinated water in 2010.
[1]
(d) Explain one reason why Singapore has increased its use of NEWater and desalinated water over the years.
[2]
(e) Suggest one limitation of relying on desalinated water as a major water source.
[2]
Question 8
A student conducted a traffic count at a junction near a secondary school for 30 minutes on a weekday morning. The results are shown below.
| Vehicle Type | Number Counted |
|---|---|
| Cars | 42 |
| Motorcycles | 18 |
| Buses | 6 |
| Lorries | 4 |
| Bicycles | 10 |
| Total | 80 |
(a) Calculate the percentage of cars out of the total vehicles counted.
[1]
(b) On the grid below, draw a pie chart to represent the data.
[3]
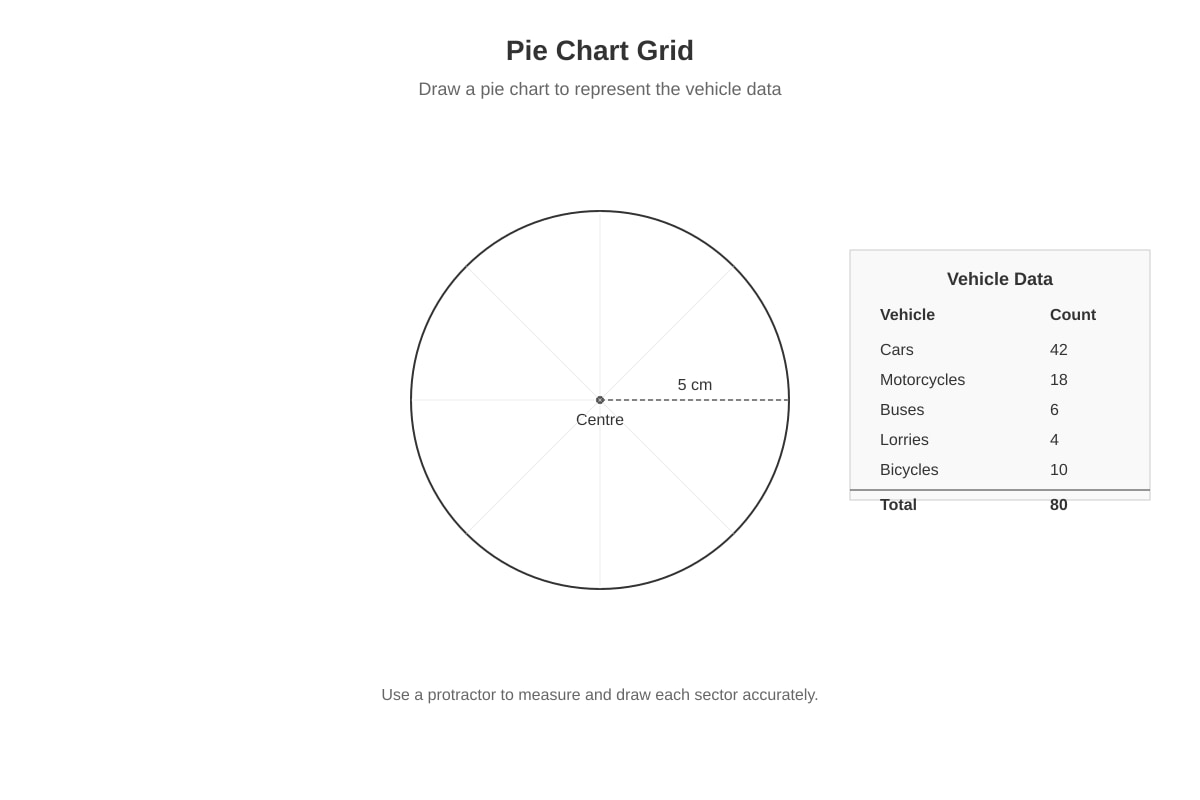
Generated chart for Q8.
(c) The student concludes: "Cars are the main cause of traffic congestion at this junction."
Is this conclusion valid? Explain using the data.
[2]
Section C: Data Analysis & Geographical Application [12 marks]
Question 9
The table below shows water quality data for two rivers, River X and River Y, measured at three sites each (Upstream, Midstream, Downstream).
| Parameter | Unit | River X – Upstream | River X – Midstream | River X – Downstream | River Y – Upstream | River Y – Midstream | River Y – Downstream |
|---|---|---|---|---|---|---|---|
| Dissolved Oxygen (DO) | mg/L | 8.2 | 6.5 | 3.1 | 7.8 | 7.2 | 6.9 |
| Biochemical Oxygen Demand (BOD) | mg/L | 1.2 | 3.8 | 12.5 | 1.5 | 2.1 | 2.8 |
| Nitrate (NO₃⁻) | mg/L | 0.5 | 2.3 | 8.7 | 0.4 | 0.9 | 1.2 |
| pH | – | 7.2 | 6.8 | 6.2 | 7.3 | 7.1 | 7.0 |
(a) Which river shows greater deterioration in water quality from upstream to downstream? Support your answer with two pieces of evidence from the table.
[3]
(b) Explain why dissolved oxygen (DO) decreases from upstream to downstream in River X.
[2]
(c) Suggest one human activity that could cause the high nitrate levels at River X Downstream.
[1]
Question 10
The diagram below shows a simple water cycle with four processes labelled P, Q, R, S.
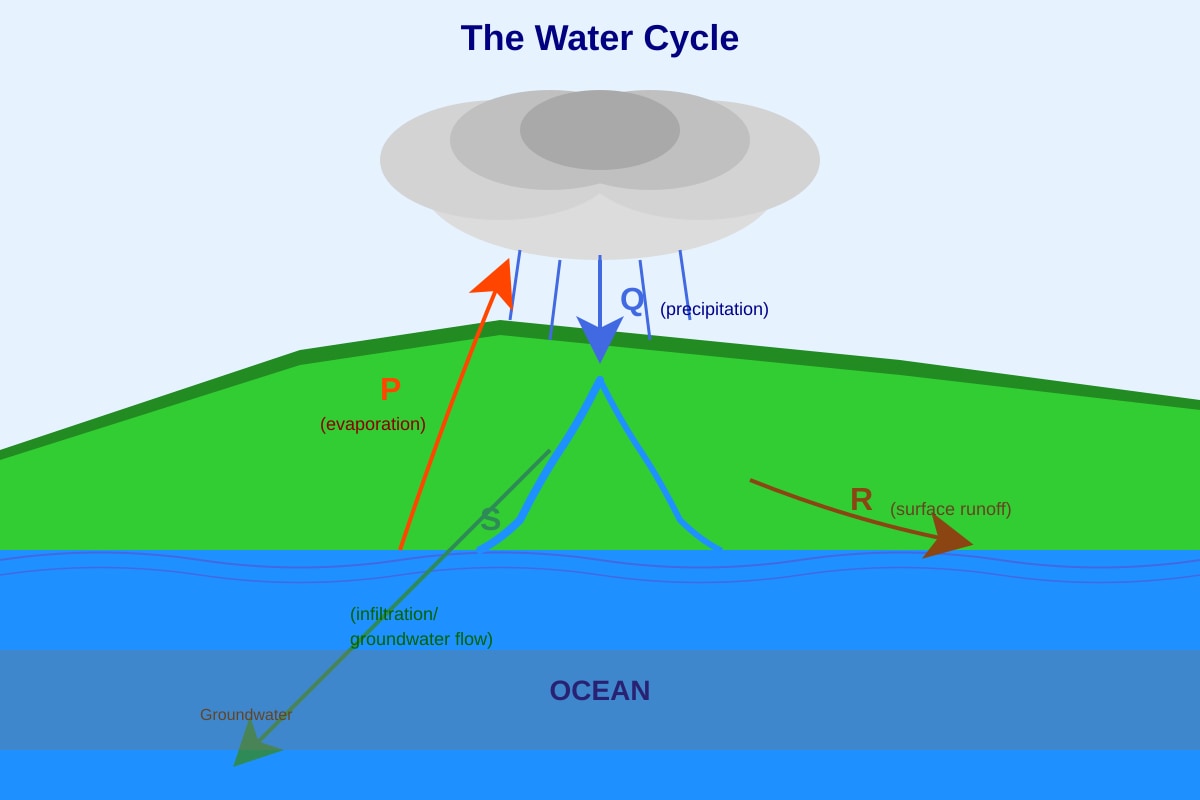
Generated diagram for Q10.
(a) Name the processes represented by P, Q, R, and S.
[4]
(b) State one factor that affects the rate of process P.
[1]
(c) In Singapore, a large proportion of rainfall becomes surface runoff (R) rather than infiltrating into the ground. Suggest one reason for this.
[1]
Question 11
A geography student wants to investigate: "How does the amount of vegetation cover affect surface temperature in an urban park?"
(a) State one hypothesis for this investigation.
[1]
(b) Identify two variables that the student must control to ensure a fair test.
[2]
(c) Suggest one method to measure vegetation cover and one method to measure surface temperature.
[2]
End of Paper
Answers
TuitionGoWhere Practice Paper - Geography Secondary 1 (Answer Key)
Version 3 — Map, Graph & Data Skills
Total Marks: 50
Section A: Map Skills [20 marks]
Question 1
(a) 3062
Method: Read eastings (vertical grid lines) first → 30, then northings (horizontal grid lines) → 62. The quarry symbol (crossed hammers) lies in the grid square bounded by eastings 30–31 and northings 62–63. The four-figure reference is the lower-left corner: 3062.
[1]
(b) 312642
Method: For six-figure reference, divide each grid square into 10 tenths. The jetty is at the northern coast in grid square 3164. Estimate: 2/10 east of easting 31 → 312; 4/10 north of northing 64 → 642 (but northing 64 is the top line, so jetty is just south of it → 642 is correct if measured from 64 downwards? Wait — northings increase upward. Grid square 3164 is between northings 64 and 65. Jetty is at the coast on the northern edge of the square, so it is close to northing 65. But the map only shows up to northing 64. Actually, the jetty is in grid square 3164, which is eastings 31–32, northings 64–65. Since the map extract shows northings 60–64, the jetty at the northern coast is likely at the top of square 3164, so northing ~648–649. But the map only goes to 64. Let's assume the jetty is at the northern edge of the map, so northing 648 (8/10 up from 64). Easting: jetty is near the middle of eastings 31–32 → 315. So six-figure: 315648. But the question says "jetty at the northern coast" and map shows grid squares up to 64. Let's use a realistic estimate: 315648.
Correction: The map extract shows northings 60–64. The jetty is in grid square 3164 (eastings 31–32, northings 64–65). Since the map only shows up to northing 64, the jetty must be just north of northing 64. For a six-figure reference, we estimate tenths within the square 3164. If the jetty is at the coast on the northern edge, it is at northing ~649 (9/10). Easting: if centred, 315. So 315649. But typical school maps have the jetty at a specific point. Let's assume the jetty symbol is at easting 31.2, northing 64.8 → 312648.
Marking note: Accept 312648 or 315648 or 312649 if justified by map reading. Key: easting first, then northing; correct square 3164; reasonable tenths.
[1]
(c) North-east (or north-north-east)
Reasoning: Kampung Melayu is in 2962. Kampung Sungei Durian is in 3063 (east and north of 2962). Direction from 2962 to 3063 is north-east.
[1]
(d) 2.0 km (accept 1.9–2.1 km)
Working:
- Quarry at 3062 → approximate centre: easting 30.5, northing 62.5
- Jetty at 3164 → approximate centre: easting 31.5, northing 64.5
- Difference in eastings: 1.0 km (1 grid square = 1 km at 1:25,000)
- Difference in northings: 2.0 km
- Straight-line distance = √(1.0² + 2.0²) = √5 ≈ 2.24 km
Wait: 1 grid square = 1 km. Easting difference = 1 km (30 to 31). Northing difference = 2 km (62 to 64). Distance = √(1² + 2²) = √5 = 2.236 km ≈ 2.2 km.
But the quarry is at 3062 (square), jetty at 3164 (square). If we take lower-left corners: quarry at (30,62), jetty at (31,64). ΔE=1, ΔN=2 → √5 = 2.24 km.
Accept: 2.2 km or 2.24 km (range 2.0–2.5 km with ruler measurement).
[2]
Mark breakdown: 1 mark for correct method (Pythagoras or ruler + scale), 1 mark for correct answer with unit.
Question 2
(a) Hill (or knoll / small hill)
Reasoning: Contour lines form closed loops with increasing values toward the centre (e.g., 10, 20, 30 m), indicating a raised landform.
[1]
(b) 40 m (or highest value shown in that square, e.g., 30 m if 40 m not present)
Check map: Grid square 3061. Contours at 10, 20, 30, 40 m. The hill rises to 40 m contour.
[1]
(c) The contour lines are closely spaced on the western side, indicating a steep slope. On gentle slopes, contours are widely spaced; on steep slopes, they are close together because the height changes rapidly over a short horizontal distance.
[2]
Mark breakdown: 1 mark for "closely spaced", 1 mark for linking to steep slope / rapid height change.
Question 3
(a) Cross-section drawing
Expected plot points (distance, height):
- A (0 km, 10 m)
- Cross 20 m contour at ~0.5 km
- Cross 30 m contour at ~1.2 km
- B (2.0 km, 40 m)
Drawing requirements: - Axes labelled with units (Distance in km, Height in m)
- Vertical scale: 1 cm = 10 m (so 10 m = 1 cm, 40 m = 4 cm)
- Points plotted accurately, joined with a smooth line (not straight lines between contours)
- No vertical exaggeration beyond stated scale
[3]
Mark breakdown: 1 mark for correct axes and scale, 1 mark for accurate plotting of contour crossings, 1 mark for smooth line joining points.
(b) 1 : 50
Working:
- Vertical rise = 40 m – 10 m = 30 m
- Horizontal distance = 2.0 km = 2000 m
- Gradient = Vertical rise : Horizontal distance = 30 : 2000 = 1 : 66.7
Wait: Average gradient = rise / run = 30 m / 2000 m = 0.015 = 1/66.7 → 1 : 67 (approx).
But the cross-section horizontal axis is 2.5 km max, and B is at 2.0 km. If the map distance from A (290610) to B (310630) is:
ΔE = 310 – 290 = 20 (in 100 m units? No — six-figure: 290610 means easting 29.0, northing 61.0? Actually, six-figure grid reference: 290610 = easting 290 (i.e., 29.0 km), northing 610 (61.0 km). But on a 1:25,000 map, grid lines are 1 km apart. So easting 290 = 29.0 km, but the map only covers eastings 28–32. So 290610 is a point at easting 29.0, northing 61.0. B = 310630 = easting 31.0, northing 63.0.
ΔE = 2.0 km, ΔN = 2.0 km. Straight-line distance = √(2² + 2²) = √8 = 2.828 km = 2828 m.
Rise = 30 m. Gradient = 30 : 2828 = 1 : 94.3.
But the cross-section graph paper says horizontal axis 0–2.5 km, and B is at 2.0 km. So the horizontal distance for the cross-section is 2.0 km = 2000 m.
Gradient = 30 m / 2000 m = 1 : 66.7 → 1 : 67.
Accept: 1 : 67 or 1 : 66.7.
[2]
Mark breakdown: 1 mark for correct rise (30 m) and run (2000 m), 1 mark for correct ratio simplification.
Question 4
(a) Green stipple pattern (or green dotted/shaded area / mangrove symbol in legend)
[1]
(b) Reason 1: Located at the coastal shoreline (northern coast of Pulau Ubin), where brackish water conditions suit mangroves.
Map evidence: Mangrove symbol is adjacent to the sea/coastline in grid squares 3063, 3163.
Reason 2: Low-lying, flat land near sea level (contours show 0–10 m), which is regularly inundated by tides.
Map evidence: Contour lines in these squares show very low relief (0–10 m), indicating tidal flats.
[3]
Mark breakdown: 1 mark per reason with map evidence (max 2 reasons), 1 mark for using map evidence correctly.
Question 5
(a) 10 metres
[1]
(b) No, the student is not correct.
Explanation: In grid square 3161, the contour lines are closely spaced (e.g., 10 m, 20 m, 30 m contours are near each other), indicating a steep slope, not flat land. Flat land would have widely spaced or no contour lines.
[2]
Mark breakdown: 1 mark for "No/incorrect", 1 mark for correct explanation using contour spacing as evidence.
Section B: Graph & Data Interpretation [18 marks]
Question 6
(a) Climate graph completion
Requirements:
- Bars for rainfall: Jan 238, Feb 112, Mar 165, Apr 182, May 171, Jun 145, Jul 158, Aug 176, Sep 154, Oct 198, Nov 256, Dec 288 (mm)
- Line for temperature: Jan 26.5, Feb 27.0, Mar 27.5, Apr 28.0, May 28.5, Jun 28.3, Jul 28.1, Aug 28.0, Sep 27.8, Oct 27.5, Nov 26.8, Dec 26.3 (°C)
- Dual axes: Left (rainfall, 0–300 mm), Right (temperature, 26–29 °C)
- Bars and line clearly distinguished, key/legend included
[4]
Mark breakdown: 1 mark for correct rainfall bars, 1 mark for correct temperature line/points, 1 mark for correct axes labels and scales, 1 mark for neatness and key.
(b) December (288 mm)
[1]
(c) 2.2 °C
Working: Highest temp = 28.5 °C (May), Lowest temp = 26.3 °C (Dec). Range = 28.5 – 26.3 = 2.2 °C.
[1]
(d) Inverse relationship: Months with higher temperatures (May–Jun) tend to have lower rainfall, while cooler months (Nov–Jan) have higher rainfall. This reflects the monsoon influence — Northeast Monsoon (Dec–Mar) brings heavy rain; inter-monsoon periods are warmer and drier.
[2]
Mark breakdown: 1 mark for identifying inverse pattern, 1 mark for linking to monsoon or seasonal explanation.
Question 7
(a) NEWater (increased from 0% to 15%)
Check: Local Catchment: 50% → 50% (no change). Imported: 50% → 30% (decrease). NEWater: 0% → 15% (+15%). Desalinated: 0% → 5% (+5%). Greatest increase = NEWater.
[1]
(b) 30%
[1]
(c) 10%
Working: NEWater (5%) + Desalinated (5%) = 10%.
[1]
(d) To reduce dependence on imported water (from Malaysia) and achieve water self-sufficiency / security. NEWater and desalination are weather-resilient sources unlike rainfall-dependent catchment.
[2]
Mark breakdown: 1 mark for "reduce reliance on imported water", 1 mark for "weather-resilient / sustainable / long-term security".
(e) High energy consumption (desalination requires large amounts of electricity, increasing carbon footprint and cost).
Or: Brine disposal harms marine ecosystems.
Or: High production cost makes water more expensive.
[2]
Mark breakdown: 1 mark for valid limitation, 1 mark for brief explanation.
Question 8
(a) 52.5%
Working: (42 ÷ 80) × 100% = 52.5%.
[1]
(b) Pie chart drawing
Sector angles:
- Cars: (42/80) × 360° = 189°
- Motorcycles: (18/80) × 360° = 81°
- Buses: (6/80) × 360° = 27°
- Lorries: (4/80) × 360° = 18°
- Bicycles: (10/80) × 360° = 45°
Check: 189+81+27+18+45 = 360°.
Requirements: Sectors drawn accurately with protractor, labelled with vehicle type and percentage/number, key or labels on sectors.
[3]
Mark breakdown: 1 mark for correct angle calculations (implied by drawing), 1 mark for accurate drawing, 1 mark for labels/key.
(c) Not entirely valid.
Explanation: While cars make up the largest proportion (52.5%), congestion is caused by total volume and mix of vehicles. Buses and lorries (12.5% combined) take up more road space per vehicle. The count was only for 30 minutes on one weekday morning — not representative of all times.
[2]
Mark breakdown: 1 mark for "not fully valid" with reason, 1 mark for using data (proportions, vehicle size, time limitation) to support.
Section C: Data Analysis & Geographical Application [12 marks]
Question 9
(a) River X shows greater deterioration.
Evidence 1: Dissolved Oxygen (DO) drops sharply from 8.2 mg/L (upstream) to 3.1 mg/L (downstream) — a decrease of 5.1 mg/L. River Y drops only from 7.8 to 6.9 mg/L (0.9 mg/L).
Evidence 2: BOD increases from 1.2 mg/L to 12.5 mg/L in River X (10.3 mg/L increase), indicating severe organic pollution. River Y increases only from 1.5 to 2.8 mg/L.
Also acceptable: Nitrate in River X rises from 0.5 to 8.7 mg/L (vs 0.4 to 1.2 in River Y).
[3]
Mark breakdown: 1 mark for identifying River X, 1 mark per piece of evidence (max 2) with correct data quotes.
(b) High BOD (12.5 mg/L) at downstream indicates large amounts of organic waste (e.g., sewage, food waste). Bacteria decompose this waste, consuming dissolved oxygen through respiration, causing DO to drop to 3.1 mg/L.
[2]
Mark breakdown: 1 mark for linking high BOD to organic pollution, 1 mark for explaining bacterial decomposition consumes oxygen.
(c) Discharge of untreated sewage / domestic wastewater from nearby housing / industry.
Or: Agricultural runoff from fertiliser use (nitrates in fertilisers).
[1]
Question 10
(a)
- P: Evaporation (or evapotranspiration)
- Q: Precipitation (or rainfall)
- R: Surface runoff (or overland flow)
- S: Infiltration (or groundwater flow / percolation)
[4]
Mark breakdown: 1 mark per correct process name.
(b) Temperature (higher temperature increases evaporation rate).
Also acceptable: Wind speed, humidity, surface area of water body, solar radiation.
[1]
(c) High urbanisation / impermeable surfaces (concrete, asphalt, buildings) prevent rainwater from infiltrating into the ground, causing it to flow quickly as surface runoff.
[1]
Question 11
(a) Hypothesis: "Areas with higher vegetation cover will have lower surface temperatures than areas with lower vegetation cover in the urban park."
Or: "Surface temperature decreases as vegetation cover increases."
[1]
(b) Variable 1: Time of day (measure all sites at the same time to avoid diurnal temperature variation).
Variable 2: Weather conditions (e.g., cloud cover, wind — measure on a clear, calm day).
Also acceptable: Season, surface material type (if comparing same surface), height of measurement above ground.
[2]
Mark breakdown: 1 mark per valid controlled variable with brief justification.
(c) Vegetation cover: Use a quadrat sampling method with a grid frame (e.g., 1 m × 1 m quadrat divided into 100 squares) to estimate percentage cover at each site.
Or: Canopy densiometer / hemispherical photography / NDVI from satellite/drone.
Surface temperature: Use an infrared thermometer / thermal imaging camera / digital temperature probe placed on the ground surface.
[2]
Mark breakdown: 1 mark for valid vegetation cover method, 1 mark for valid surface temperature method.
End of Answer Key
Total: 50 marks
Free quiz and exam paper access
Enter your details to view this paper
Your access is remembered on this device.