AI Generated Exam Paper
Secondary 1 Geography Practice Paper 3
Free Sec 1 Geography Practice Paper 3, Kimi2.6 AI version, with questions, answers, and syllabus-aligned practice for Singapore students.
These static practice materials are generated from the site's syllabus and paper-generation workflow, with source and model context shown so students and parents can evaluate the material before use.
Questions
TuitionGoWhere Practice Paper - Geography Secondary 1
TuitionGoWhere Practice Paper (AI)
| Subject: | Geography |
| Level: | Secondary 1 (G2/G3) |
| Paper: | Practice Paper — Version 3 of 5 |
| Duration: | 1 hour 15 minutes |
| Total Marks: | 60 |
| Name: | _________________________ |
| Class: | _________________________ |
| Date: | _________________________ |
INSTRUCTIONS
- Write your name, class, and date in the spaces provided above.
- This paper consists of THREE sections: Section A, Section B, and Section C.
- Answer ALL questions in the spaces provided.
- For questions requiring calculations, show all working clearly.
- Use diagrams, maps, and data provided to answer the questions where instructed.
- If a question requires a map, graph, or diagram, refer to the images provided with the paper.
- Write your answers in dark blue or black pen. You may use pencil for diagrams and graphs.
SECTION A: Map Skills and Direction
[20 marks]
Suggested time: 25 minutes
Answer all questions in this section. Refer to the Orchid Island Topographic Map where indicated.
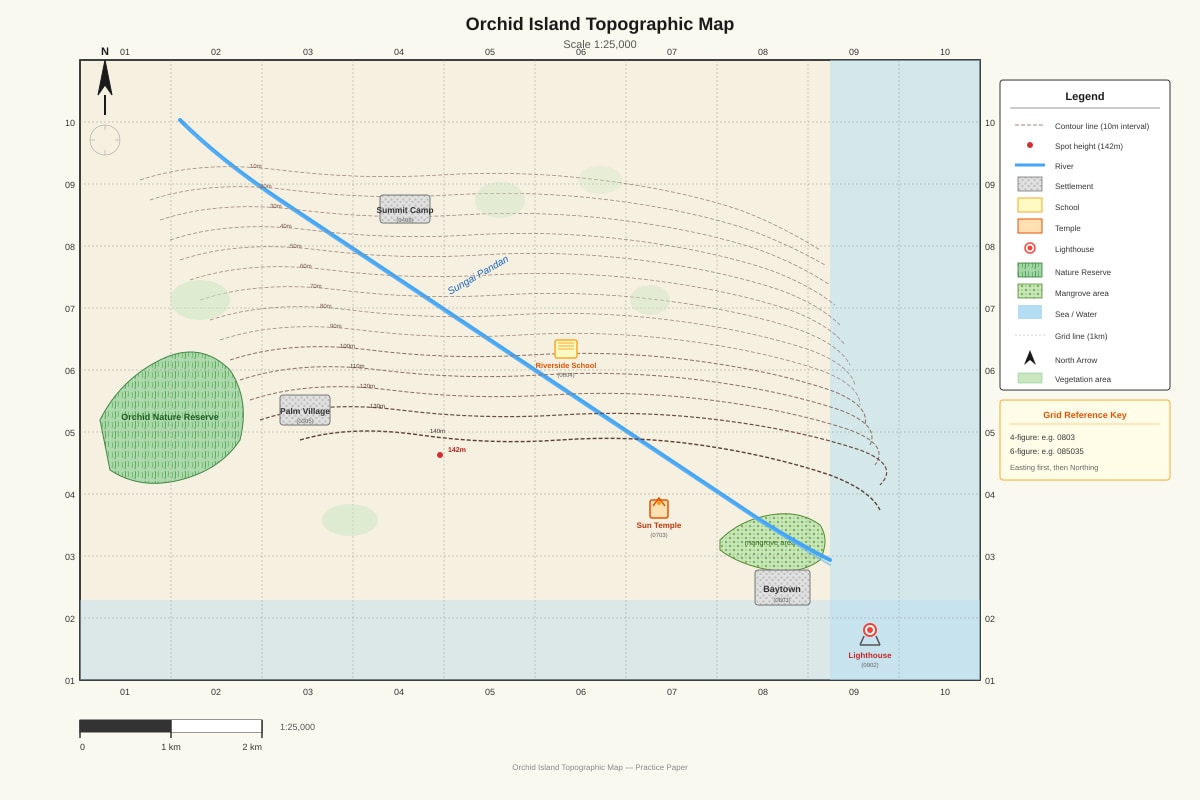
Generated map for Q1-5.
1. Using the Orchid Island map, state the 4-figure grid reference where Baytown is located.
_______________________________ [1]
2. State the 6-figure grid reference of the Lighthouse at the southern tip of Orchid Island.
_______________________________ [1]
3. What is the straight-line distance in kilometres from Baytown to Palm Village? Use the scale provided on the map.
_______________________________ km [2]
Working:
4. In which general direction is Summit Camp from Sun Temple? Use the eight-point compass.
_______________________________ [1]
5. (a) State the relief feature shown by the closely spaced contour lines in grid square 0604.
_______________________________ [1]
(b) Explain one way you can tell this relief feature is steep rather than gentle.
_______________________________________________________________ [1]
SECTION B: Graph and Data Interpretation
[24 marks]
Suggested time: 30 minutes
Answer all questions in this section. Refer to the climate data and graphs provided.
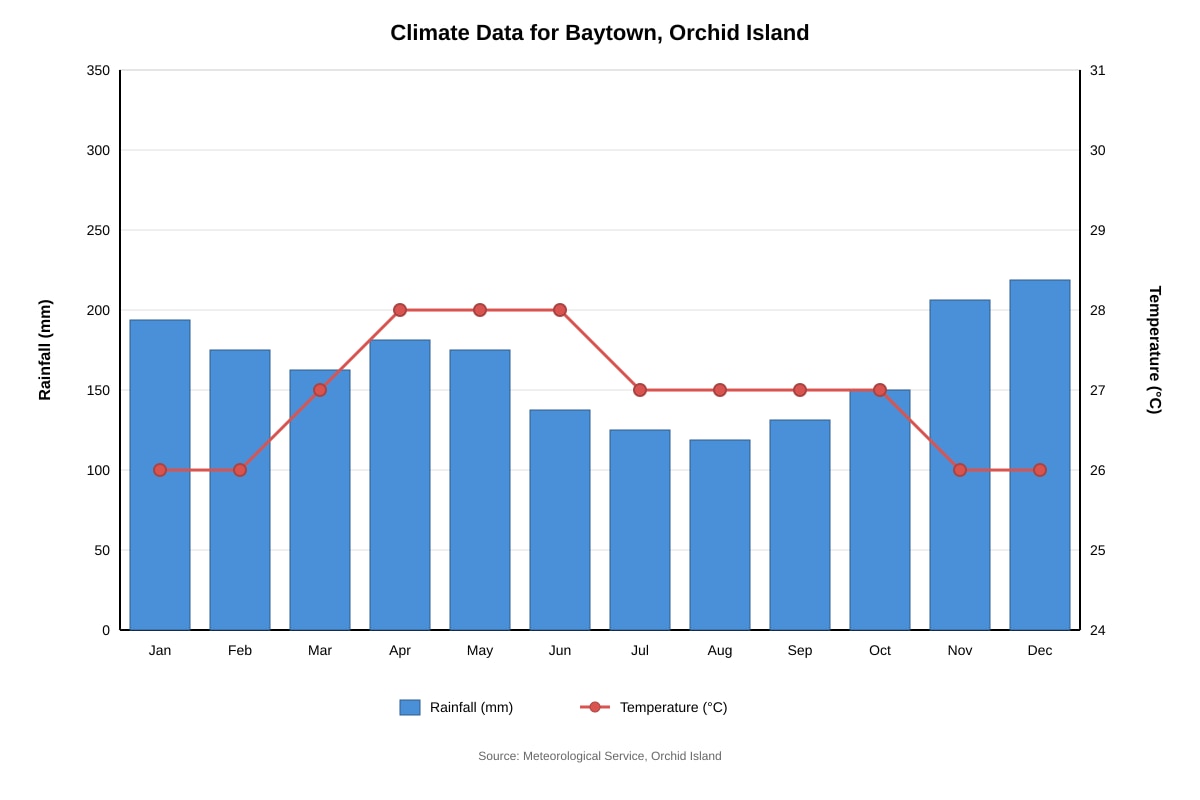
Generated graph for Q6-9.
6. Using the climate graph, which month has the highest average rainfall?
_______________________________ [1]
7. Calculate the total annual rainfall for Baytown. Show your working.
_______________________________ mm [2]
Working:
8. (a) Describe the pattern of temperature throughout the year at Baytown.
_______________________________________________________________ [2]
(b) Suggest one reason why this temperature pattern occurs.
_______________________________________________________________ [1]
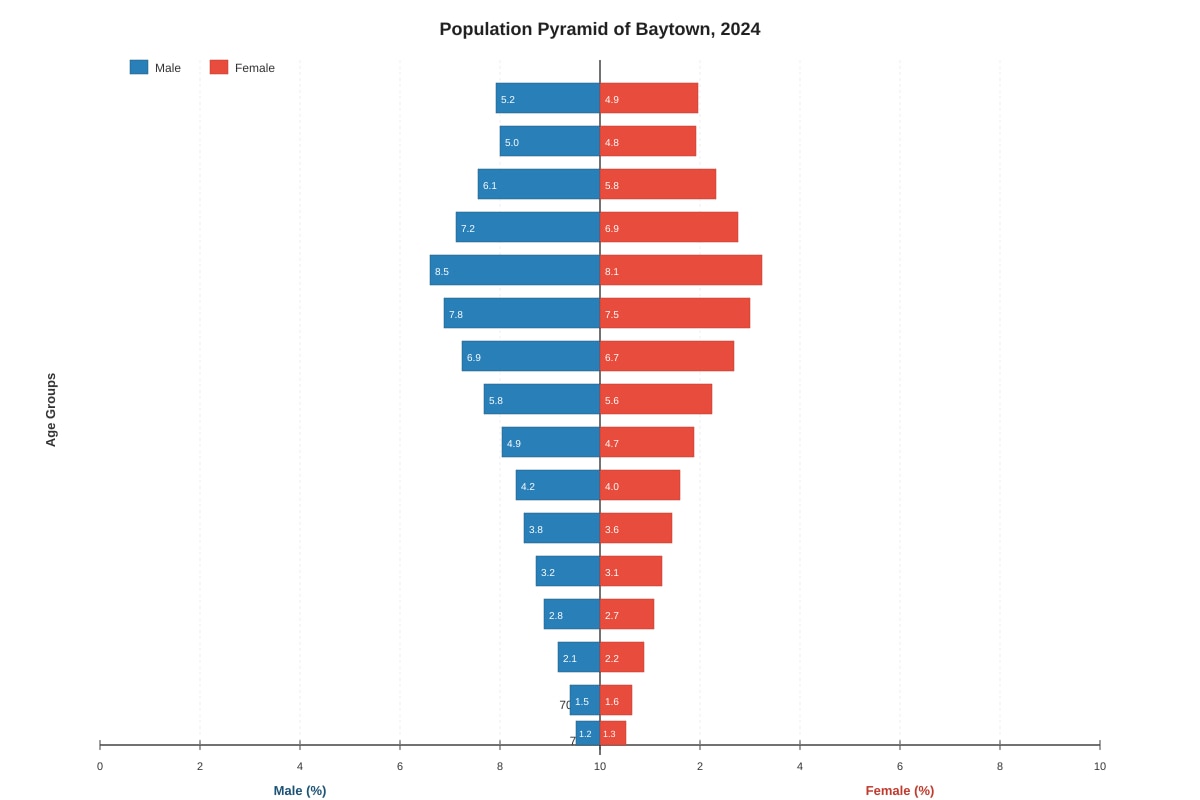
Generated graph for Q9-11.
9. What is the percentage of males aged 20-24 in Baytown's population?
_______________________________ [1]
10. Compare the shape of the pyramid for the younger age groups (0-19) with the older age groups (60+). What difference do you observe?
_______________________________________________________________ [2]
11. A student concludes: "Baytown has a young and growing population." Using evidence from the pyramid, state whether you agree or disagree. Explain your answer.
_______________________________________________________________ [2]
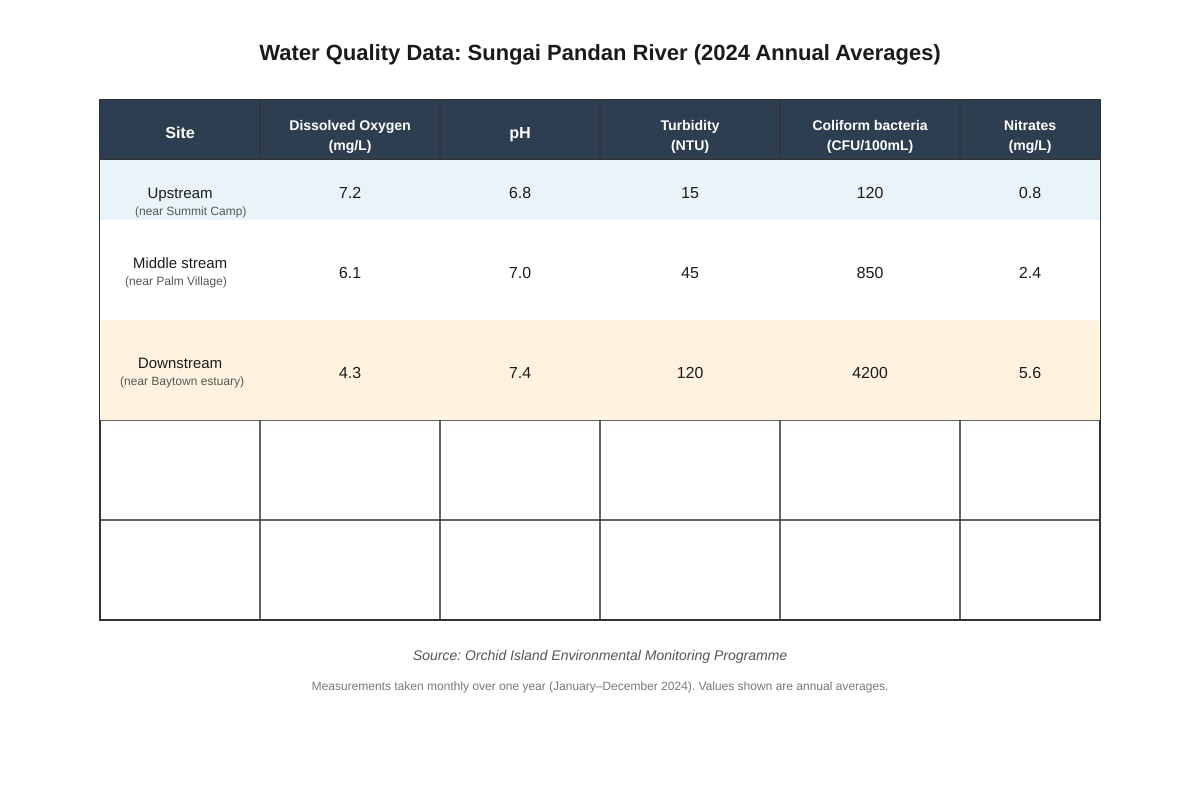
Generated table for Q12-14.
12. At which site is the water most polluted? Give two reasons for your answer using data from the table.
Site: _______________________________ [1]
Reason 1: _______________________________________________________________ [1]
Reason 2: _______________________________________________________________ [1]
13. Explain why dissolved oxygen levels decrease as you move downstream from Summit Camp to Baytown.
_______________________________________________________________ [2]
14. Suggest one human activity at or near Palm Village that could explain the increase in nitrate levels between the upstream and middle stream sites.
_______________________________________________________________ [1]
SECTION C: Source-Based and Applied Skills
[16 marks]
Suggested time: 20 minutes
Answer all questions in this section. Refer to the photograph and text source provided.
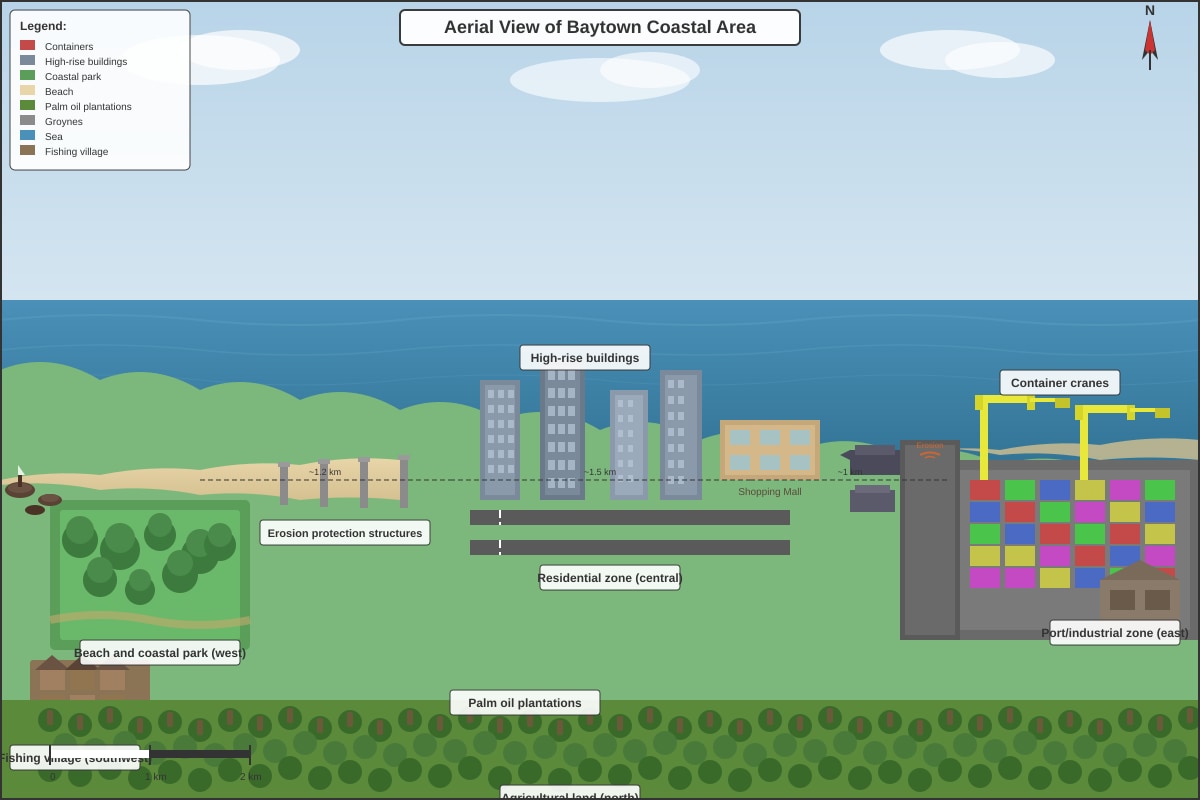
Generated source_image for Q15-18.
15. Study the aerial photograph of Baytown's coastal area.
(a) Identify two different land uses shown in the photograph.
Land use 1: _______________________________ [1]
Land use 2: _______________________________ [1]
(b) Suggest one reason why the industrial zone was located on the eastern side of the coast.
_______________________________________________________________ [1]
16. (a) Describe one evidence of coastal erosion shown in the photograph.
_______________________________________________________________ [1]
(b) Explain one way the coastal park and vegetation help to reduce coastal erosion.
_______________________________________________________________ [2]
17. Read the following source:
Source A: Baytown Development Plan 2024
The Baytown council plans to expand the port facilities eastward to increase cargo capacity. This will require reclaiming 200 hectares of coastal land. Environmental groups oppose the plan, arguing that mangrove forests in the area provide natural protection against storm surges and support fish breeding grounds that local fishing villages depend upon.
(a) State one economic benefit of the port expansion mentioned or implied in Source A.
_______________________________________________________________ [1]
(b) State one environmental cost of the port expansion mentioned in Source A.
_______________________________________________________________ [1]
18. As a geographer, you are asked to advise the Baytown council. Using information from both the photograph (Figure 5) and Source A, suggest one sustainable compromise that could address both economic development and environmental protection. Explain how your suggestion meets both needs.
_______________________________________________________________ [2]
END OF PAPER
Check your work before handing in your answers.
TOTAL MARKS: 60
Answers
TuitionGoWhere Practice Paper Answer Key - Geography Secondary 1
Version 3 of 5 — Map Graph Data Skills
| Subject: | Geography |
| Level: | Secondary 1 |
| Paper: | Practice Paper |
| Total Marks: | 60 |
| Duration: | 1 hour 15 minutes |
SECTION A: Map Skills and Direction [20 marks]
1. State the 4-figure grid reference where Baytown is located.
Answer: 0910 (accept 0910 ±1 in either direction if map proportions vary; exact answer based on described map layout where Baytown is in northeast corner at easting 09, northing 10)
Marking: [1] — Correct 4-figure grid reference.
Teaching note: A 4-figure grid reference identifies a 1km × 1km grid square. Always read the eastings (horizontal numbers, left to right) first, then the northings (vertical numbers, bottom to top). The reference uses the bottom-left corner of the square containing the feature. Common error: reversing eastings and northings (would give 1009, which is wrong).
2. State the 6-figure grid reference of the Lighthouse at the southern tip of Orchid Island.
Answer: 095084 (accept reasonable variation based on precise positioning; likely approximately 095084 where easting is 09 with 5 tenths, northing is 08 with 4 tenths)
Marking: [1] — Correct 6-figure grid reference.
Teaching note: A 6-figure grid reference pinpoints a location to within 100m × 100m. It works the same way as 4-figure: eastings first, then northings, but with an extra digit for each to estimate tenths of a grid square. Imagine each grid square divided into 10 equal parts. The lighthouse at the southern tip would be easting 09 and approximately 5 tenths across, northing 08 and approximately 4 tenths up.
3. What is the straight-line distance in kilometres from Baytown to Palm Village?
Answer: 4.0 km (accept 3.8–4.2 km depending on precise measurement; answer based on described scale 1:25,000 where measured map distance should be approximately 16cm = 4km)
Marking: [2] — Correct answer with working [2]; correct method but wrong answer [1]; no working [0]
Working:
- Map scale: 1:25,000 means 1 cm on map = 25,000 cm on ground = 0.25 km
- Measure straight-line distance on map between Baytown and Palm Village: approximately 16 cm
- Ground distance = 16 cm × 0.25 km/cm = 4.0 km
Alternative method using grid squares:
- Count grid squares between them: approximately 4 squares diagonally, or using Pythagoras if aligned: roughly 4 eastings and 2 northings apart = √(4² + 2²) = √20 ≈ 4.5 squares, but direct measurement preferred
Teaching note: For straight-line distance, use a ruler to measure directly on the map. Never guess by eye. Convert using the scale: at 1:25,000, divide measured cm by 4 to get km (since 4 cm = 1 km). Common error: forgetting to convert from cm to km, or measuring the winding route instead of straight-line.
4. In which general direction is Summit Camp from Sun Temple?
Answer: Northwest (or NW)
Marking: [1] — Correct direction using eight-point compass.
Teaching note: The eight-point compass uses: North (N), Northeast (NE), East (E), Southeast (SE), South (S), Southwest (SW), West (W), Northwest (NW). Stand at Sun Temple (southeast of island) and face Summit Camp (north, highest point). The direction is roughly halfway between North and West = Northwest. Common error: saying "North" only (not precise enough) or confusing "from" with "to" (would give Southeast, which is wrong—always draw a line from the starting point to the destination).
5. (a) State the relief feature shown by the closely spaced contour lines in grid square 0604.
Answer: Steep hill / steep slope / escarpment / ridge with steep sides
Marking: [1] — Correct identification of steep relief feature.
(b) Explain one way you can tell this relief feature is steep rather than gentle.
Answer: The contour lines are close together / tightly packed / crowded.
Marking: [1] — Correct explanation referencing contour spacing.
Teaching note: Contour lines join points of equal height. Where they are close together, the land rises quickly over a short horizontal distance = steep slope. Where they are far apart, the land rises slowly = gentle slope. This is the most fundamental rule of reading contour patterns. In grid square 0604 (northwest area near Summit Camp), the closeness of contour lines indicates steep terrain leading up to the summit. Never say "the lines are small" or "the numbers are close"—the spacing of the lines is what matters.
SECTION B: Graph and Data Interpretation [24 marks]
6. Using the climate graph, which month has the highest average rainfall?
Answer: December
Marking: [1] — Correct month identified.
Teaching note: Read the blue bars for rainfall. The tallest bar corresponds to December at 350mm. Compare carefully: November is close at 330mm, but December is clearly highest. Common error: picking November because it looks similar, or confusing with temperature line.
7. Calculate the total annual rainfall for Baytown. Show your working.
Answer: 3,160 mm
Marking: [2] — Correct answer with working [2]; correct method with addition error [1]; answer only [1]
Working: Jan: 310 + Feb: 280 + Mar: 260 + Apr: 290 + May: 280 + Jun: 220 = 1,640 (first six months) Jul: 200 + Aug: 190 + Sep: 210 + Oct: 240 + Nov: 330 + Dec: 350 = 1,520 (second six months) Total = 1,640 + 1,520 = 3,160 mm
Alternative grouping for easier addition: (310 + 280 + 260 + 290 + 280) + (220 + 200 + 190 + 210 + 240) + (330 + 350) = 1,420 + 1,060 + 680 = 3,160 mm
Teaching note: Always show your addition method. You can group months to make mental arithmetic easier. Check your answer is reasonable: this is a tropical climate with high rainfall, so figures over 3,000mm are expected. Common error: arithmetic mistakes in long addition, or missing months. Always count that you have 12 values.
8. (a) Describe the pattern of temperature throughout the year at Baytown.
Answer: Any two from:
- Temperature is high throughout the year / consistently warm / little variation
- Temperature ranges from 26°C to 28°C (small range of only 2°C)
- Slightly warmer from April to June (28°C) and slightly cooler from January to February and November to December (26°C)
- More specifically: rises from January to April/May/June, then falls gradually to December
Marking: [2] — Two valid descriptive points.
Teaching note: "Pattern" means describing the overall trend, not just reading individual values. For this equatorial/tropical climate, the key pattern is consistent warmth with minimal seasonal variation. Quote the range to support your description. Avoid vague "it goes up and down"—identify when and by how much.
(b) Suggest one reason why this temperature pattern occurs.
Answer: Baytown is located near the Equator / in the tropics / at low latitude (accept: Singapore's location, or Orchid Island is near the equator)
Marking: [1] — Correct geographical reason.
Teaching note: Places near the Equator (0° latitude) receive direct, intense sunshine throughout the year because the sun's rays hit at a high angle. There's little variation in day length and sun angle, so temperatures stay consistently high. This is why Singapore and similar equatorial locations have temperatures around 26-32°C year-round. Common error: saying "it's hot because it's near the sea"—this affects climate moderation but doesn't explain the consistent warmth.
9. What is the percentage of males aged 20-24 in Baytown's population?
Answer: 8.5%
Marking: [1] — Correct percentage from pyramid.
Teaching note: Read the left side (male, blue bars) and find the age group 20-24. The value is clearly labelled as 8.5%. Be careful not to read the female side (8.1%) or the wrong age group. Population pyramids show the population structure by age and sex—wider bars at younger ages indicate a young population; bulges indicate past events.
10. Compare the shape of the pyramid for the younger age groups (0-19) with the older age groups (60+). What difference do you observe?
Answer: Any two valid comparisons:
- The younger age groups have wider bars / larger percentages / broader base than older age groups
- The older age groups have narrower bars / smaller percentages / taper toward the top
- The pyramid is wider at the bottom and narrower at the top (triangular shape)
- The young population is larger than the old population (specific: 0-4 is ~10.1% total, while 75+ is only ~2.5%)
Marking: [2] — Two valid descriptive points comparing young vs old.
Teaching note: A population pyramid's shape reveals population structure. Wide base = young population, high birth rates, high growth. Narrow top = fewer elderly, lower life expectancy or recent development (or in this case, simply a young, growing population). The described pyramid shows a classic expanding/young population shape with broad base tapering to narrow top.
11. A student concludes: "Baytown has a young and growing population." Using evidence from the pyramid, state whether you agree or disagree. Explain your answer.
Answer: Agree (must be stated clearly)
Explanation: Any two from:
- The base of the pyramid is wide: age groups 0-4 (10.1% combined male+female) and 5-9 (9.8%) are among the largest groups, indicating high birth rates
- The bars become progressively narrower with increasing age, showing more young people than old people
- The youthful age groups (0-19) together make up approximately 38% of the population, which is a large proportion
- There is a bulge in the young working-age groups (20-29) at approximately 16%, suggesting past high fertility
- A young population with wide base typically indicates future growth as these young people reach reproductive age
Marking: [2] — Agree stated [1]; two valid evidence points from pyramid data [1]
Teaching note: To evaluate a statement using data, you must state your position, then support with specific evidence. "Young and growing" requires evidence of: (1) large proportion of young people now, and (2) implication for future growth. The wide base is the key evidence. Common error: agreeing but only describing without explaining the "growing" part, or disagreeing (which contradicts the clear pyramid shape).
12. At which site is the water most polluted? Give two reasons for your answer using data from the table.
Answer: Site: Downstream (near Baytown estuary) [1]
Reason 1: Highest coliform bacteria count at 4,200 CFU/100mL (compared to 120 upstream and 850 middle stream) [1] Reason 2: Highest turbidity at 120 NTU (compared to 15 upstream and 45 middle stream) [1]
Alternative reasons:
- Lowest dissolved oxygen at 4.3 mg/L (compared to 7.2 upstream and 6.1 middle stream) indicates oxygen depletion from organic pollution
- Highest nitrates at 5.6 mg/L (compared to 0.8 upstream and 2.4 middle stream) indicates fertilizer/detergent runoff
Marking: [3] — Correct site [1]; each valid data-supported reason [1] each
Teaching note: "Most polluted" requires judgment using multiple indicators. Coliform bacteria indicate faecal contamination (sewage), turbidity indicates suspended solids (soil erosion, runoff), and low dissolved oxygen indicates organic pollution (decomposing waste). The downstream site is worst on all measures. Always quote specific data values with units to support your answer. Common error: saying "the water is dirty" without citing data, or confusing cause and effect.
13. Explain why dissolved oxygen levels decrease as you move downstream from Summit Camp to Baytown.
Answer: Any two from:
- More organic waste/pollutants enter the river downstream from human activities (sewage, agriculture, industry), which decomposers break down using oxygen
- Higher turbidity downstream (120 NTU) reduces light penetration, so aquatic plants photosynthesize less, producing less oxygen
- Higher temperatures in built-up areas (urban heat island) may reduce oxygen solubility in water (warm water holds less dissolved oxygen)
- Slower-moving water downstream allows more sedimentation and reduces aeration from turbulence
Marking: [2] — Two valid linked explanations.
Teaching note: Dissolved oxygen (DO) is vital for aquatic life. It decreases downstream because: (1) pollution adds organic matter that bacteria decompose, consuming oxygen in the process (BOD — biological oxygen demand); and (2) reduced light penetration limits photosynthesis by water plants. Always link the cause to the effect: "more waste → more decomposition → more oxygen used → lower DO." Common error: simply stating "there is more pollution" without explaining the oxygen connection.
14. Suggest one human activity at or near Palm Village that could explain the increase in nitrate levels between the upstream and middle stream sites.
Answer: Any one from:
- Agriculture/farming using fertilizers (nitrogen-based fertilizers leach into river)
- Livestock farming where animal waste runs into the river
- Sewage discharge from Palm Village (untreated or partially treated)
- Use of detergents / household waste water entering the river
Marking: [1] — Valid human activity linked to nitrate increase.
Teaching note: Nitrates in water typically come from agricultural fertilizers (large source in rural areas), animal waste, or sewage. Palm Village is described as central-west, likely with mixed land use. The increase from 0.8 to 2.4 mg/L is significant but not extreme, suggesting moderate human impact. In geography, always connect the activity to the pollutant: fertilizers contain nitrogen compounds → rain washes these into river → nitrate levels rise. Common error: saying "factory pollution" — factories more typically cause heavy metal or chemical pollution, not nitrates.
SECTION C: Source-Based and Applied Skills [16 marks]
15. (a) Identify two different land uses shown in the photograph.
Answer: Any two from:
- Industrial / port / cargo / shipping (east, with cranes and containers)
- Residential / housing / high-rise apartments (central)
- Commercial / retail / shopping (central, with mall)
- Recreation / tourism / beach / coastal park (west)
- Agriculture / plantation / palm oil (north/background)
- Fishing / traditional / village (southwest, small boats)
Marking: [2] — Two valid and different land uses [1] each.
(b) Suggest one reason why the industrial zone was located on the eastern side of the coast.
Answer: Any one from:
- Deep water for large cargo ships / access for shipping
- Sheltered from prevailing winds (if applicable to location)
- Away from residential areas to reduce pollution impact on housing
- Flat land for construction of port facilities
- Existing transport connections / road access
- Less environmentally sensitive than western side (which has beach/park)
Marking: [1] — Valid reason with geographical logic.
Teaching note: Industrial/port location decisions consider: physical factors (deep water, flat land, shelter) and human factors (access, labour, planning restrictions, environmental sensitivity). The photograph shows industry concentrated on one side with residential on another—this is zoning in urban planning. Common error: "because it's near the sea" — be more specific about why the sea matters for a port (deep water for ships, not just proximity).
16. (a) Describe one evidence of coastal erosion shown in the photograph.
Answer: Any one from:
- Narrower beach on the eastern side near industrial zone compared to western side
- Groynes / coastal protection structures visible, indicating erosion problem that needed addressing
- Steepened beach profile or exposed rock / reduced sand
Marking: [1] — Valid evidence described from photograph.
(b) Explain one way the coastal park and vegetation help to reduce coastal erosion.
Answer: Any two linked points from:
- Plant roots bind/stabilize sand/soil, preventing it from being washed away by waves
- Vegetation absorbs wave energy / acts as a buffer, reducing the force of waves hitting the coast
- Traps sand carried by longshore drift, building up the beach rather than losing sediment
Marking: [2] — Two linked explanatory points [1] each; or one well-developed explanation [2]
Teaching note: Coastal vegetation (mangroves, beach grasses, trees) provides natural coastal protection through: (1) root systems binding sediment (physical stabilization), and (2) above-ground biomass absorbing wave energy (energy dissipation). This is nature-based solution to coastal erosion, increasingly preferred to hard engineering. The groynes visible in the photo are hard engineering—students should contrast this. Common error: saying "plants stop waves" without explaining the mechanism.
17. (a) State one economic benefit of the port expansion mentioned or implied in Source A.
Answer: Increased cargo capacity / more trade / more jobs / economic growth / increased revenue for Baytown
Marking: [1] — Valid economic benefit.
(b) State one environmental cost of the port expansion mentioned in Source A.
Answer: Loss of mangrove forests / destruction of fish breeding grounds / damage to natural storm protection / harm to fishing villages' livelihoods
Marking: [1] — Valid environmental cost from source.
Teaching note: Source A presents a classic environmental conflict: economic development vs. environmental protection. The economic benefit is implied ("increase cargo capacity" → more business, jobs, tax revenue). The environmental cost is explicit (mangrove loss). In source-based questions, distinguish stated from implied — both are valid if logically supported.
18. As a geographer, you are asked to advise the Baytown council. Using information from both the photograph (Figure 5) and Source A, suggest one sustainable compromise that could address both economic development and environmental protection. Explain how your suggestion meets both needs.
Answer: Any valid sustainable compromise with dual explanation:
Suggested compromise: Expand the port only on already degraded industrial land and create a protected mangrove buffer zone / restore mangroves elsewhere
Or: Build offshore port facilities rather than coastal reclamation
Or: Phase the expansion with environmental monitoring and mitigation
Or: Relocate fishing village with compensation and create artificial fish breeding reefs
How it meets both needs: [must include both sides for full marks]
Example developed answer: "Build the port expansion inland from the existing industrial zone rather than reclaiming mangrove areas (photograph shows industrial land already concentrated on east). Set aside and protect the remaining mangroves as a green buffer with controlled ecotourism access. This maintains cargo capacity growth while preserving storm protection and some fish habitats." [2]
Marking: [2] — Valid compromise suggestion [1]; clear explanation addressing both economic AND environmental needs [1]
Teaching note: Sustainable compromise requires genuine balance, not one side winning. The best answers: (1) use evidence from both sources (photo shows existing industrial concentration; Source A mentions mangroves specifically), and (2) show how both goals are partially met. Partial credit [1] for suggestion that only addresses one side, or vague "plant more trees" without connection to the specific scenario. Common error: simply saying "do both" without explaining the practical mechanism.
MARKING SUMMARY
| Section | Marks |
|---|---|
| Section A: Map Skills and Direction | 20 |
| Section B: Graph and Data Interpretation | 24 |
| Section C: Source-Based and Applied Skills | 16 |
| TOTAL | 60 |
END OF ANSWER KEY
Free quiz and exam paper access
Enter your details to view this paper
Your access is remembered on this device.