AI Generated Exam Paper
Secondary 1 Geography Practice Paper 3
Free Sec 1 Geography Practice Paper 3, HY3 AI version, with questions, answers, and syllabus-aligned practice for Singapore students.
These static practice materials are generated from the site's syllabus and paper-generation workflow, with source and model context shown so students and parents can evaluate the material before use.
Questions
TuitionGoWhere Practice Paper - Geography Secondary 1
TuitionGoWhere Practice Paper (AI) — Version 3
Subject: Geography
Level: Secondary 1
Paper: Practice Paper (Map Graph Data Skills)
Duration: 45 minutes
Total Marks: 40
Name: ______________________
Class: _______
Date: ___________
Instructions:
- This practice paper has 3 sections with 20 questions.
- Answer all questions in the spaces provided.
- Read each question carefully and use the figures, tables, and maps given.
- Marks for each question are shown in brackets [ ].
- Section marks and question marks add up to 40.
Section A: Map Reading (12 marks)
Questions 1 to 6
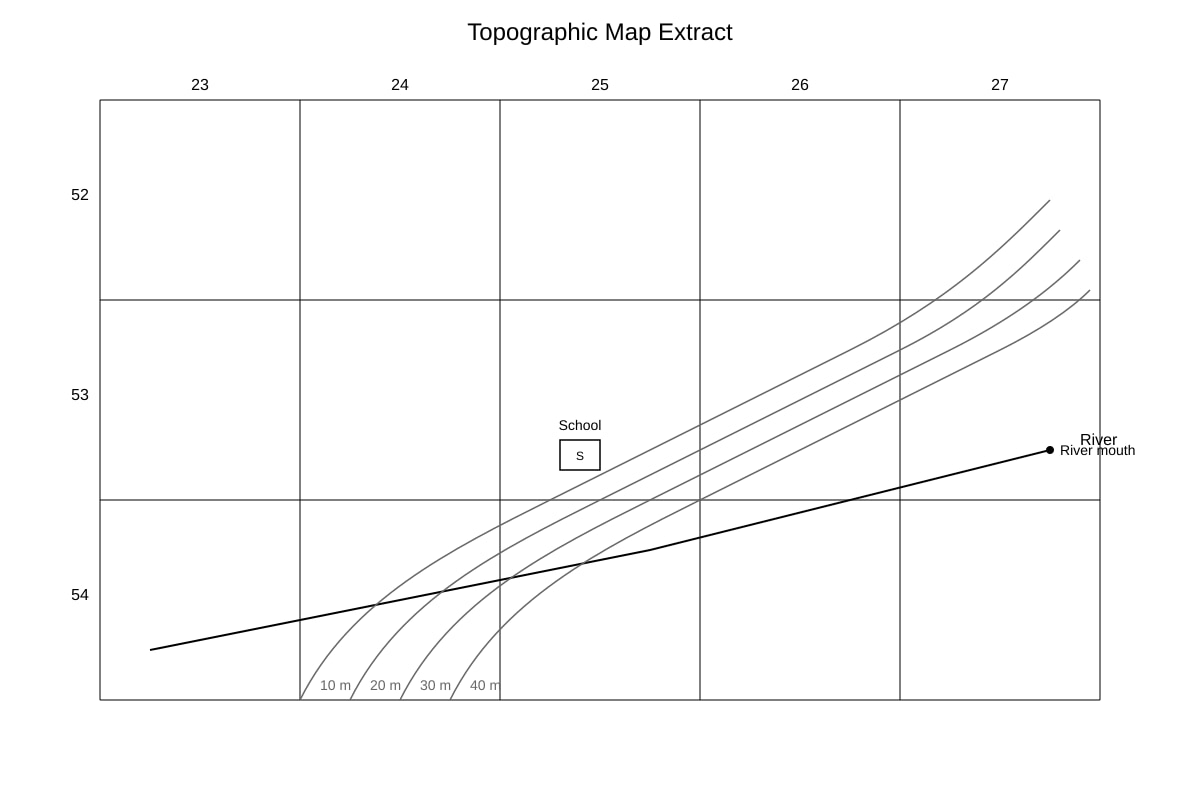
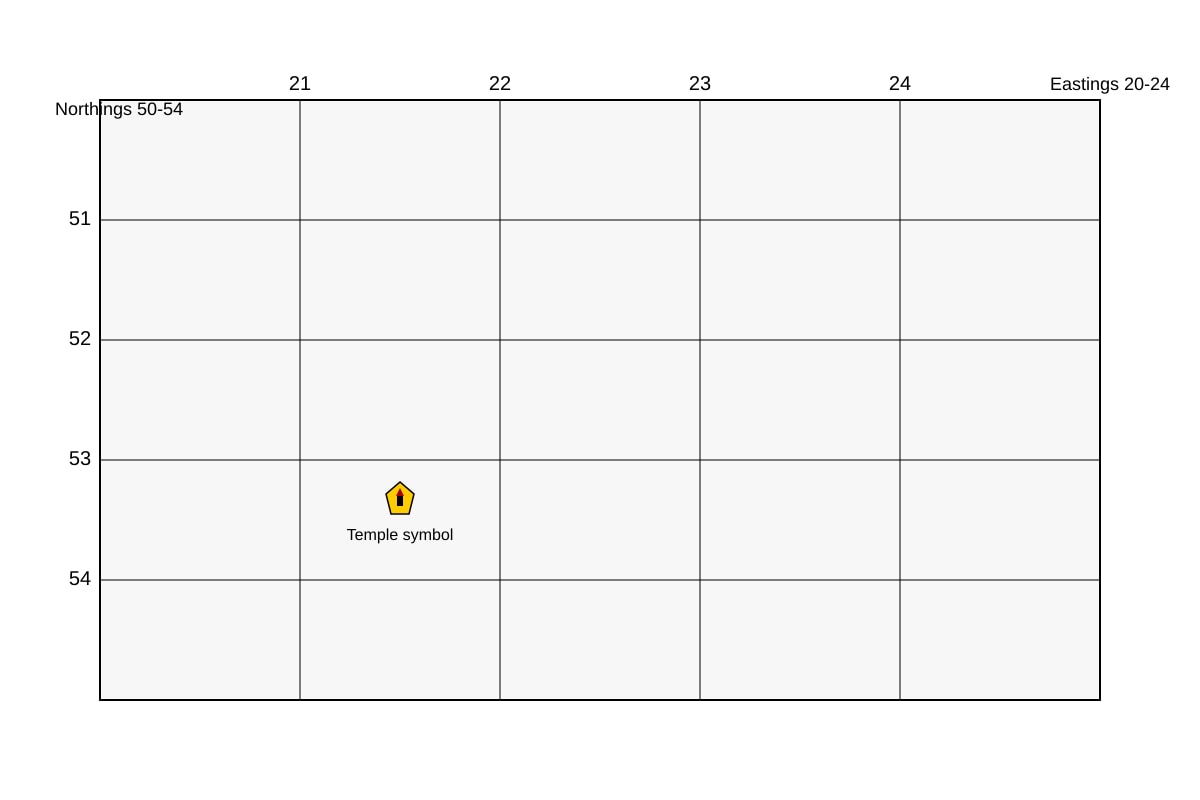
1. Study the map extract below. State the 4-figure grid reference of the temple. [1]
Image pending generation: map for Q1.
2. Using the same map extract above, state the 6-figure grid reference of the school shown near the centre of grid square 2353. [1]
3. State the contour interval of the map shown below. [1]
Image pending generation: map for Q3.
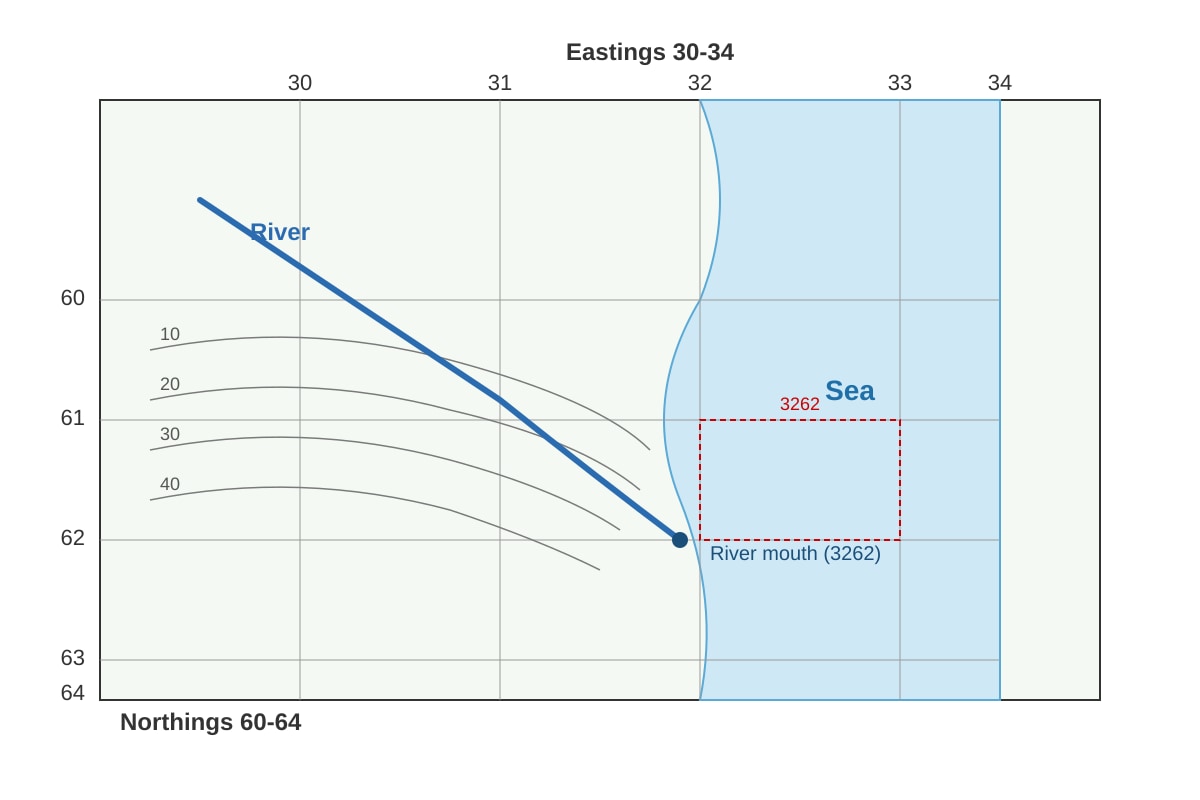
4. State the 4-figure grid reference of the river mouth shown on the map below. [1]
Image pending generation: map for Q4.
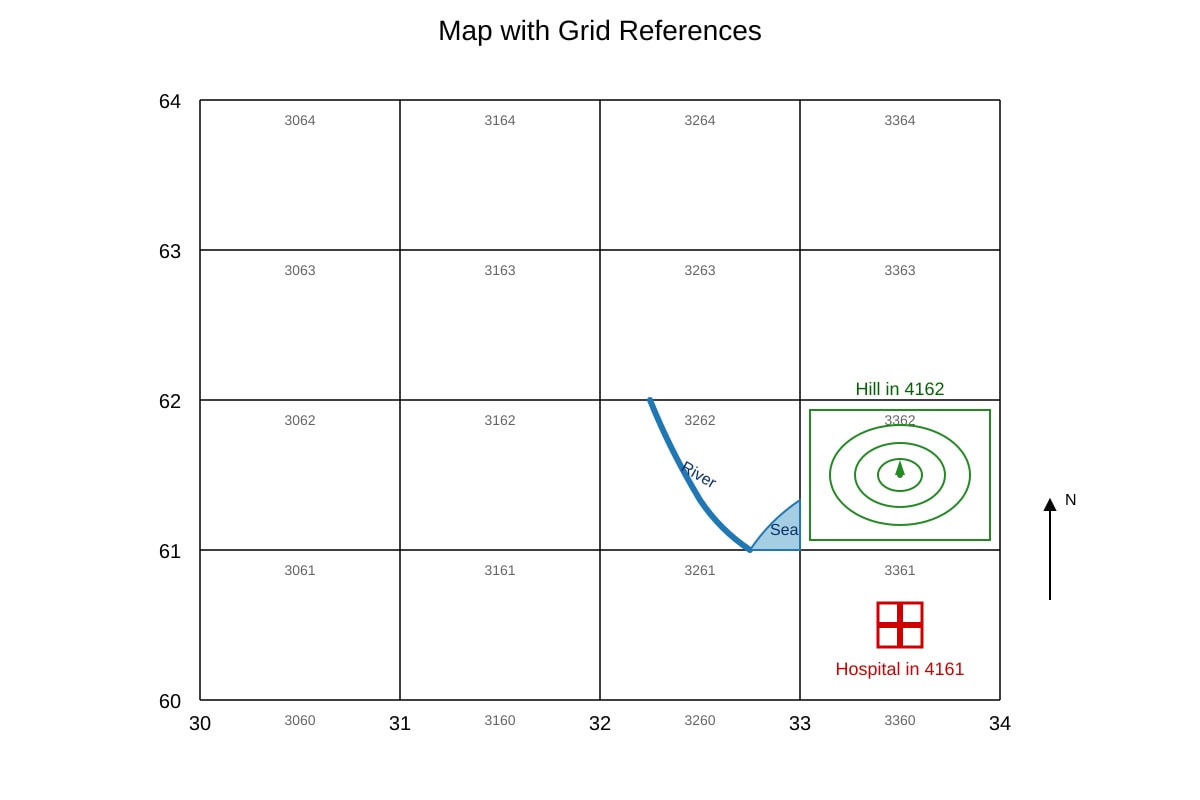
5. Give the 4-figure grid reference of the hospital that is south of the hill in grid square 4162. [1]
Image pending generation: map for Q5.
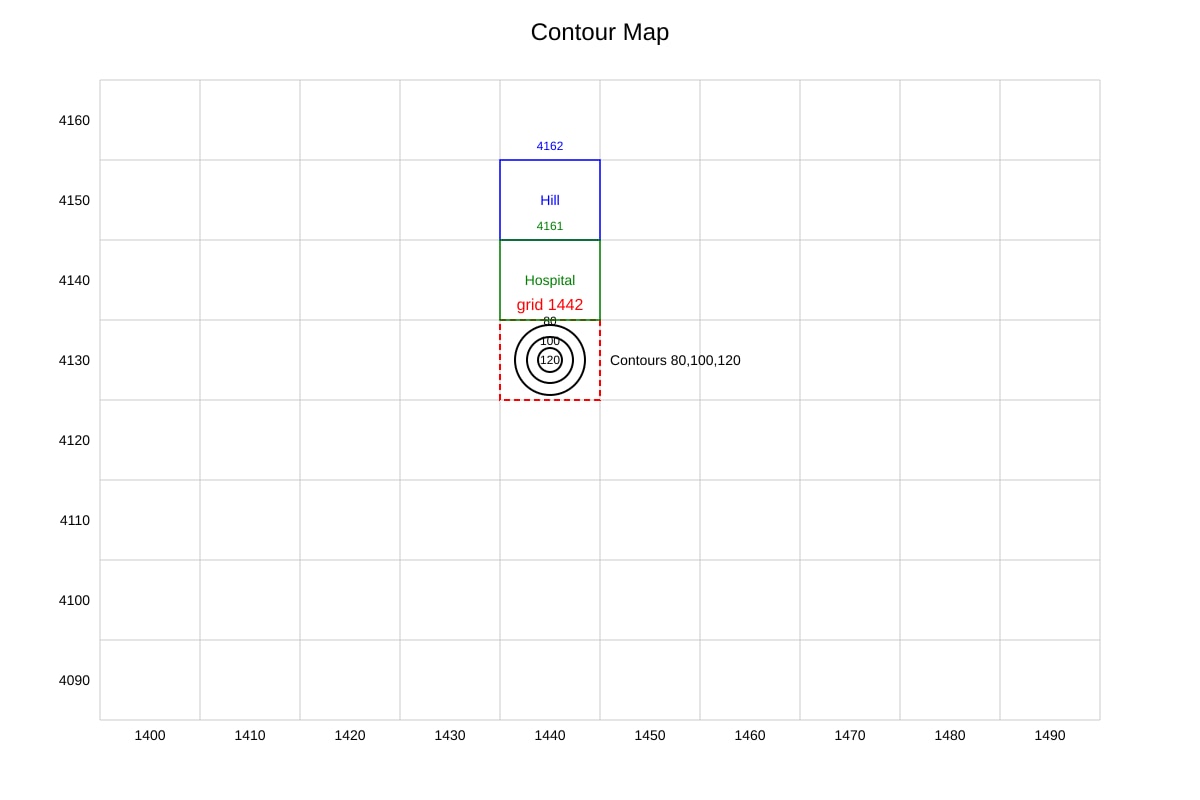
6. Study the contour map below. Describe the landform shown in grid square 1442. [2]
Image pending generation: map for Q6.
Section B: Graph and Data Interpretation (16 marks)
Questions 7 to 13
7. Study the table below showing rainfall in mm over 6 months.
| Month | Jan | Feb | Mar | Apr | May | Jun |
|---|---|---|---|---|---|---|
| Rain (mm) | 200 | 180 | 150 | 90 | 80 | 70 |
State the month with the highest rainfall. [1]
8. Using the table in Q7, calculate the total rainfall for the first three months. [2]
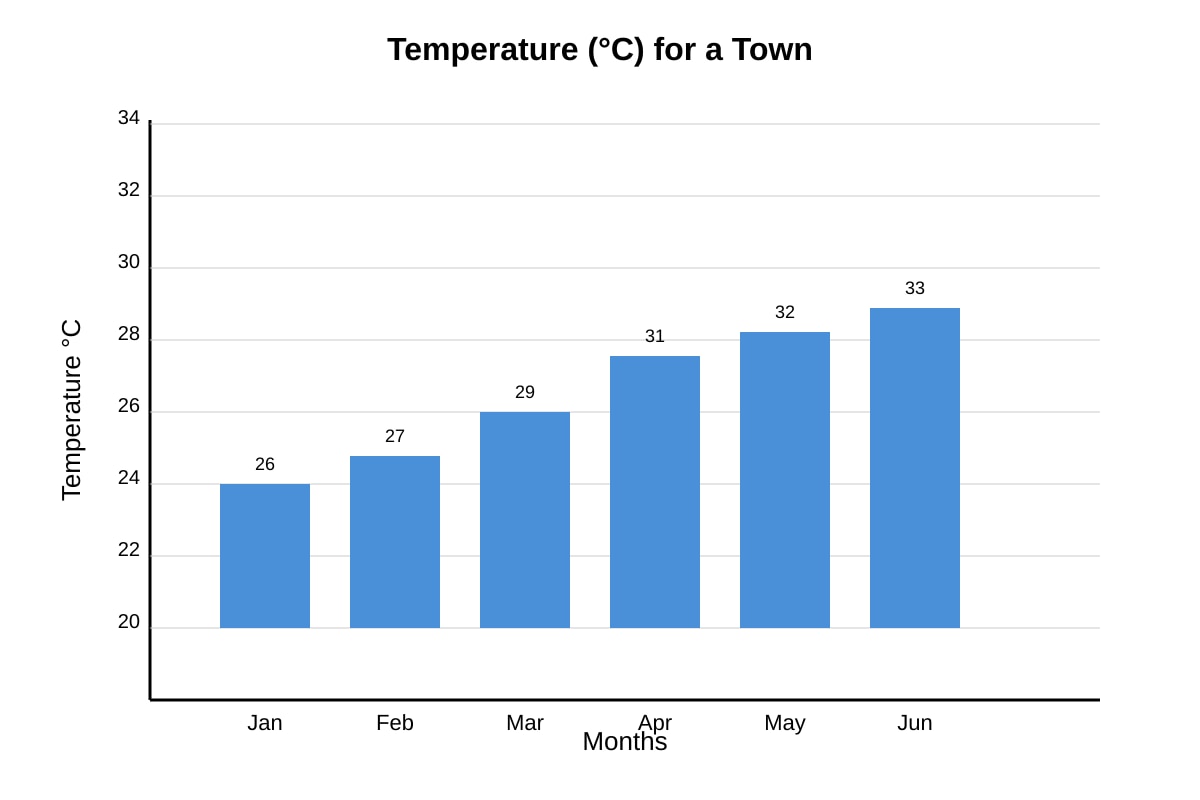
9. Study the bar graph below showing temperature (°C) for a town.
Image pending generation: graph for Q9.
State the temperature in April. [1]
10. Using the graph in Q9, describe the trend in temperature from Jan to Jun. [2]
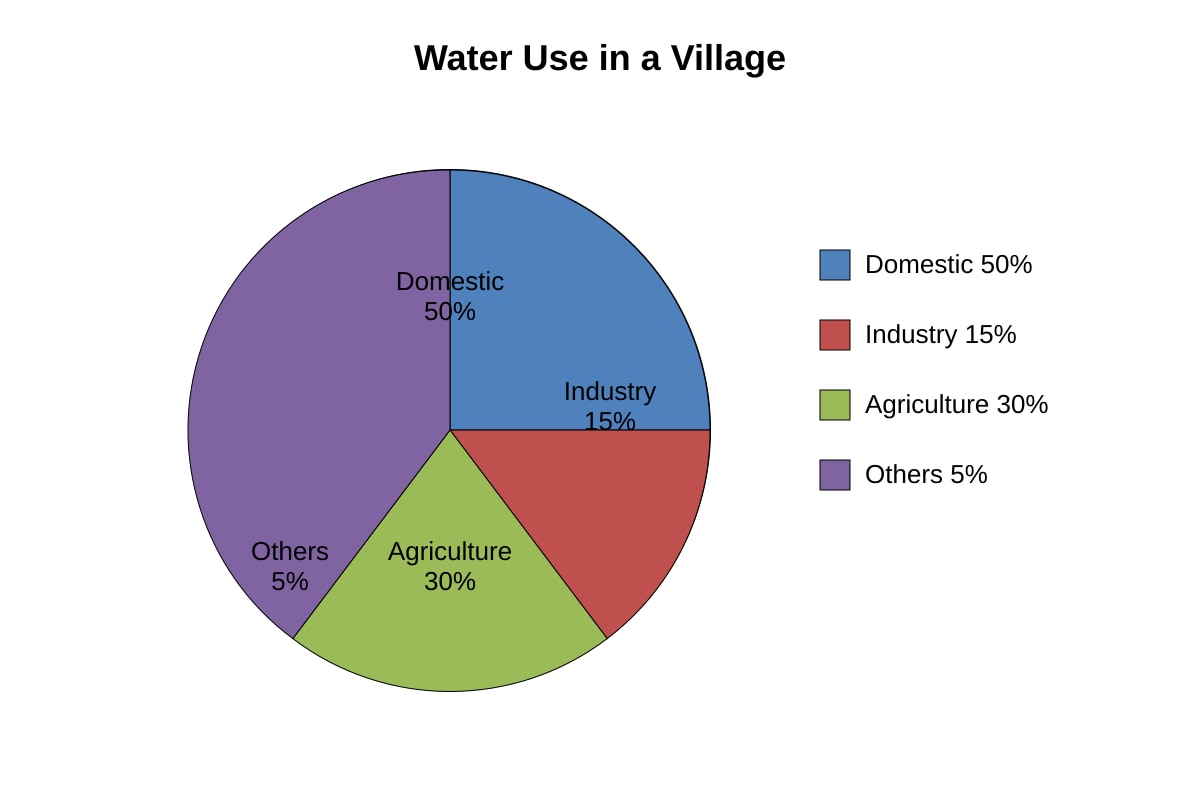
11. Study the pie chart below showing water use in a village.
Image pending generation: chart for Q11.
What percentage of water is used for agriculture? [1]
12. The table below shows population of a city (millions).
| Year | 2010 | 2015 | 2020 |
|---|---|---|---|
| Pop | 3.0 | 4.2 | 5.1 |
Using the table, describe the change in population from 2010 to 2020. [2]
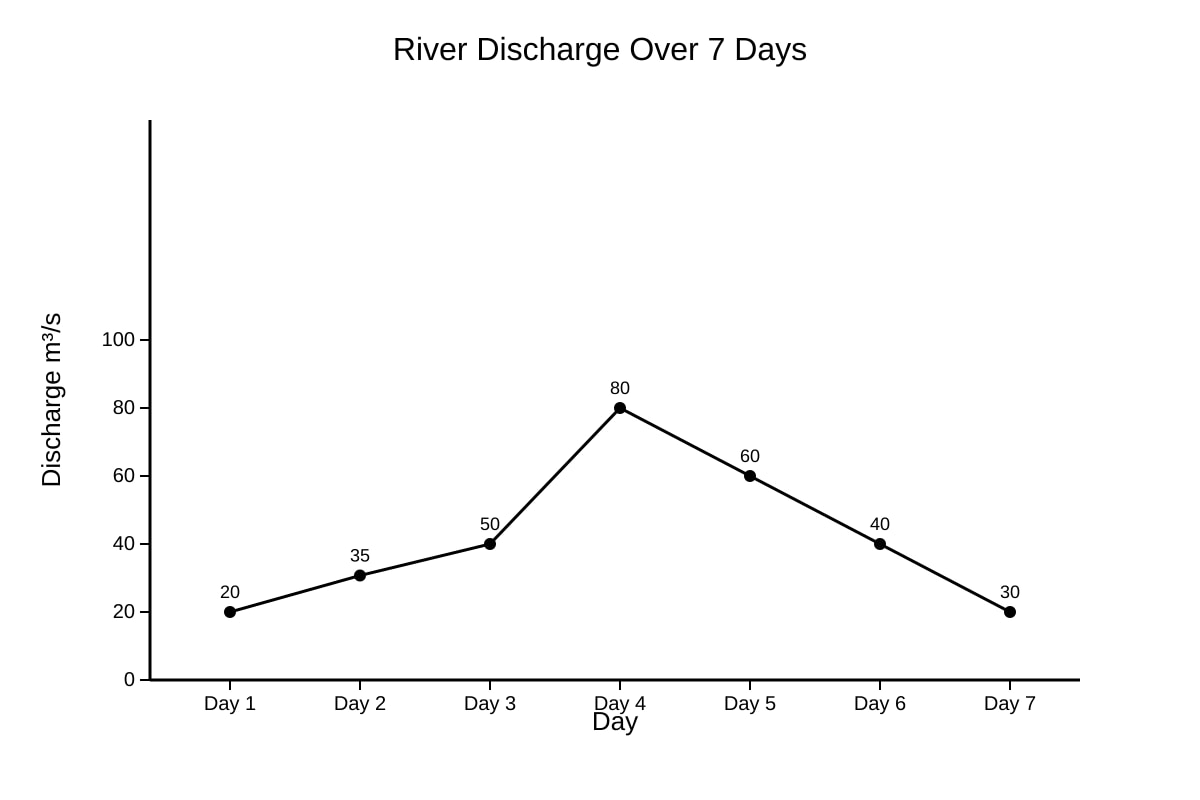
13. Study the line graph below of river discharge (m³/s).
Image pending generation: graph for Q13.
State the day with the highest discharge and its value. [2]
Section C: Integrated Data Skills (12 marks)
Questions 14 to 20
14. A class tested water quality at two sites. Table below:
| Site | Turbidity (NTU) | Dissolved O₂ (mg/L) |
|---|---|---|
| A | 2 | 8 |
| B | 10 | 4 |
Which site has better water quality? Give one reason from the table. [2]
15. Using the table in Q14, explain why Site B has lower dissolved oxygen. [2]
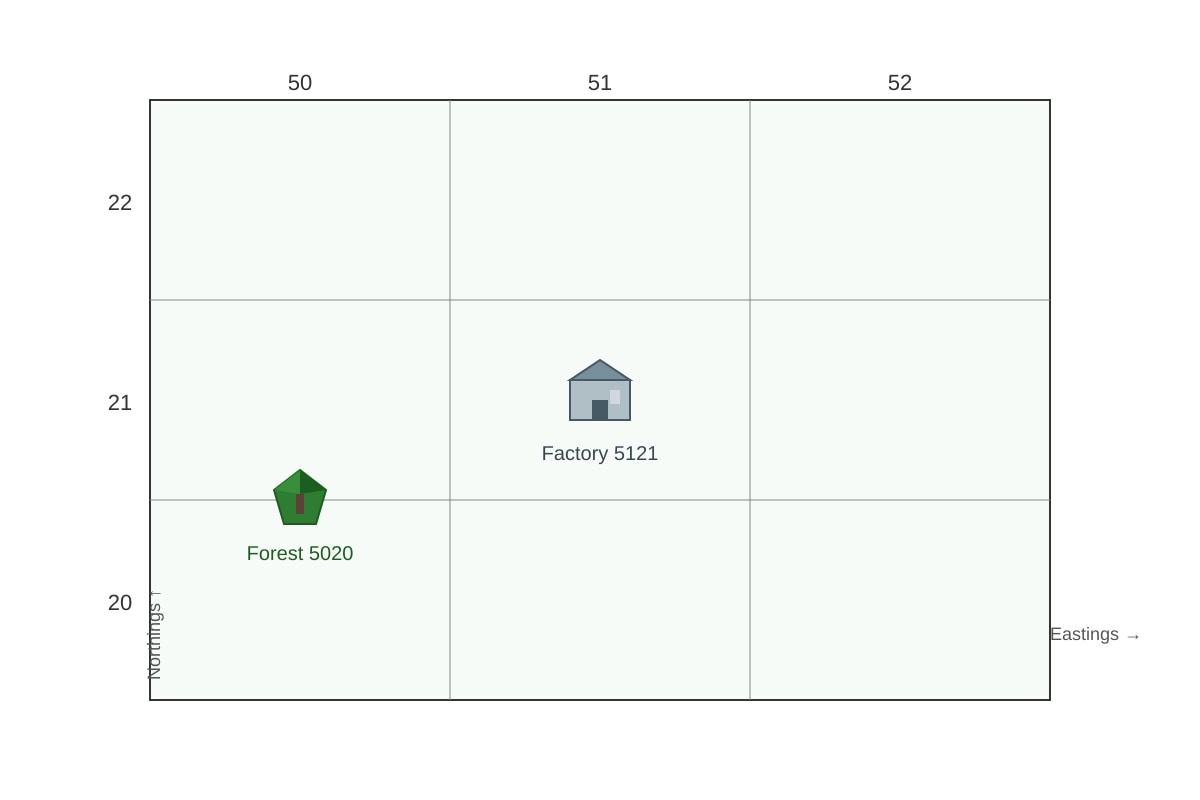
16. Study the map below with a forest (grid 5020) and factory (grid 5121).
Image pending generation: map for Q16.
State the 4-figure grid reference of the factory. [1]
17. Using the map in Q16, state the direction of the factory from the forest. [1]
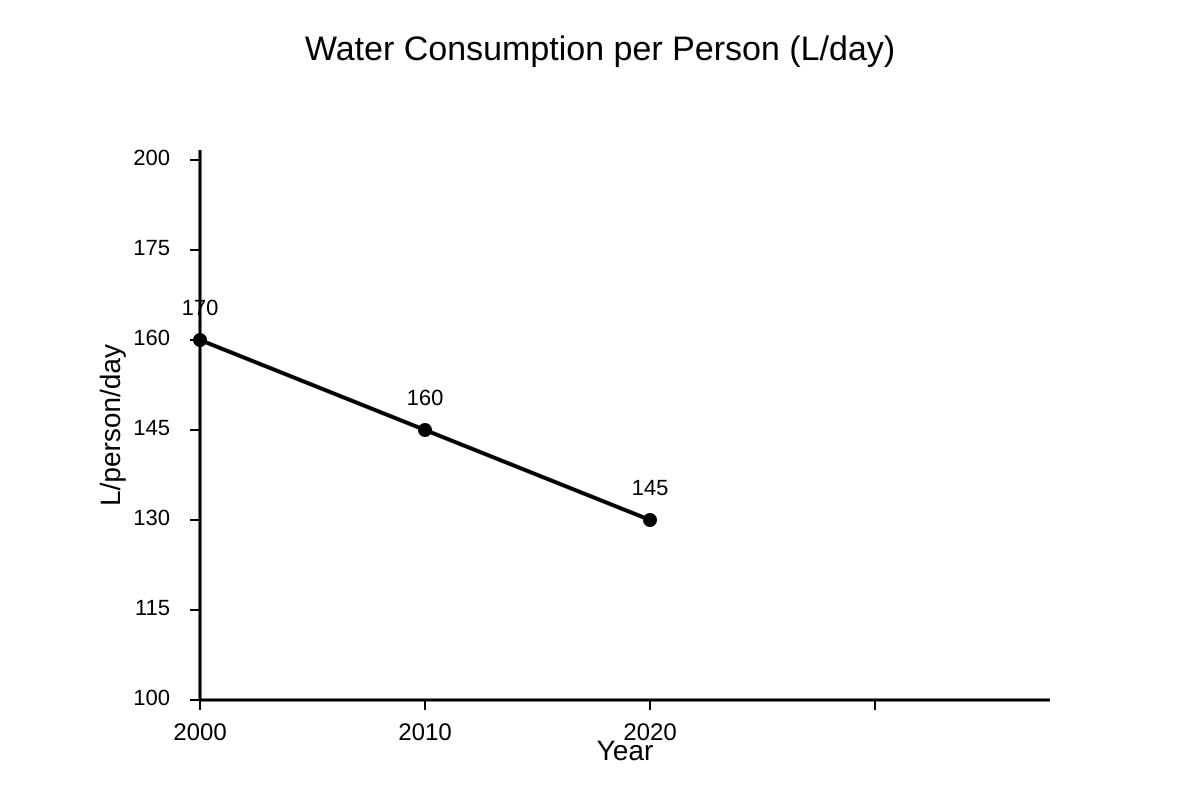
18. Study the graph below of water consumption per person (L/day).
Image pending generation: graph for Q18.
Describe the trend in water use from 2000 to 2020. [2]
19. Using the graph in Q18, calculate the decrease in water use from 2000 to 2020. [2]
20. A student says: "The forest in Q16 protects the factory from pollution." Using map and geography ideas, explain if this statement is sensible. [2]
Answers
TuitionGoWhere Practice Paper Answer Key — Geography Secondary 1 (Version 3)
Total Marks: 40
Section A: 12 marks
Section B: 16 marks
Section C: 12 marks
Section A: Map Reading
1. [1] 2252
Teaching note: Read easting (22) first, then northing (52). Grid reference uses lower-left corner of the square containing the temple. Common mistake: reversing to 5222.
2. [1] 235353 (or 235352 acceptable)
Teaching note: 4-figure is 2353. Divide square into 10×10; school near centre gives ~5 easting, ~3 northing → 235353. Accept small variation.
3. [1] 10 m
Teaching note: Contour interval = difference between adjacent labelled contours (20−10 = 10 m). Not map scale.
4. [1] 3262
Teaching note: River mouth is at sea in square 3262. Read easting 32, northing 62.
5. [1] 4161
Teaching note: Hospital south of hill 4162 → next square down = 4161.
6. [2] A hill (1 mark) with concentric contours increasing inward to ~120 m (1 mark).
Marking: ID landform 1, description 1.
Section B: Graph and Data Interpretation
7. [1] January
Teaching note: Highest value in table = 200 mm (Jan).
8. [2] 200 + 180 + 150 = 530 mm
Working: Jan 200 + Feb 180 + Mar 150 = 530. 1 mark method, 1 mark answer.
9. [1] 31°C
Teaching note: Read April bar height = 31.
10. [2] Temperature increases from 26°C in Jan to 33°C in Jun (1 mark), showing a rising trend (1 mark).
Marking: Values 1, trend 1.
11. [1] 30%
Teaching note: Slice labelled Agriculture = 30%.
12. [2] Population increased from 3.0 million (2010) to 5.1 million (2020) (1 mark), a rise of 2.1 million (1 mark).
Marking: Start/end 1, change 1.
13. [2] Day 4 (1 mark), 80 m³/s (1 mark).
Teaching note: Highest point on line.
Section C: Integrated Data Skills
14. [2] Site A (1 mark) because it has lower turbidity (2 NTU vs 10) and higher dissolved O₂ (8 vs 4) (1 mark).
Marking: Site 1, reason 1.
15. [2] Site B has turbidity 10 NTU meaning more particles/sediment (1 mark) which can block light and increase bacteria using oxygen, lowering O₂ (1 mark).
Marking: Link turbidity 1, explain O₂ 1.
16. [1] 5121
Teaching note: Factory at grid 5121.
17. [1] North-east (or NE)
Teaching note: From forest 5020 to factory 5121 = east + north = NE.
18. [2] Water use decreased from 170 L/day (2000) to 145 L/day (2020) (1 mark), a downward trend (1 mark).
19. [2] 170 − 145 = 25 L/day
Working: 1 mark subtraction, 1 mark answer.
20. [2] Not sensible (1 mark): forest is south-west of factory, so it cannot protect from pollution coming from factory; forest may filter air/water but not as stated (1 mark).
Marking: Judgement 1, geography reason 1.
Free quiz and exam paper access
Enter your details to view this paper
Your access is remembered on this device.